
Page 1 of 29
Chapter 10: The Tools of Quality
Chapter Outline
• Improving the System
• Ishikawa’s Basic Seven Tools of Quality
• The Seven New Tools for Improvement
• Other Tools for Performance Measurement
Overview
Chapter 10 starts the section on the tools that can be used to implement quality.
So far, the text has looked at the various functional areas of business. As we know, they
do not operate in a vacuum. Implementing quality involves looking at ways to optimize
this interdependency. Chapter 10 introduces some of the fundamental tools that have
proven successful.
Page 2 of 29
Discussion Questions
1. Why is it important to pursue quality management from a systems perspective?
As we have seen, no part of the business operates independently. For a quality system to
be successful, the interrelationships between the business systems must be taken into
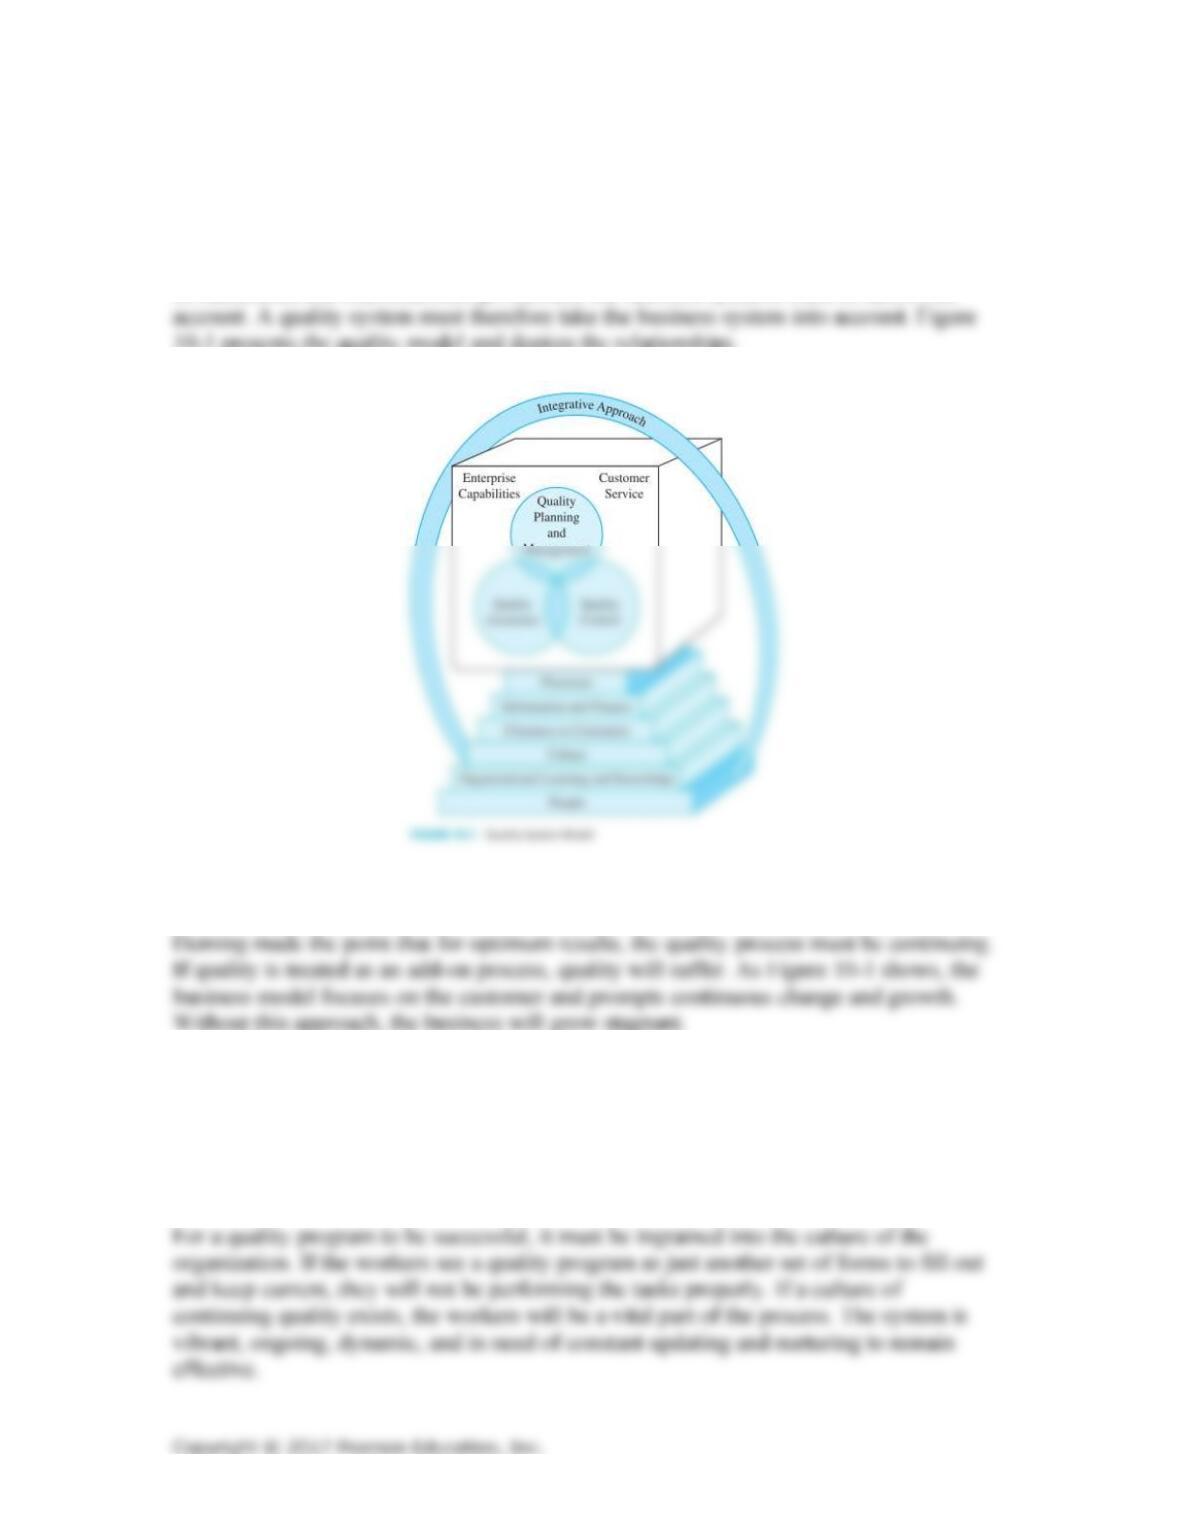
10-1 presents the quality model and depicts the relationships.
2. Why is continual improvement necessary for a business organization?
3. The statement has been made that “A quality system is not just a series of boxes
and arrows. It is an interconnected, interdisciplinary network of people, technology,
procedures, markets, customers, facilities, legal requirements, reporting
requirements, and assets that interact to achieve an end.” What does this statement
mean to you?
4. How do the basic tools work within W. E. Deming’s plan–do–check–act (PDCA)
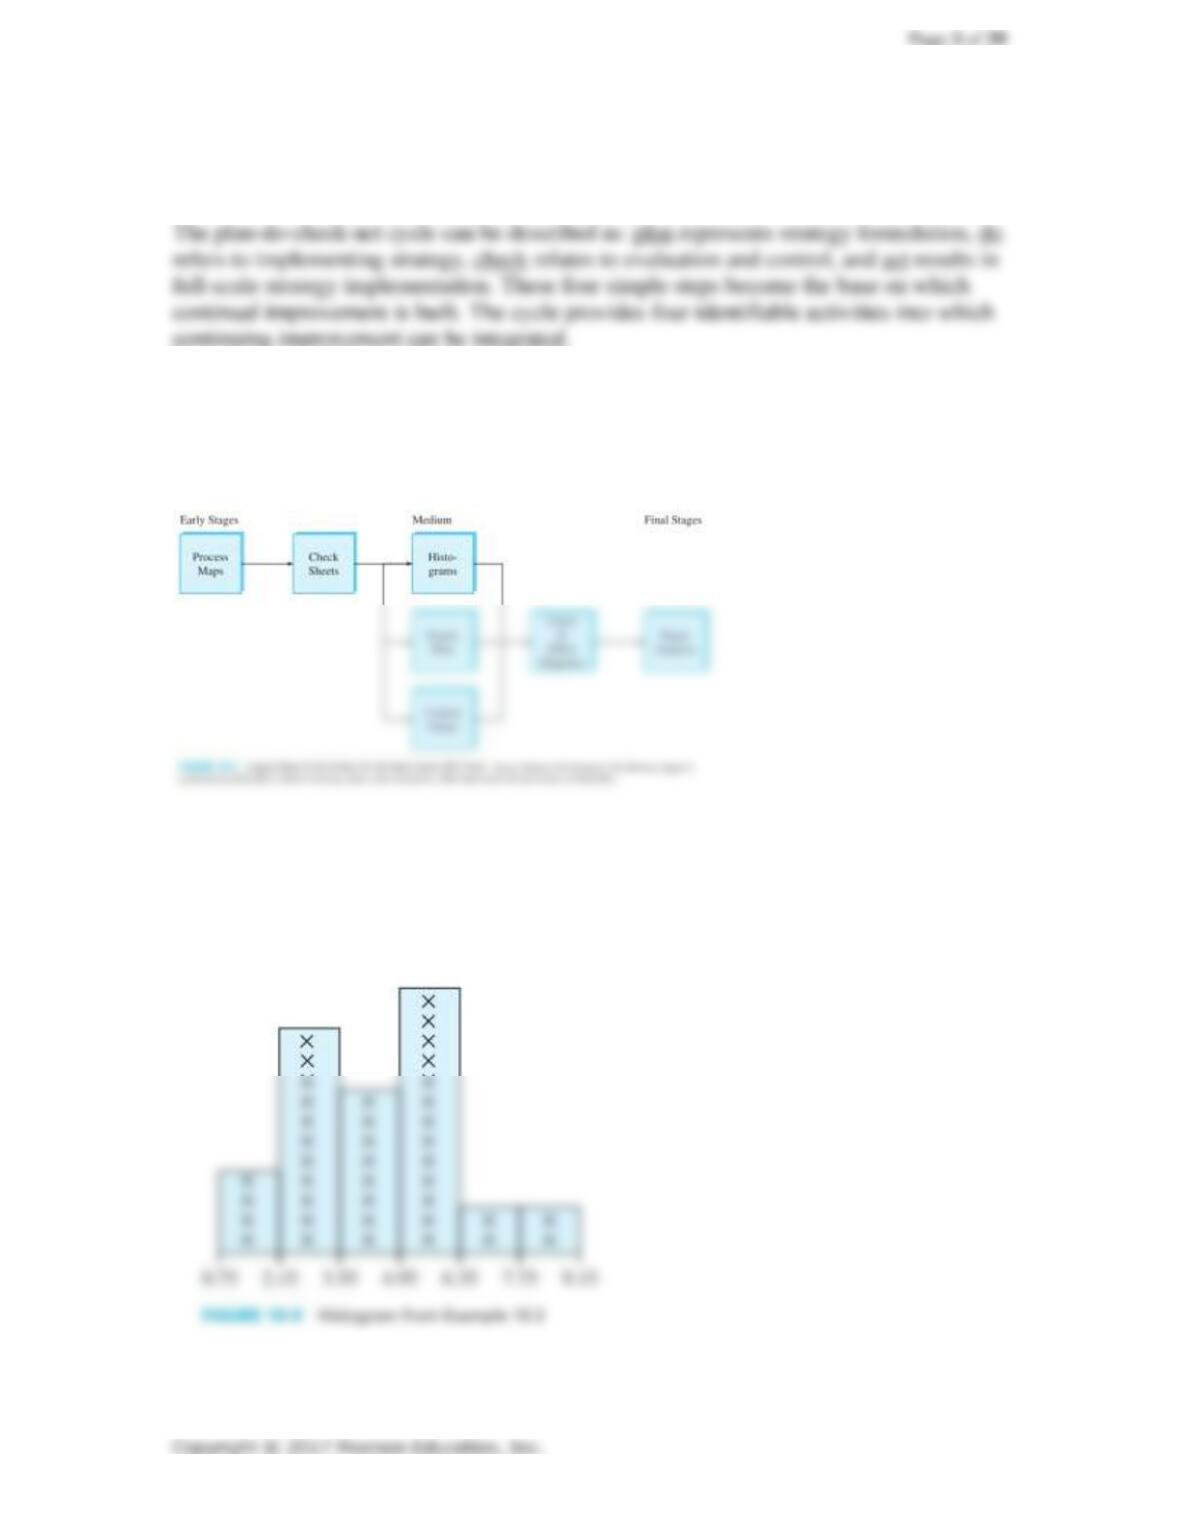
cycle as a process for continual improvement?
5. What are the seven basic tools of quality? Who developed these tools?
Kaoru Ishikawa identified seven tools that, when used together, provide a path to
continuing quality improvement.
6. Describe the purpose of a histogram.
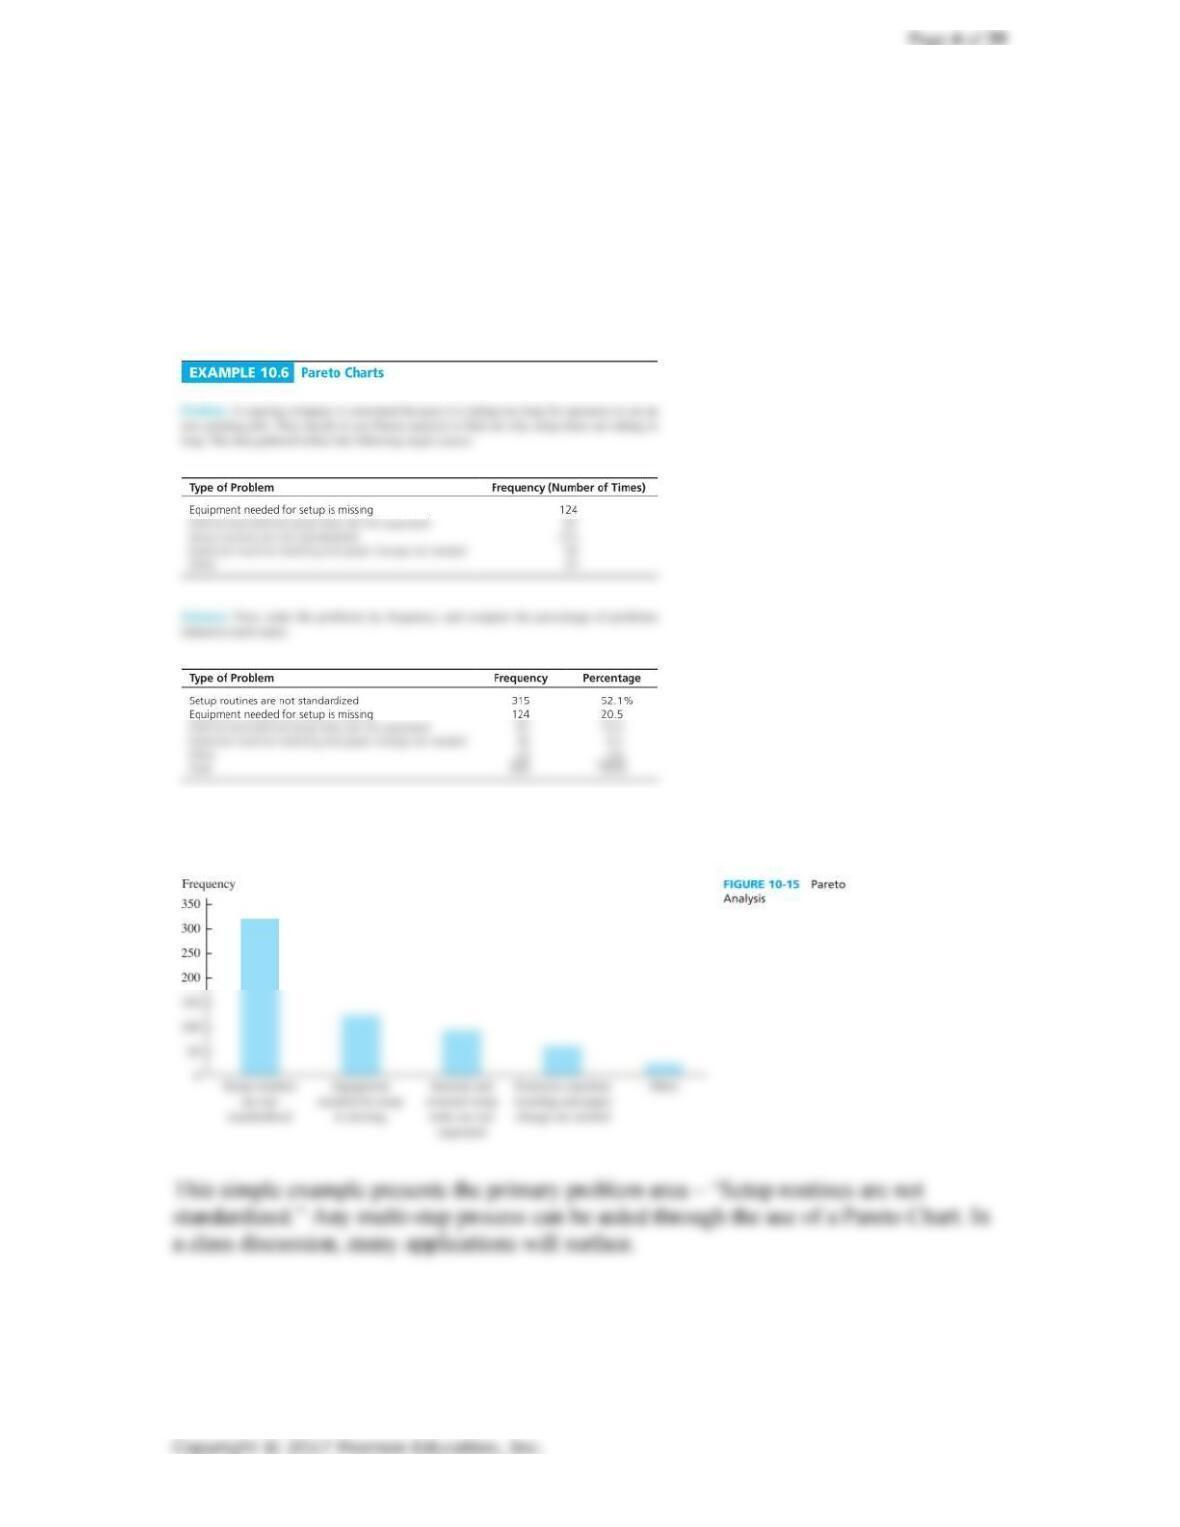
The figure below presents a histogram. As stated on page 249, histograms are simply
graphical representations of data in a bar format. This histogram provides a comparison
between occurrence and sales for various sales registers.
7. Describe the purpose of a Pareto chart. Describe an instance (other than the one
in the book) in which a Pareto chart could be effectively used.
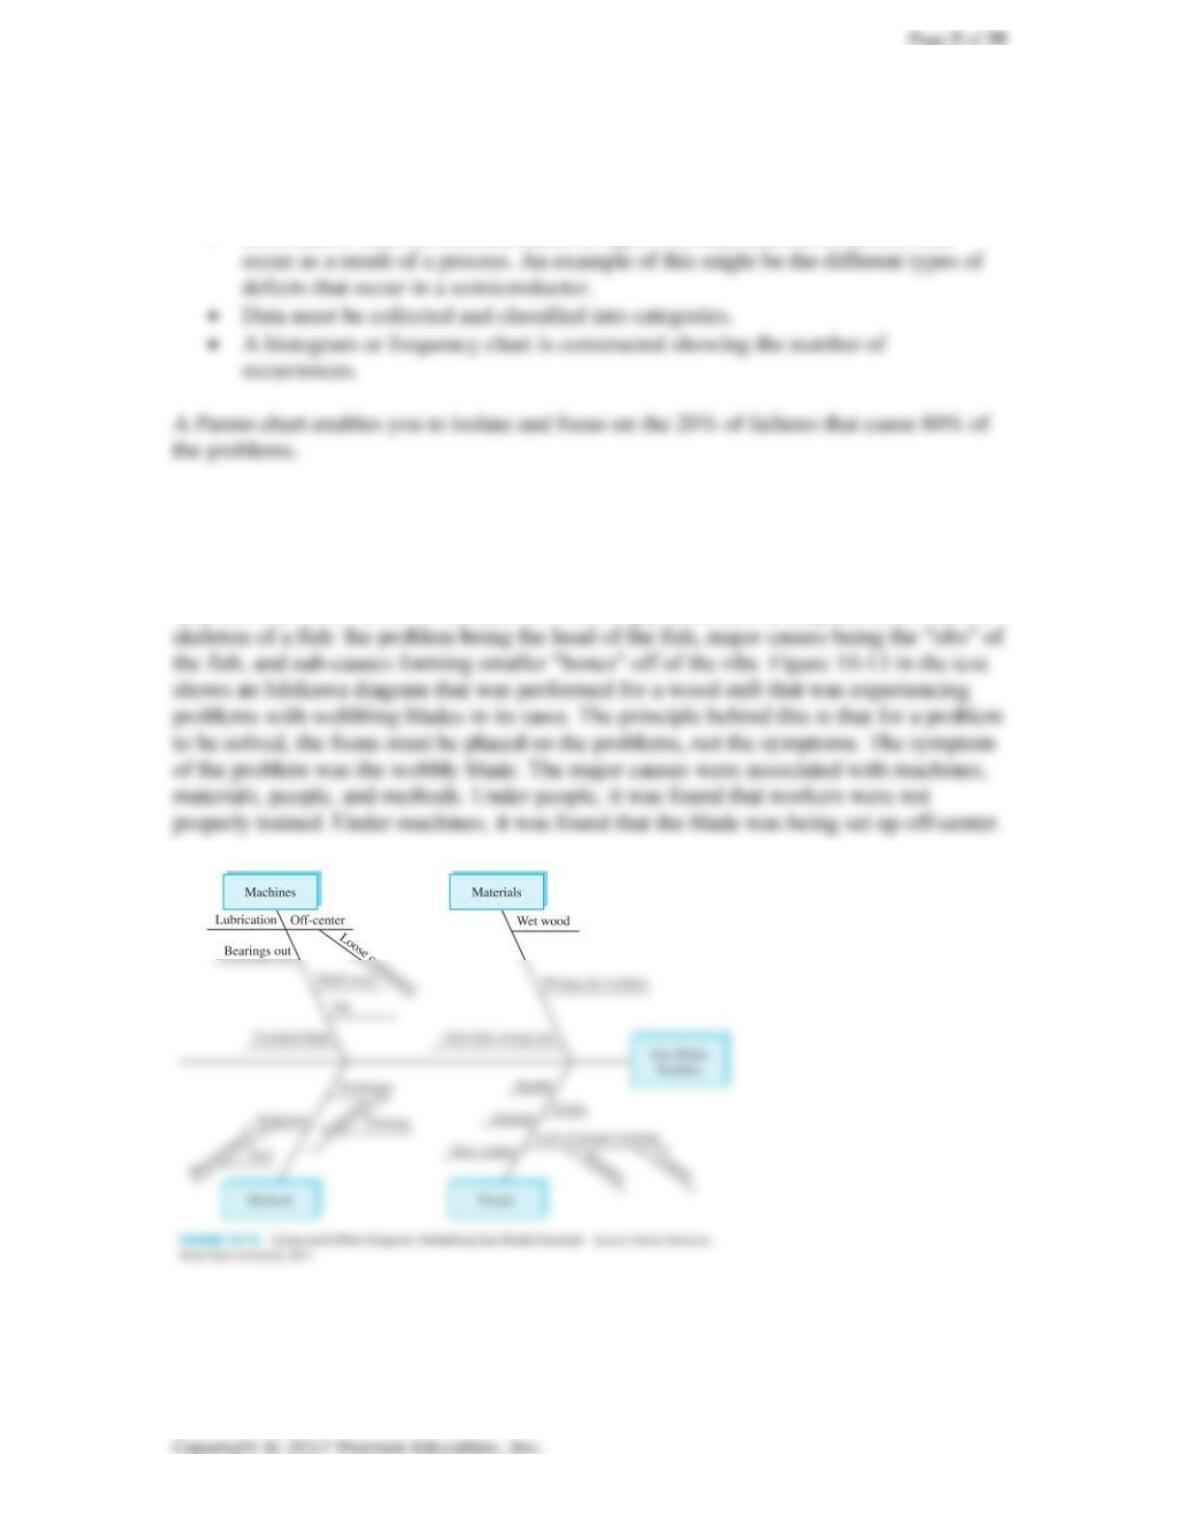
A Pareto Chart is a histogram that allows the analyst to identify and prioritize potential or
real problems based upon Juran’s “80/20” rule.
The example on page 256 and 257 present the following:
The frequencies of each problematic area are then plotted:
8. What are the three basic rules for constructing Pareto charts?
On page 256, the three basic rules are presented as:
• Information must be selected based on types or classifications of defects that
9. What is the purpose of a cause-and-effect (Ishikawa) diagram?
Often, workers spend too much time focusing improvement efforts on the symptoms of
problems rather than the causes. The Ishikawa cause and effect diagram is a good tool to
help move to lower levels of abstraction in solving problems. The diagram looks like the
Page 6 of 29
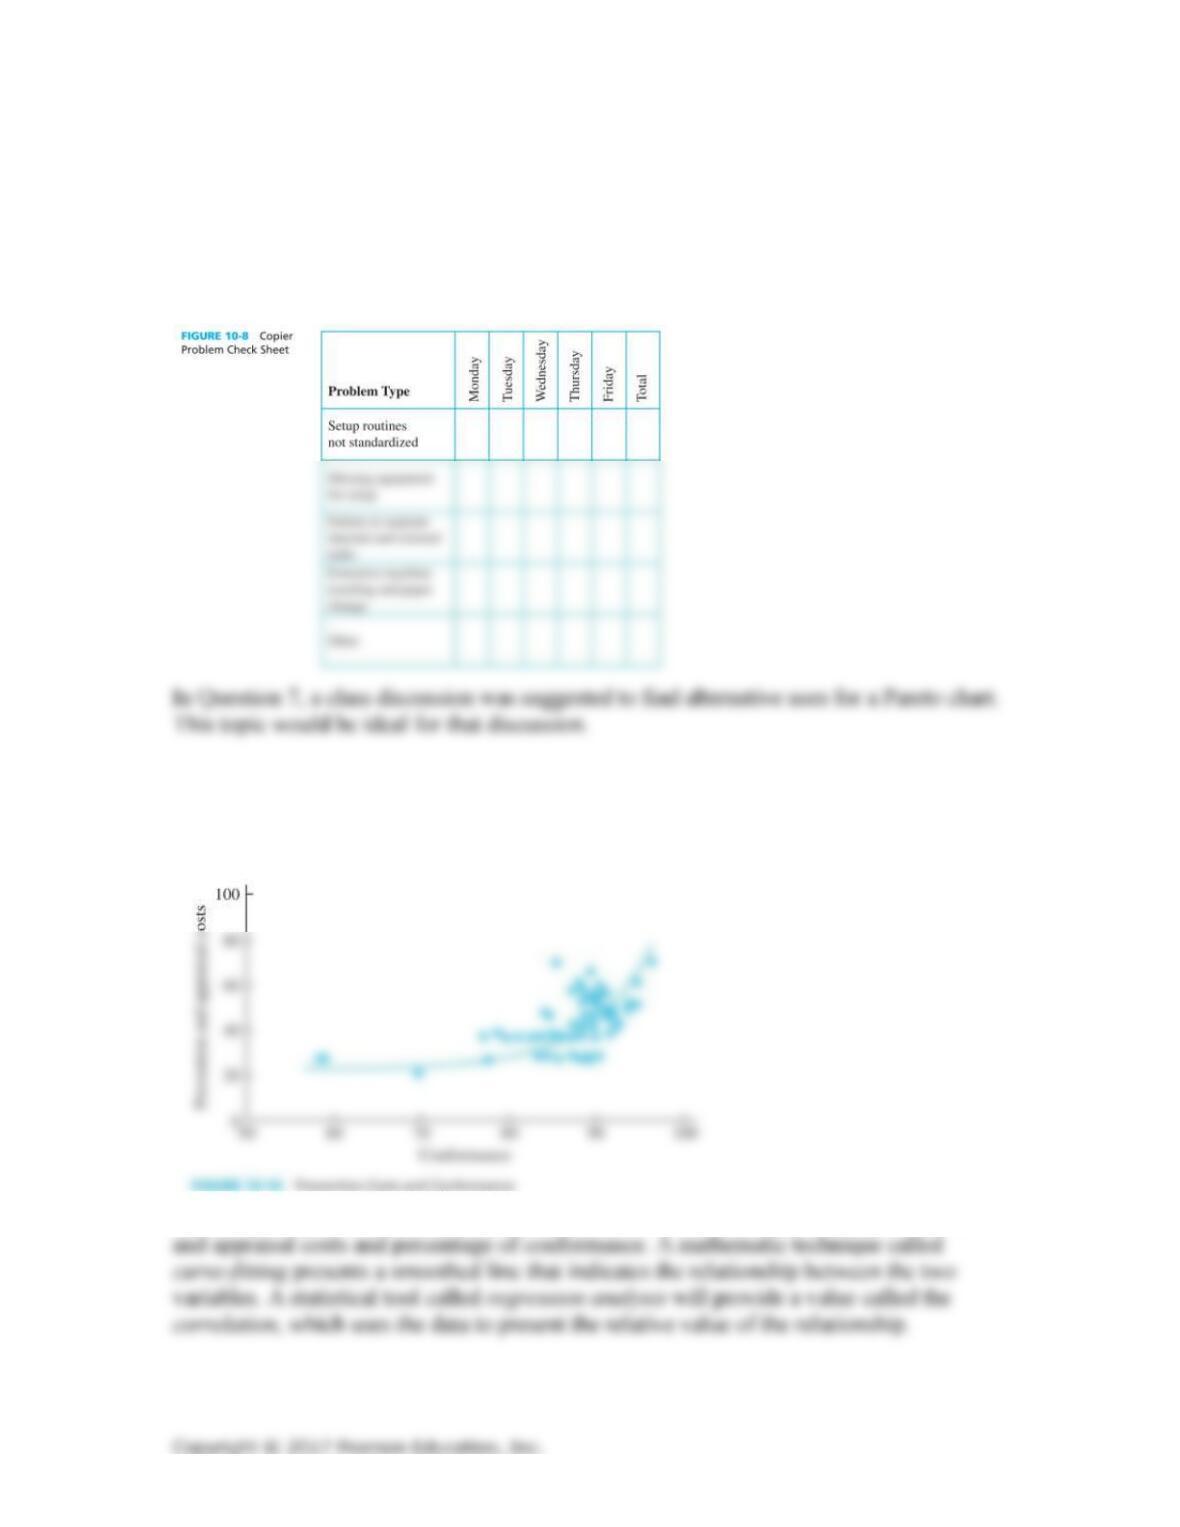
10. Describe the purpose of a check sheet. Describe an instance (other than the ones
in the book) in which a check sheet could be effectively used.
A check sheet is a simple mechanism that is used to gather information used to diagnose
a problem. On page 248, the text shows a check sheet to collect information that will be
used to compile a histogram.
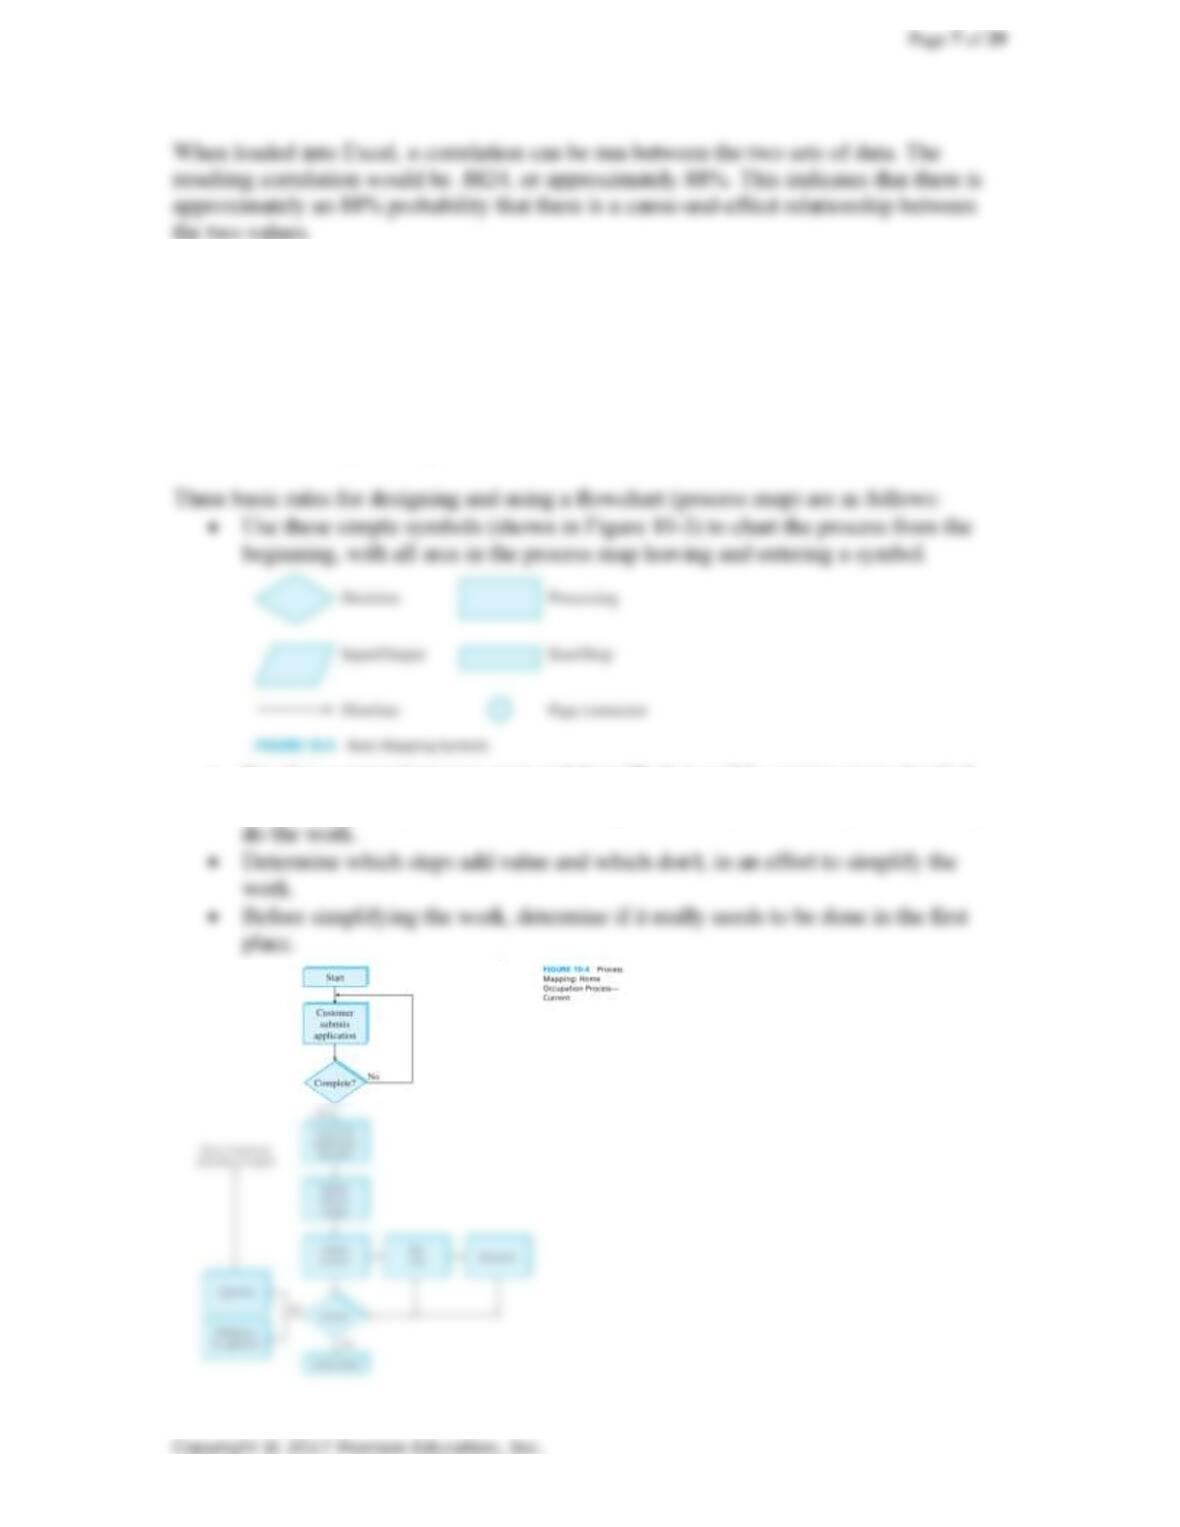
11. Describe the purpose of a scatter diagram.
Figure 10-10 presents a scatter diagram:
This diagram presents a series of points that show the relationship between prevention
12. Describe the purpose of a flowchart (process map). What are three of the rules
for designing and using flowcharts (process maps)?
A process map (flowchart) is a picture of a process. The first step in many process
improvement projects is to create a map of the process, as it exists. This step presents the
parameters for process improvement. The concept is that one must know the process
before it can be improved upon.
• Develop a general process map and then “flesh it out” by getting more detailed.
• Step through the process by interviewing those who perform the process as they
13. What is the purpose of a control chart?
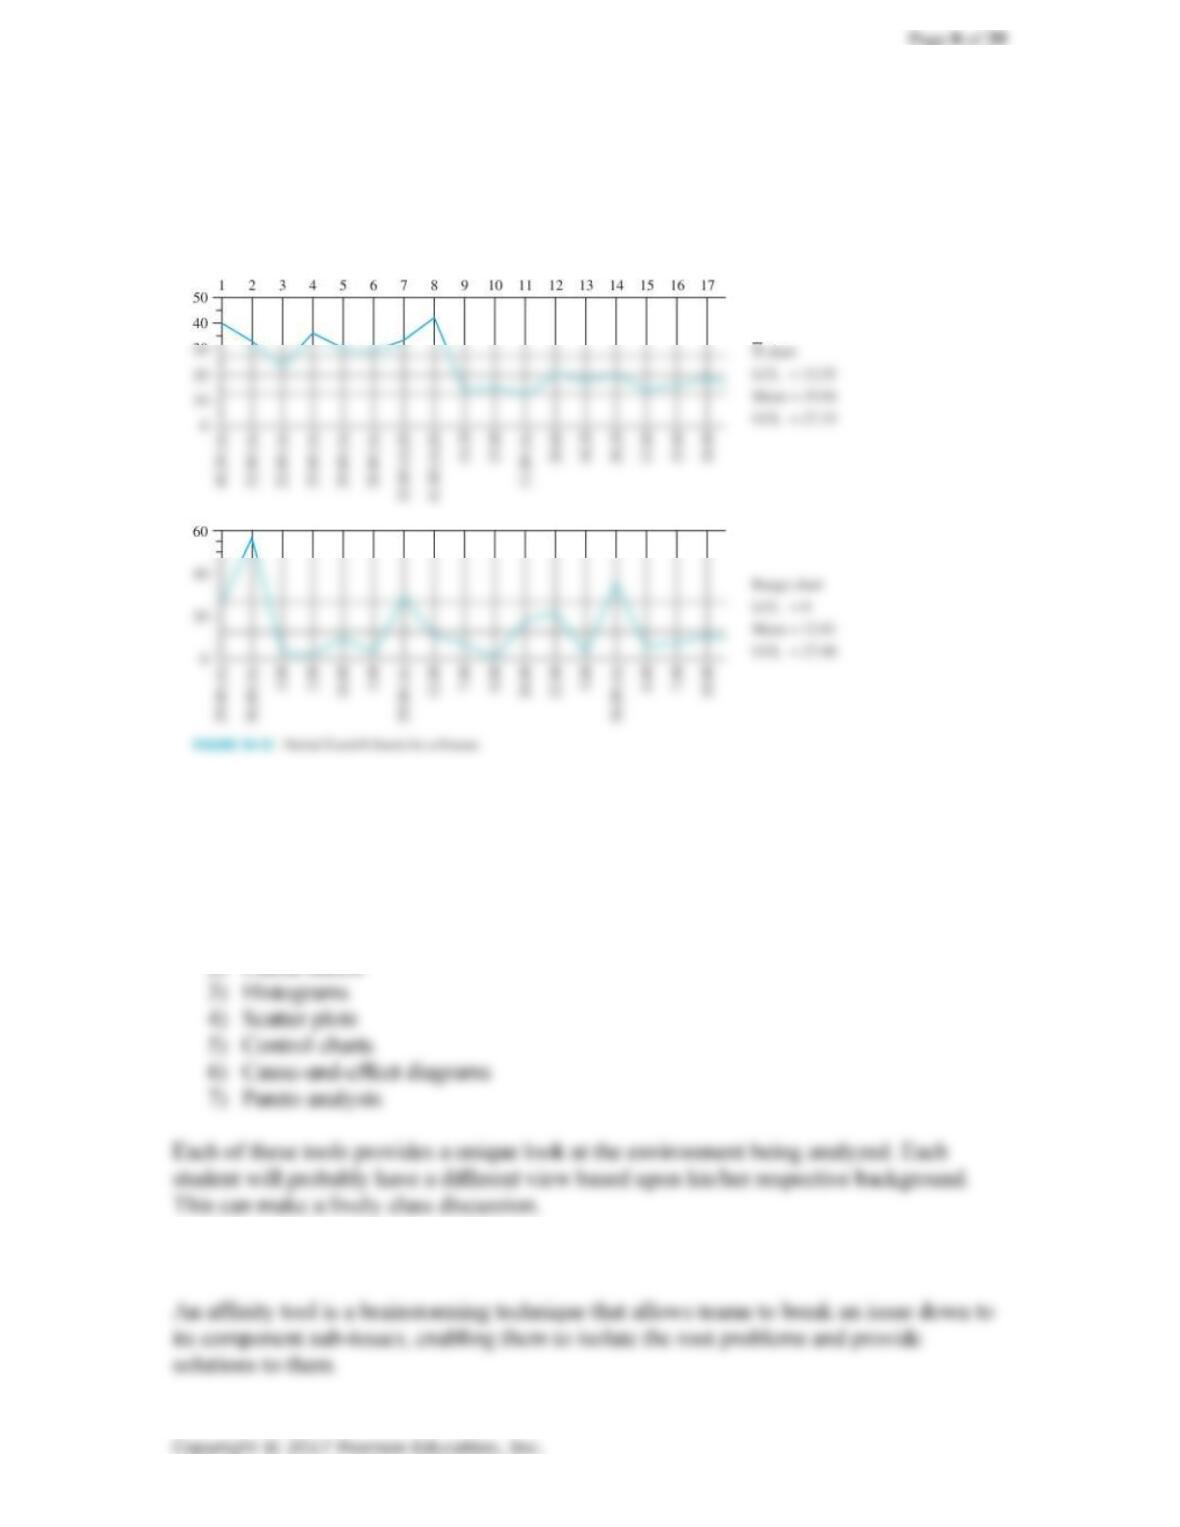
A control chart provides information about a product or service that has measurable
quantities. Figure 10-12 presents two control charts together:
14. Which of the seven (Ishikawa) tools of quality described in the chapter have
been the most helpful to you in your experiences? Please make your answer as
substantive as possible.
Ishikawa’s seven basic tools consist of:
1) Process maps
2) Check sheets
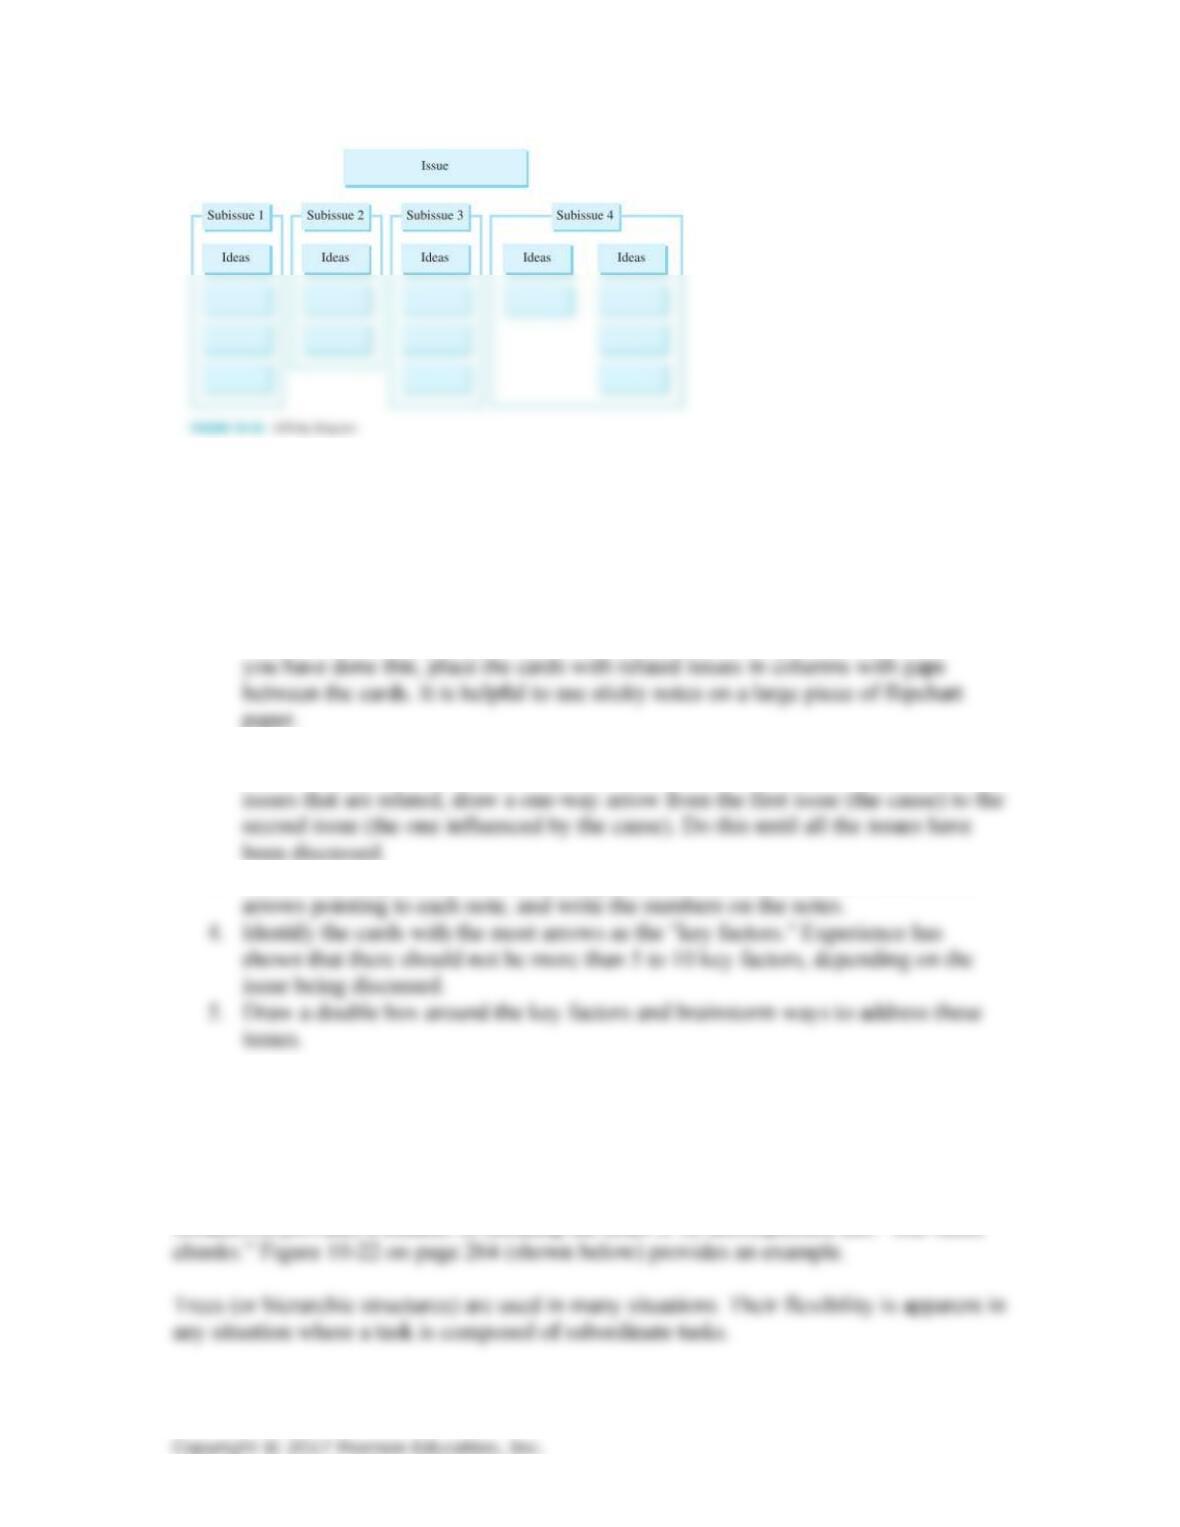
15. What is the purpose of an affinity diagram?
Page 9 of 29
16. Describe the purpose of an interrelationship digraph?
The interrelationship diagraph is a continuation of the affinity diagram. It is designed to
locate any possible errors that might result from the relationship between different issues.
On page 262, the steps involved in creating this document are identified as:
1. Construct an affinity diagram to identify the issues relating to a problem. After
2. Create the digraph by examining the cards one by one asking, “What other issues
on this digraph are caused or influenced by this issue?” As team members identify
3. After reviewing the arrows and making needed revisions, count the numbers of
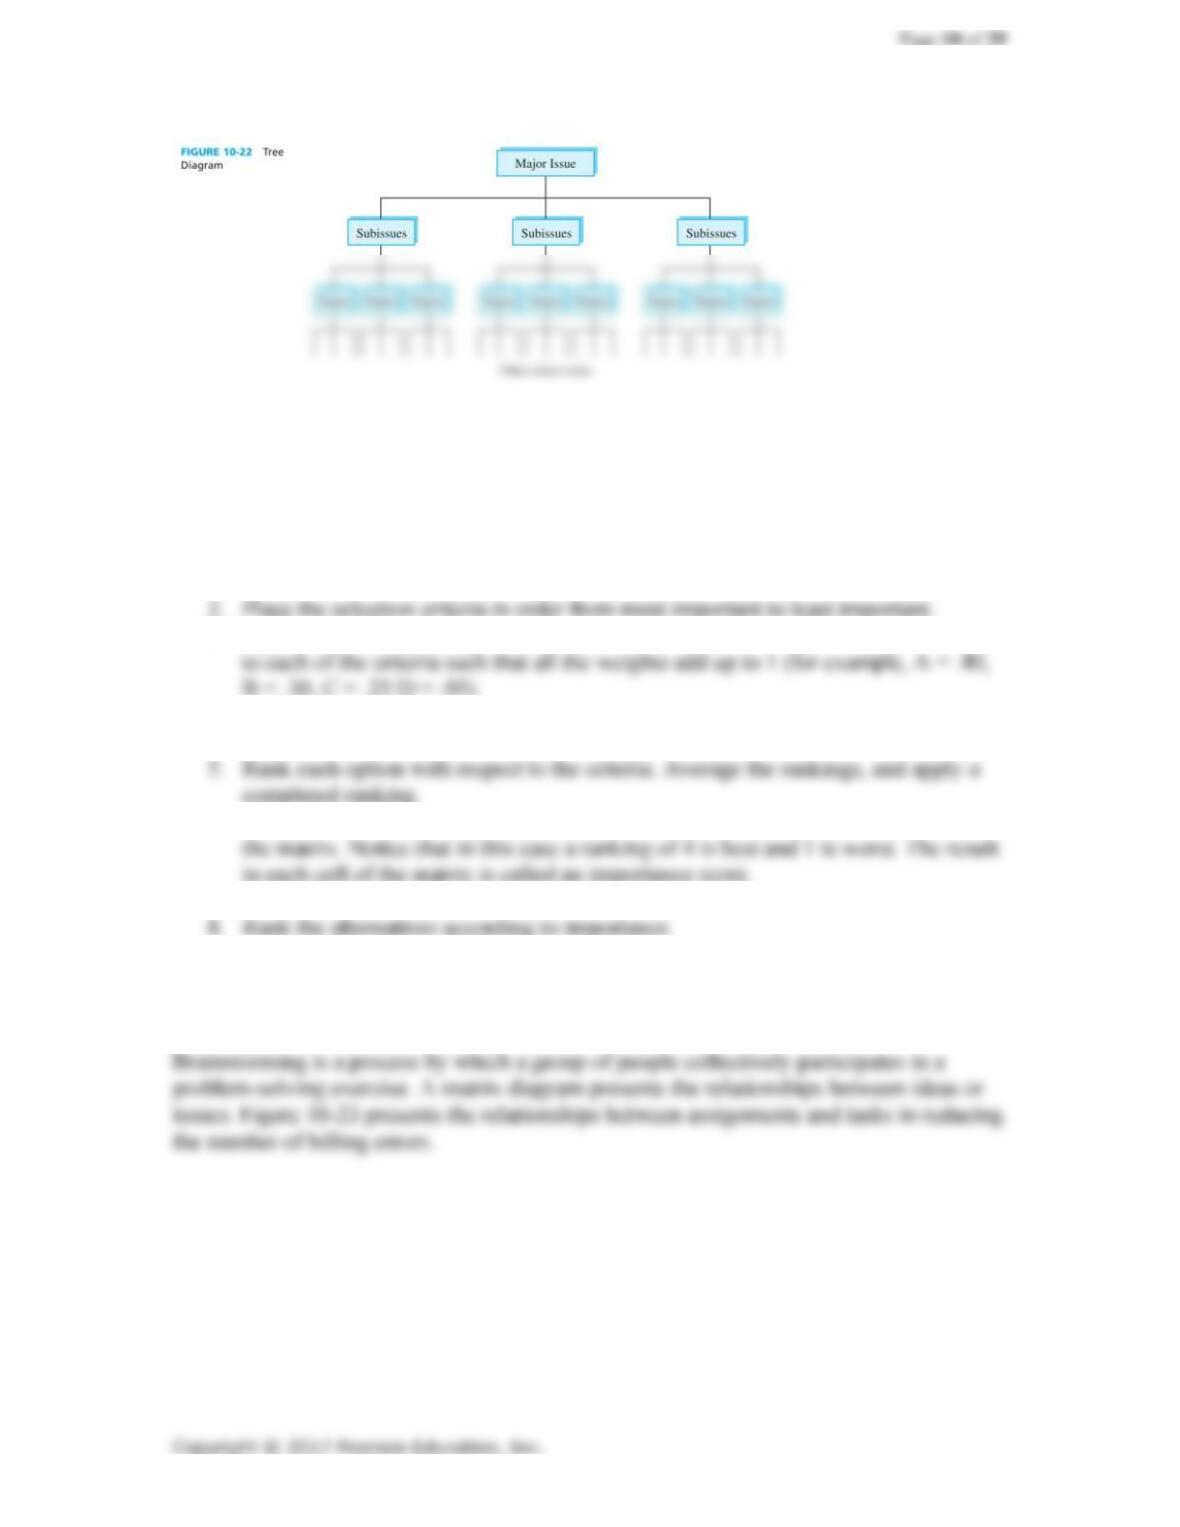
17. Describe the purpose of tree diagrams. Describe an instance in which a tree
diagram could be used.
A tree diagram is accomplished by breaking a task down to its composite sub-tasks; this
is done iteratively until a base activity level has been reached. The resulting hierarchic
breakdown provides a manner of breaking the tasks to be accomplished into “bite-sized
18. Describe the purpose of a prioritization grid.
A prioritization grid allows a person to evaluate the options and assign weights to them to
aid in the solution. The steps in creating a prioritization grid are presented on page 264:
1. Determine your goal, your alternatives, and the criteria by which a decision is to
be made.
3. Apply a percentage weight to each of the criteria for each option. Apply a weight
4. Add the individual rating for each criterion to come to an overall ranking. Divide
by the number of options to find an average ranking.
6. Multiply the criteria weight by its associated criterion rank for each criterion in
7. Add the importance scores for each alternative.
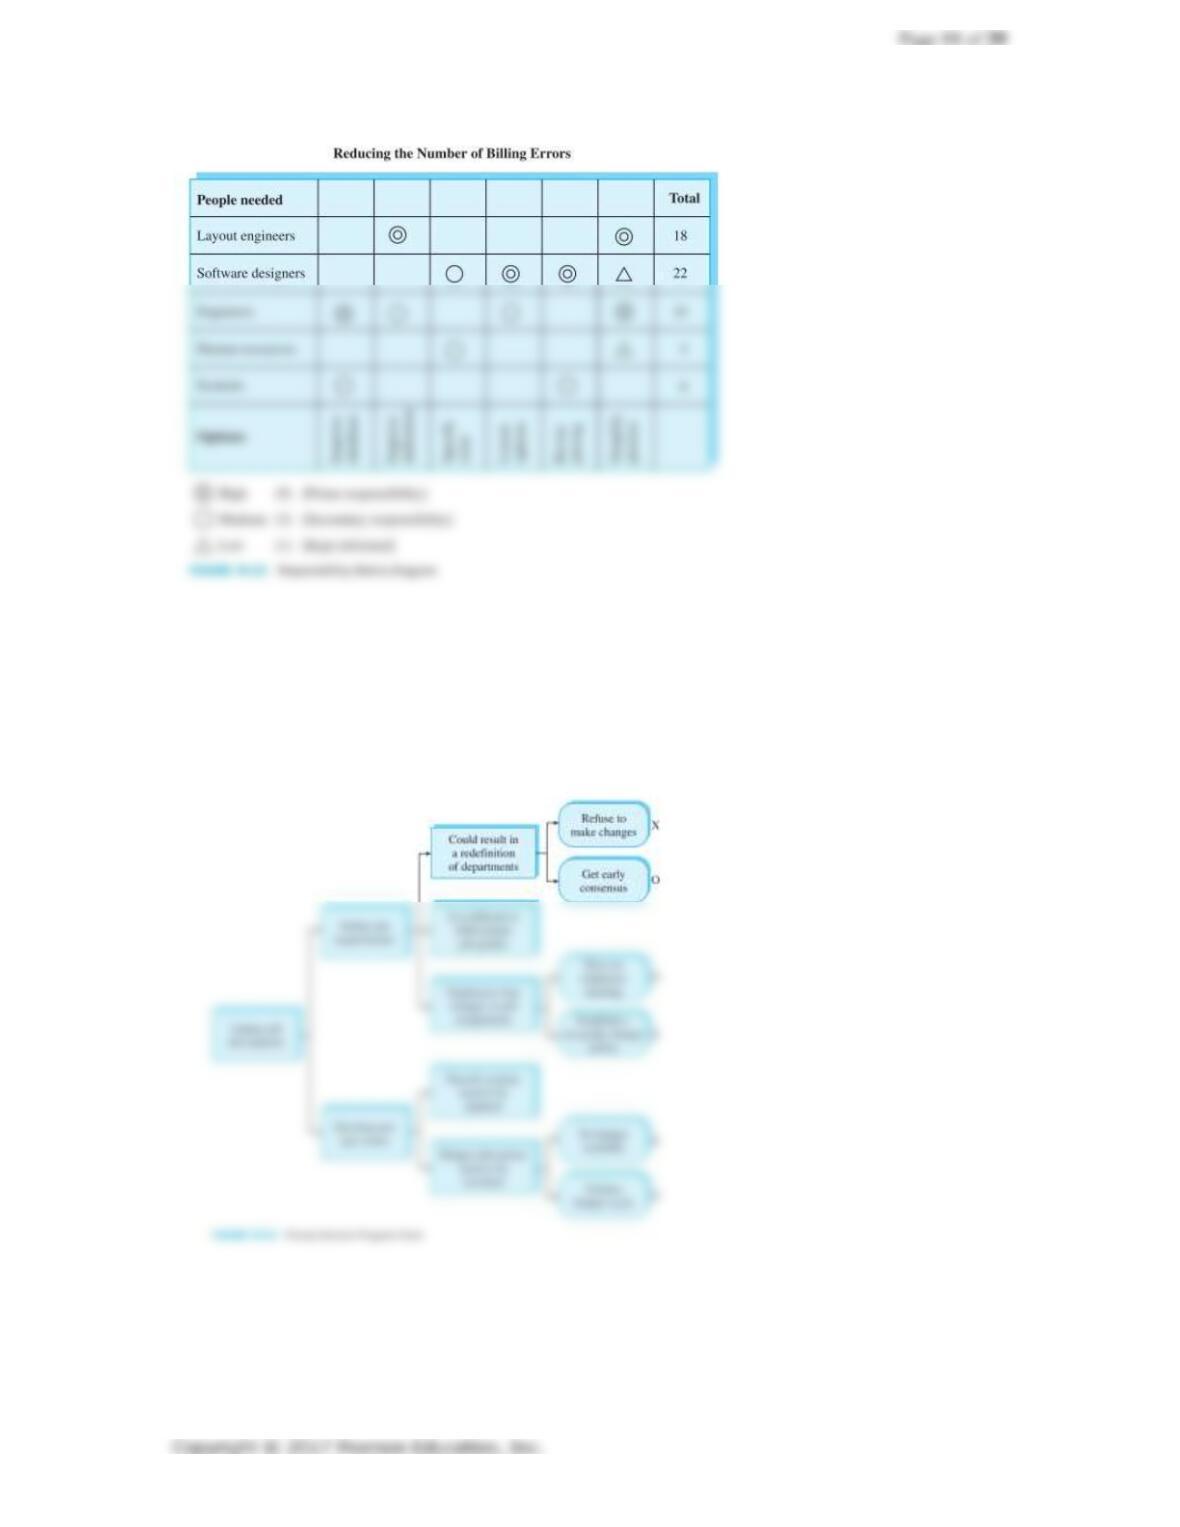
19. Describe the purpose of a matrix diagram. In what ways is the matrix diagram a
brainstorming tool?
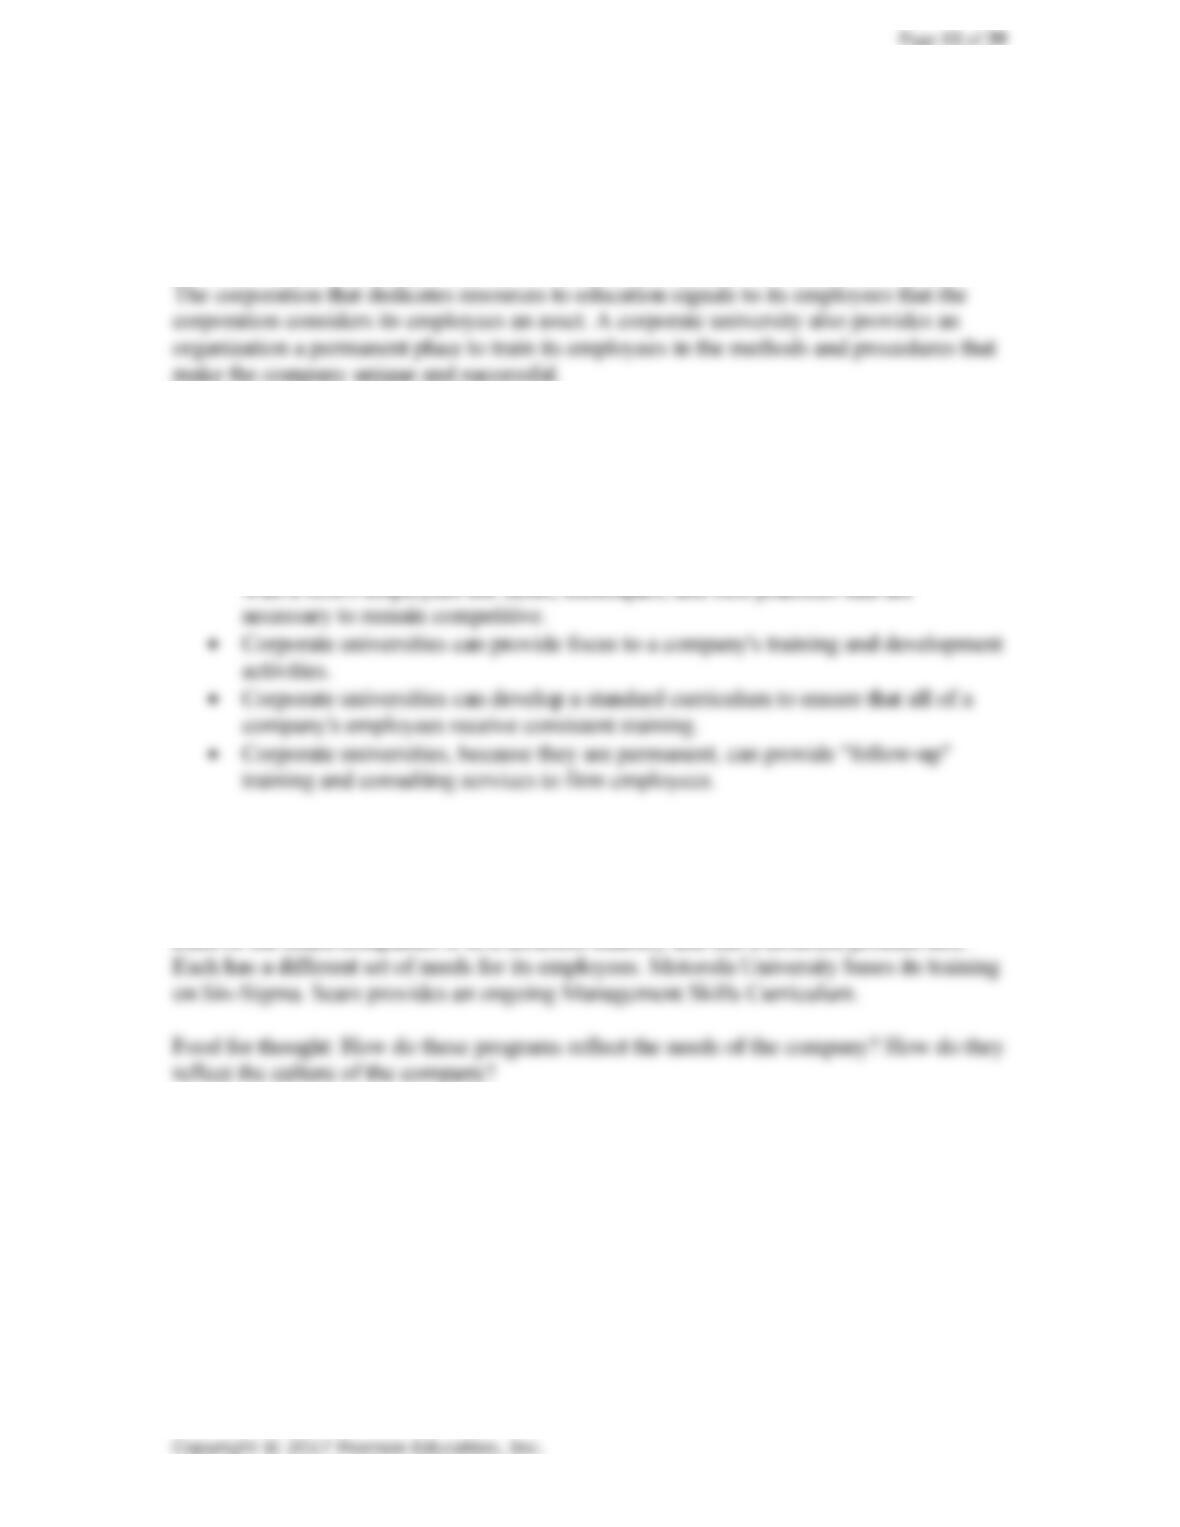
20. What is the purpose of a process decision program chart?
A process decision program chart is used to help brainstorm possible contingencies or
problems associated with the implementation of some program or improvement. The tool
can take the form of either an outline or a tree chart. Figure 10-24 on page 268 shows a
process decision program chart in tree form.
Case 10-1: Corporate Universities: Teaching the Tools of
Quality
1. Are corporate universities a good idea? If so, why?
2. How can a corporate university do a better job of teaching a firm’s
employees the “tools of quality” than traditional training programs?
Corporate universities can do a better job of teaching a firm’s employees the “tools of
quality” than traditional training programs in the following ways:
• Corporate universities can prioritize a firm’s training initiatives and quickly share
3. Select a corporate university and visit its website. How does the company’s
corporate university facilitate the company’s overall quality-related goals
and initiatives?

Case 10-2: Lanier: Achieving Maximum Performance by Supporting
Quality Products with Quality Services
1. Why was it important for Lanier to develop specific programs, such as
Customer Vision and Performance Promise, to facilitate its dual emphasis on
quality products and quality services?
The specific programs focus Lanier’s employees and customers on areas that have been
particularly important to the company in achieving its dual emphasis on quality products
2. What steps has Lanier taken to reinforce the importance of quality services
to its employees?
3. Do you believe that Lanier continued to be successful? Why or why not?
Lanier has grabbed an interesting niche. The field of document production has been

Page 14 of 29
Suggested Answers to End of Chapter Problems
1.
2.
3.
4.
5.
6.
7.
Develop a process map of washing a car. Include a high level of detail in your
map. Make six recommendations for improvement to your process.
Take the process map from Problem 1 and develop it into an extended process
map. Make five recommendations for simplifying the extended process as it
exists.
Develop a process map for making chocolate chip cookies. Include a high level
of detail if you need to. You may need to consult a cookbook. Make three
recommendations for improvements to your process. Discuss these with the
class.
See the answer to Problem 1.
Take the process map from Problem 3 and develop an extended process map.
Make recommendations for three improvements to the extended process. Be
sure to include all suppliers and logistics associated with the customers.
See the answers to Problems 1 and 2.
Develop a check sheet for defects in a flat screen computer monitor.
Answers will vary. Use the Figure on page 248 as a guide.
Develop a check sheet for defects in a quality management class exam. Identify
how you would use the check sheet to improve performance on future exams.
Answers will vary. Use the Figure on page 248 as a guide.
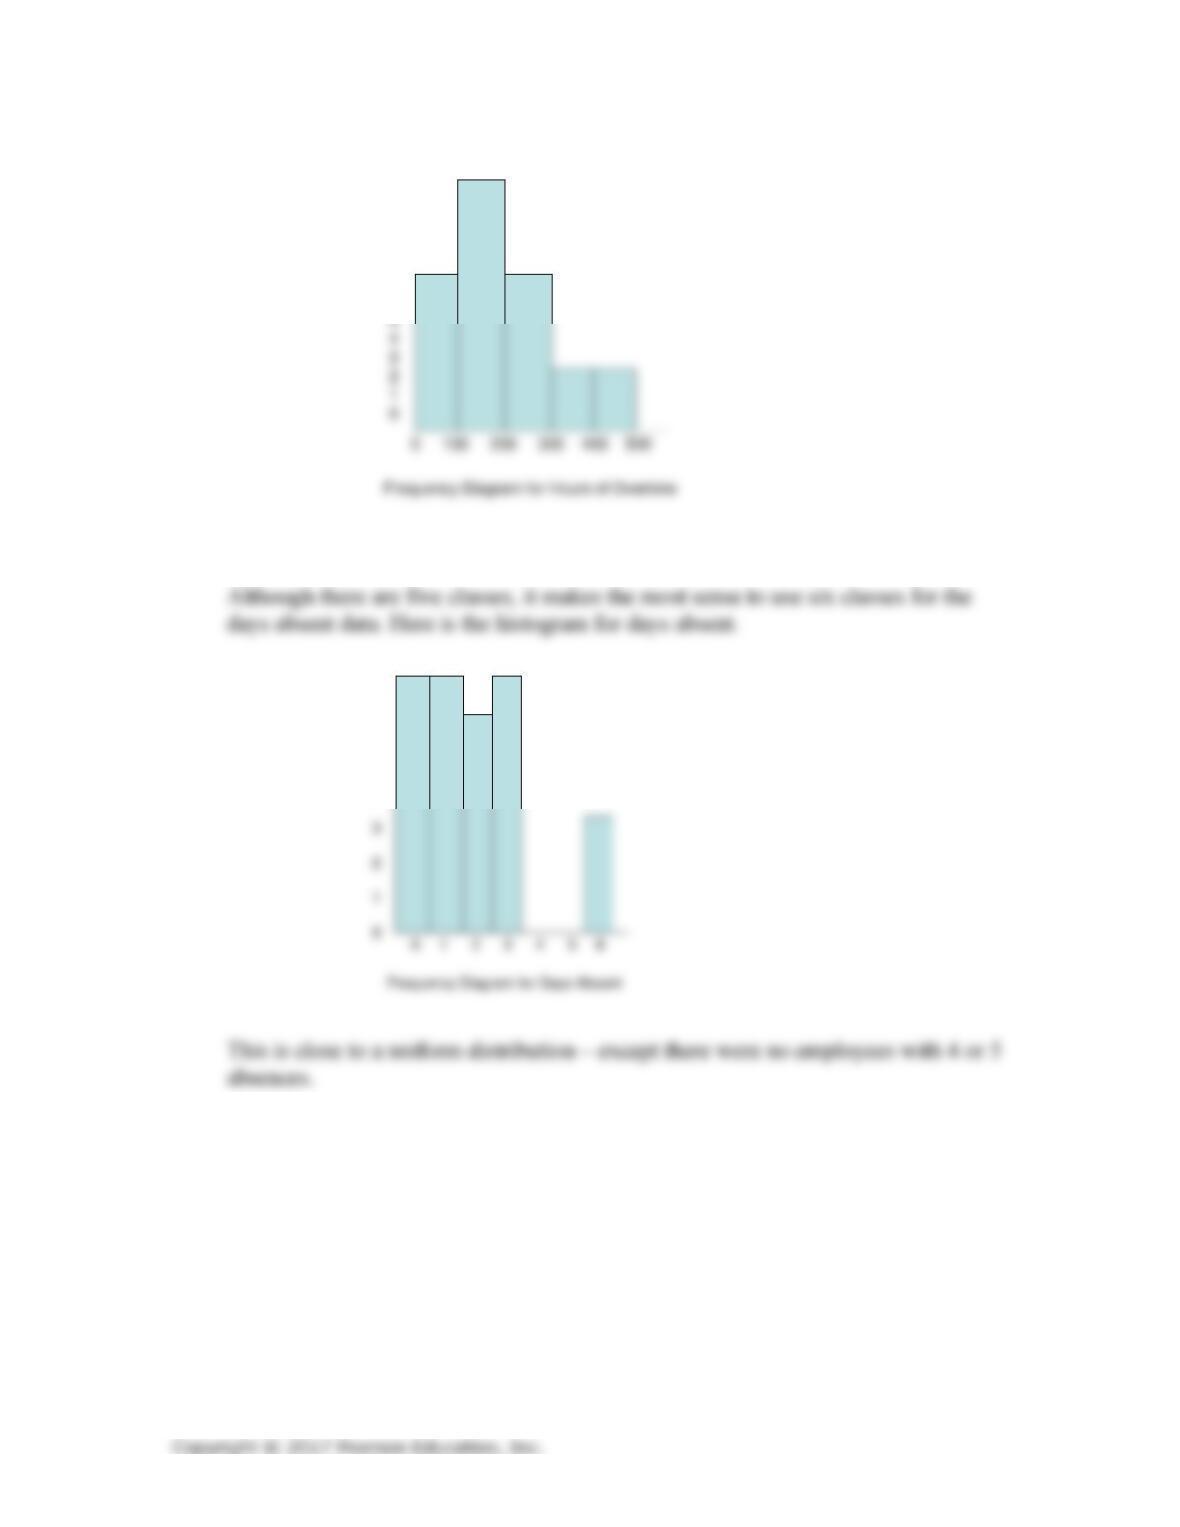
Develop a histogram for the following data (see the data in Problem 8’s
solution). Develop two separate histograms for hours of overtime and days
absent. How do the data appear to be distributed?
Page 15 of 29
8.
The hours of overtime data are right-skewed.
Using the data in Problem 7, develop a scatter plot of hours of overtime versus
days absent. Do the data overtime hours and days absent appear to be
correlated?
Following are the spreadsheet and the Excel output for the scatter plot and
correlation:
12
11
10
9
8
7
6
7
6
5
4