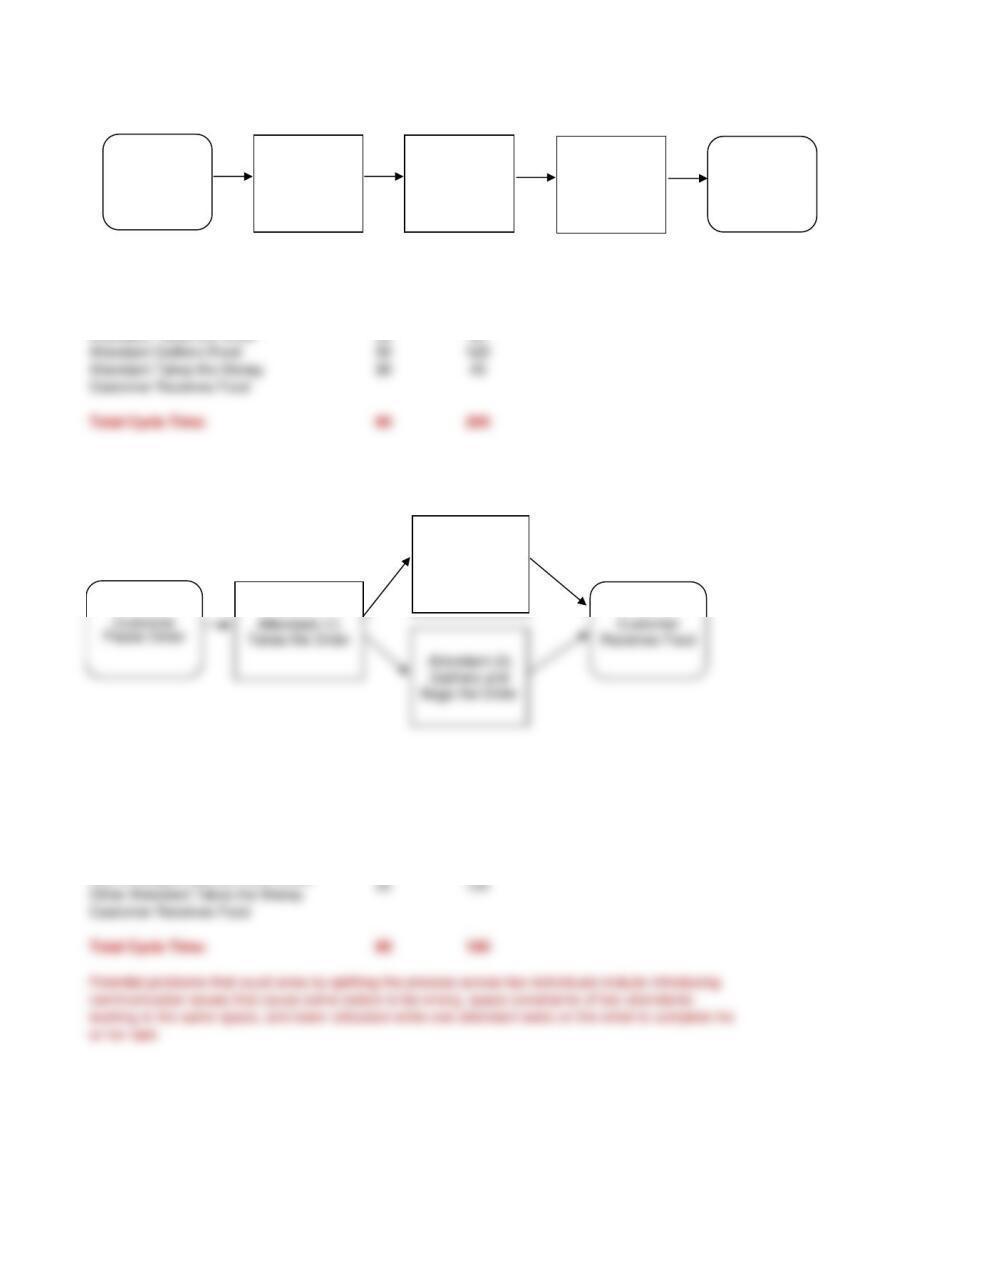
Part a
Customer Places Order
Attendant Takes the Order 30 40
Part b
Customer Places Order
Attendant Takes the Order 30 40
One Attendant Gathers Food While
Process Step
Minimum
Cycle Time
(Seconds)
Longest
Cycle Time
(Seconds)
Process Step
Minimum
Cycle Time
(Seconds)
Longest
Cycle Time
(Seconds)
Attendant
Takes the Order
Customer
Receives
Food
Customer
Places Order
Attendant
Gathers and
Bags the Order
Attendant
Takes the
Money
Attendant (1)
Takes the Money
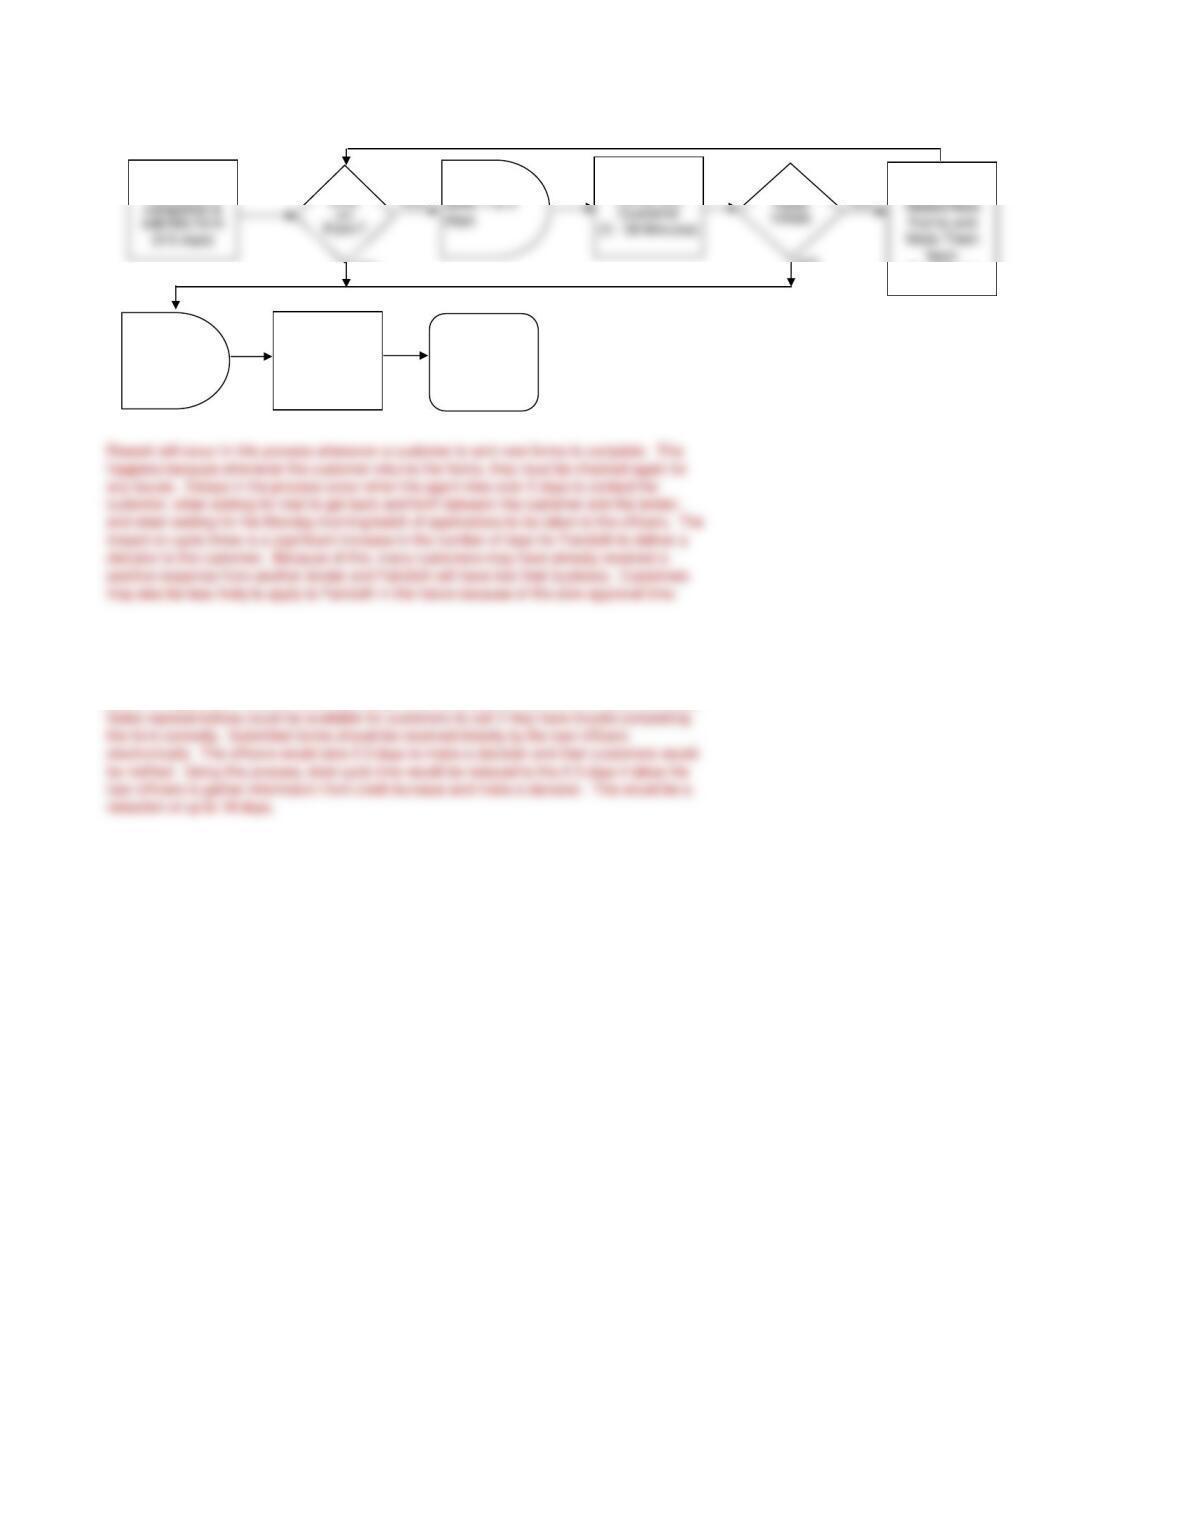
a.)
b.)
Recommended changes to the process would include an online application process that would
check the application and not allow submission until all problems with the form were corrected.
Customer is
Advised of
Final Decision
YES
NO
Agent Corrects
Forms with
NO
Customer is
(5 – 7 Days)
Loan Officers
Process Loan
(2 – 3 Days)
Batch Waits
for Monday
(0 – 5 Days)
Application
Customer
downloads,
Rework will occur in this process whenever a customer is sent new forms to complete. This
happens because whenever the customer returns the forms, they must be checked again for

a.)
Marci 15 20 1.33
Jack 8 15 1.88
Hours
Pages
Productivity
(pages/hour)

11,850 200 9.25
21,361 150 9.07
32,122 150 14.15
WEEK
OUTPUT
(IN UNITS)
LABOR
HOURS
PRODUCTIVITY
(UNITS/HOUR)
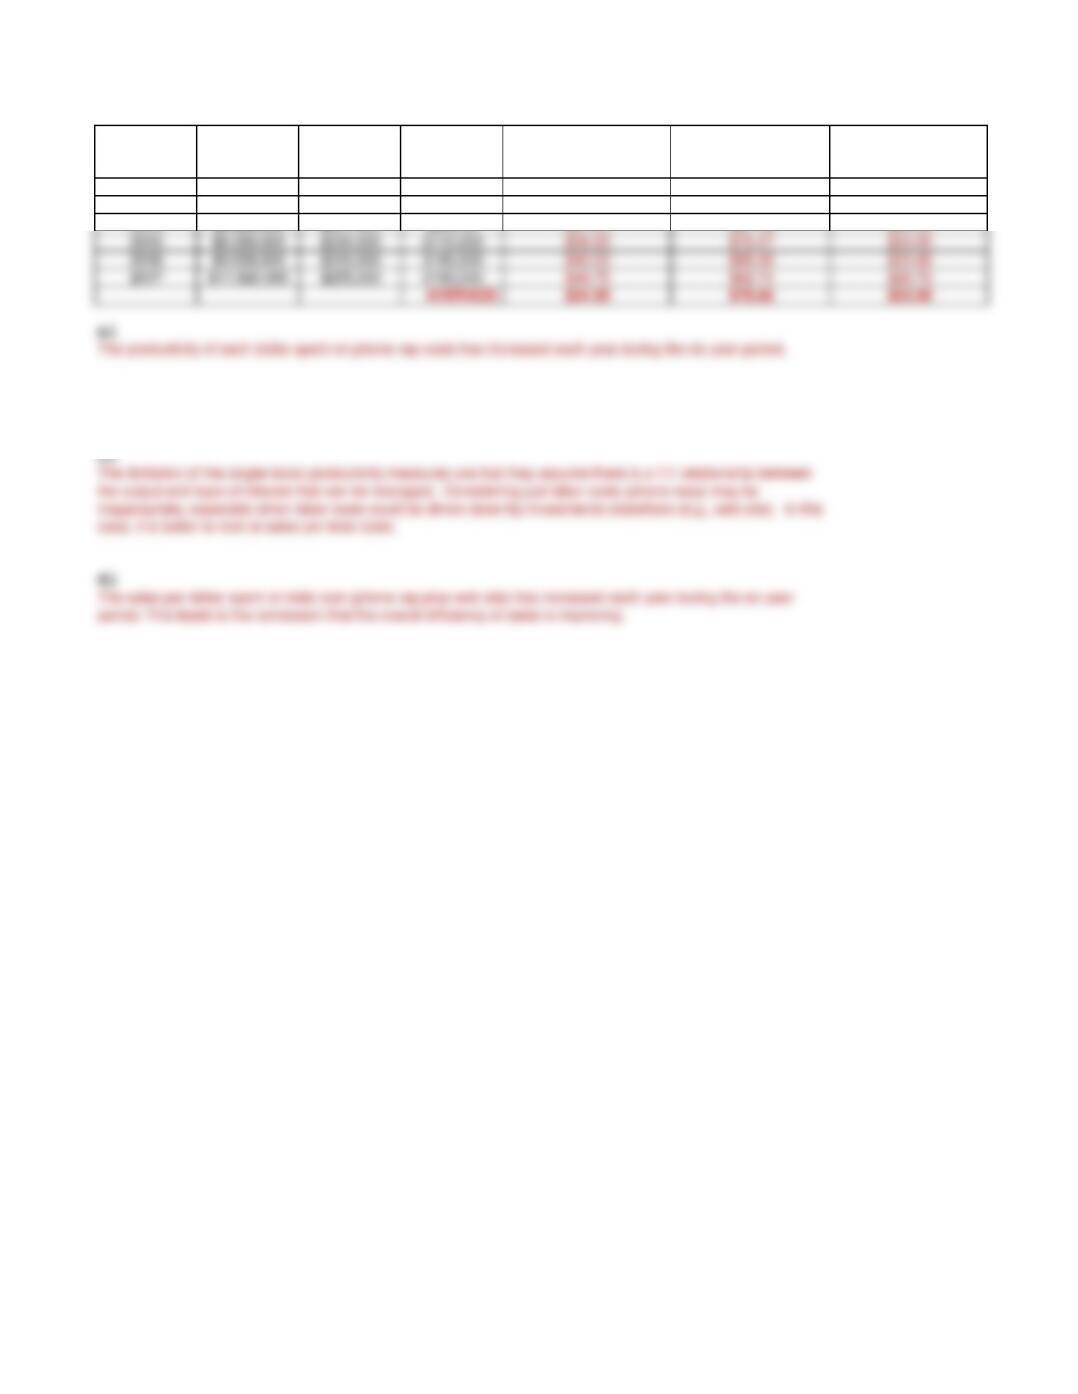
2012 $4,790,000 $200,000 $50,000 $23.95 $95.80 $19.16
2013 $5,750,000 $210,000 $65,000 $27.38 $88.46 $20.91
2014 $6,900,000 $221,000 $85,000 $31.22 $81.18 $22.55
b.)
c.)
d.)
case, it is better to look at sales per total costs.
Part (d): Productivity
(Sales/Total $)
The productivity of each dollar spent on web site costs has decreased each year.
YEAR
TOTAL
SALES
PHONE REP
COSTS
WEB SITE
COSTS
Part (a): Productivity
(Sales/Phone Rep $)
Part (b):Productivity
(Sales/Web Site $)
a.)

Required
(Seconds)
Performance
(Seconds)
Efficiency
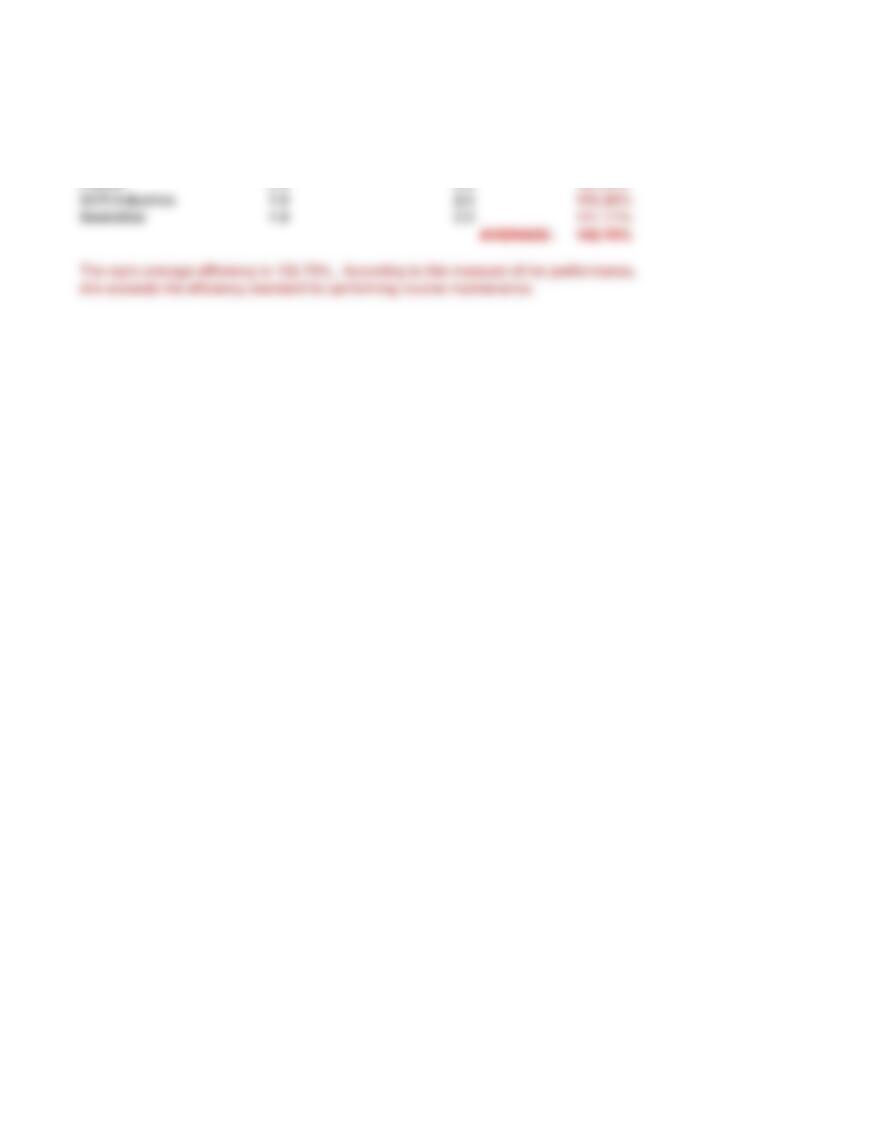
ABC Company 1.8 2.0 111.11%
CUSTOMER
ACTUAL TIME REQUIRED
TO PERFORM ROUTINE
MAINTENANCE (hours)
EFFICIENCY
STANDARD TIME TO
PERFORM ROUTINE
MAINTENANCE (hours)
a.)
Standard Time
Actual Time Taken to
Standard Time
Actual Time Taken to

45 2 3 10.0%
TIME
WAITING
IN LINE
TIME HAVING
EYES
TESTED
TIME HAVING
PICTURE
TAKEN
PERCENT
VALUE-
ADDED TIME
a.)
b.)
Magical Mushroom 30 10 40 25.00%
PERCENT
VALUE-
ADDED TIME
RIDE
AVERAGE
WAITING TIME
LENGTH
OF RIDE
TOTAL
PROCESS
TIME
PERCENT
VALUE-
ADDED TIME
RIDE
AVERAGE
WAITING TIME
LENGTH
OF RIDE
TOTAL
PROCESS
TIME
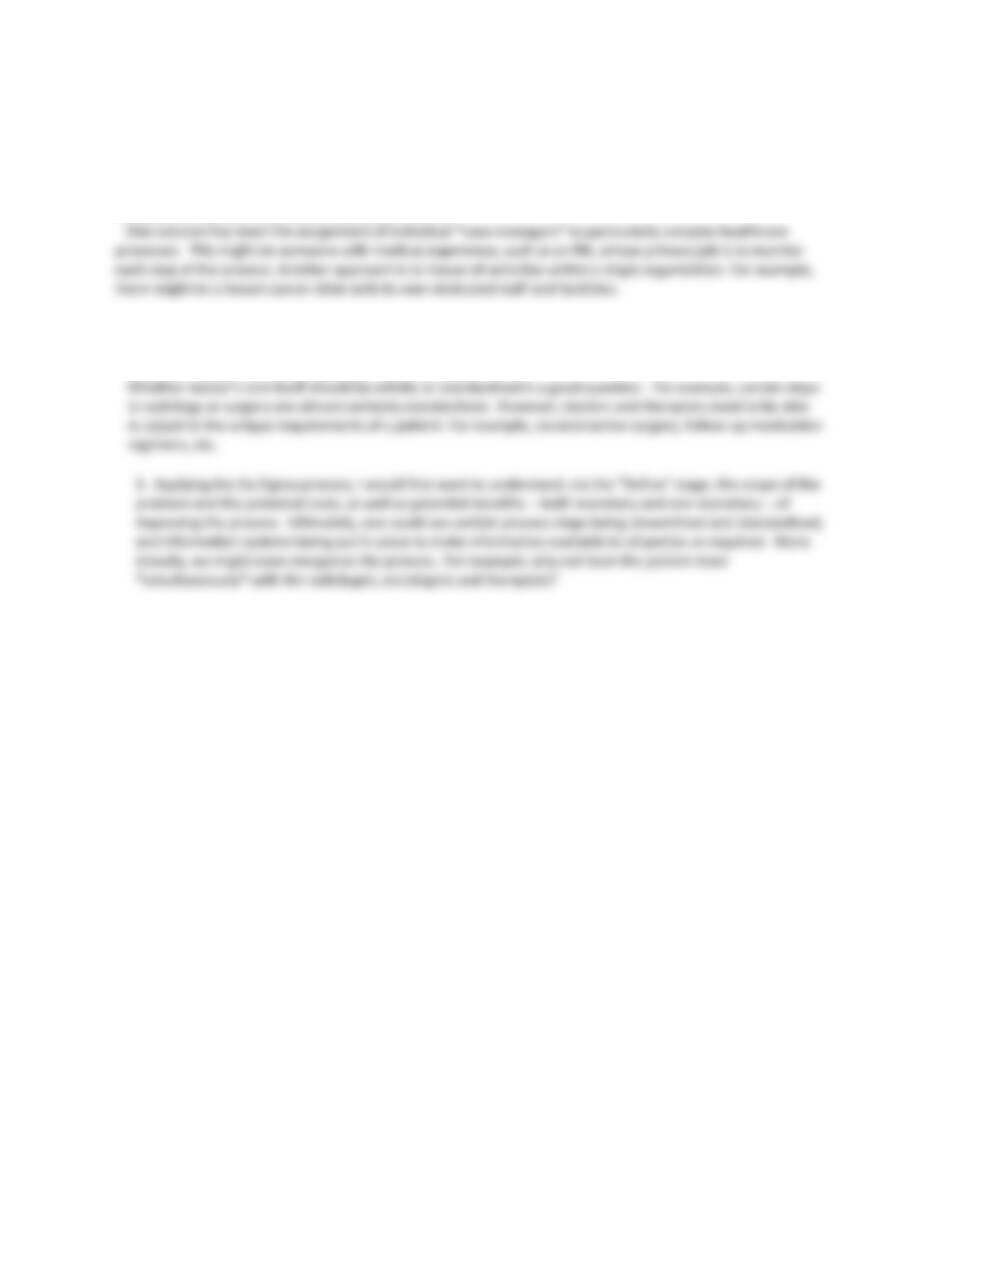
Part a
Process Step Minutes Value-Added?
Dealer Emails Order no
Paper Order Created no
Order Sits in Inbox 120 no
Internal Mail Delivers Order 60 no
Part b
Process Step Minutes Value-Added?
Dealer sends Order Electronically yes
Worker Picks Order 20 yes
Dealer sends
Order
Electronically
Worker Picks
Order
In
Stock?
Clerk notifies
dealer and
passes order on
to plant
Inspector
Checks
Order
Transport Firm
Delivers Order
Dealer
Receives
Order
YES
NO

<— NOTE: The percent value added will
1. It is not clear who or what organization is responsible for the entire process, and this is a key issue in many
healthcare settings. One might argue that it is the general practitioner, but can he or she really monitor
everything that is being done by specialists or hospital? Other s might argue that the patient is responsible, but
the patient may be in even less of a position to do so.
2. In general, routine activities, such as scheduling appointments, ordering medical equipment, and
forwarding medical records to required parties should be standardized to improve efficiency and eliminate
mistakes. Variability is *not* good in these situations.