CHAPTER 1
Introduction to Quantitative Analysis
TEACHING SUGGESTIONS
Teaching Suggestion 1.1: Importance of Qualitative Factors.
Section 1.2 gives students an overview of quantitative analysis. In this section, a number of
qualitative factors, including federal legislation and new technology, are discussed. Students can
be asked to discuss other qualitative factors that could have an impact on quantitative analysis.
Waiting lines and project planning can be used as examples.
Teaching Suggestion 1.2: Discussing Other Quantitative Analysis Problems.
Section 1.2 covers an application of the quantitative analysis approach. Students can be asked to
describe other problems or areas that could benefit from quantitative analysis.
Teaching Suggestion 1.3: Discussing Conflicting Viewpoints.
Possible problems in the QA approach are presented in this chapter. A discussion of conflicting
Teaching Suggestion 1.4: Difficulty of Getting Input Data.
A major problem in quantitative analysis is getting proper input data. Students can be asked to
Teaching Suggestion 1.5: Dealing with Resistance to Change.
Resistance to change is discussed in this chapter. Students can be asked to explain how they
SOLUTIONS TO DISCUSSION QUESTIONS AND PROBLEMS
1-1. Quantitative analysis involves the use of mathematical equations or relationships in
analyzing a particular problem. In most cases, the results of quantitative analysis will be one or
more numbers that can be used by managers and decision makers in making better decisions.
1-2. Quantitative analysis is the scientific approach to managerial decision making. This type of
analysis is a logical and rational approach to making decisions. Emotions, guesswork, and whim
1-3. Quantitative analysis is a step-by-step process that allows decision makers to investigate
problems using quantitative techniques. The steps of the quantitative analysis process include
defining the problem, developing a model, acquiring input data, developing a solution, testing
the solution, analyzing the results, and implementing the results. In every case, the analysis
begins with defining the problem. The problem could be too many stockouts, too many bad
1-4. Although the formal study of quantitative analysis and the refinement of the tools and
techniques of the scientific method have occurred only in the recent past, quantitative approaches
1-5. Model types include the scale model, physical model, and schematic model (which is a
picture or drawing of reality). In this book, mathematical models are used to describe
1-6. Input data can come from company reports and documents, interviews with employees and
other personnel, direct measurement, and sampling procedures. For many problems, a number of
1-7. Implementation is the process of taking the solution and incorporating it into the company
or organization. This is the final step in the quantitative analysis approach, and if a good job is
not done with implementation, all of the effort expended on the previous steps can be wasted.
1-8. Sensitivity analysis and postoptimality analysis allow the decision maker to determine how
the final solution to the problem will change when the input data or the model change. This type
of analysis is very important when the input data or model has not been specified properly. A
1-9. There are a large number of quantitative terms that may not be understood by managers.
1-10. Many quantitative analysts enjoy building mathematical models and solving them to find
the optimal solution to a problem. Others enjoy dealing with other technical aspects, for
example, data analysis and collection, computer programming, or computations. The
1-11. Users need not become involved in technical aspects of the QA technique, but they should
have an understanding of what the limitations of the model are, how it works (in a general
sense), the jargon involved, and the ability to question the validity and sensitivity of an answer
handed to them by an analyst.

1-12. Churchman meant that sophisticated mathematical solutions and proofs can be dangerous
1-13. The break-even point is the number of units that must be sold to make zero profits. To
compute this, we must know the selling price, the fixed cost, and the variable cost per unit.
1-14. f = 350 s = 15 v = 8
a) Total revenue = 20(15) = $300
1-15. f = 150 s = 50 v = 20
BEP = f/(s − v) = 150/(50 − 20) = 5 units
1-16. f = 150 s = 50 v = 15
1-18. BEP = f/(s − v)
500 = 1400/(s − 3)
1-19. f = 2400 s = 40 v = 25
1-20. f = 2400 s = 50 v = 25
1-21. f = 2400 s = ? v = 25

s = 45
1-22. f = 11000 s = 250 v = 60
BEP = f/(s – v) = 11000/(250 – 60) = 57.9
SOLUTION TO FOOD AND BEVERAGES AT SOUTHWESTERN
UNIVERSITY FOOTBALL GAMES
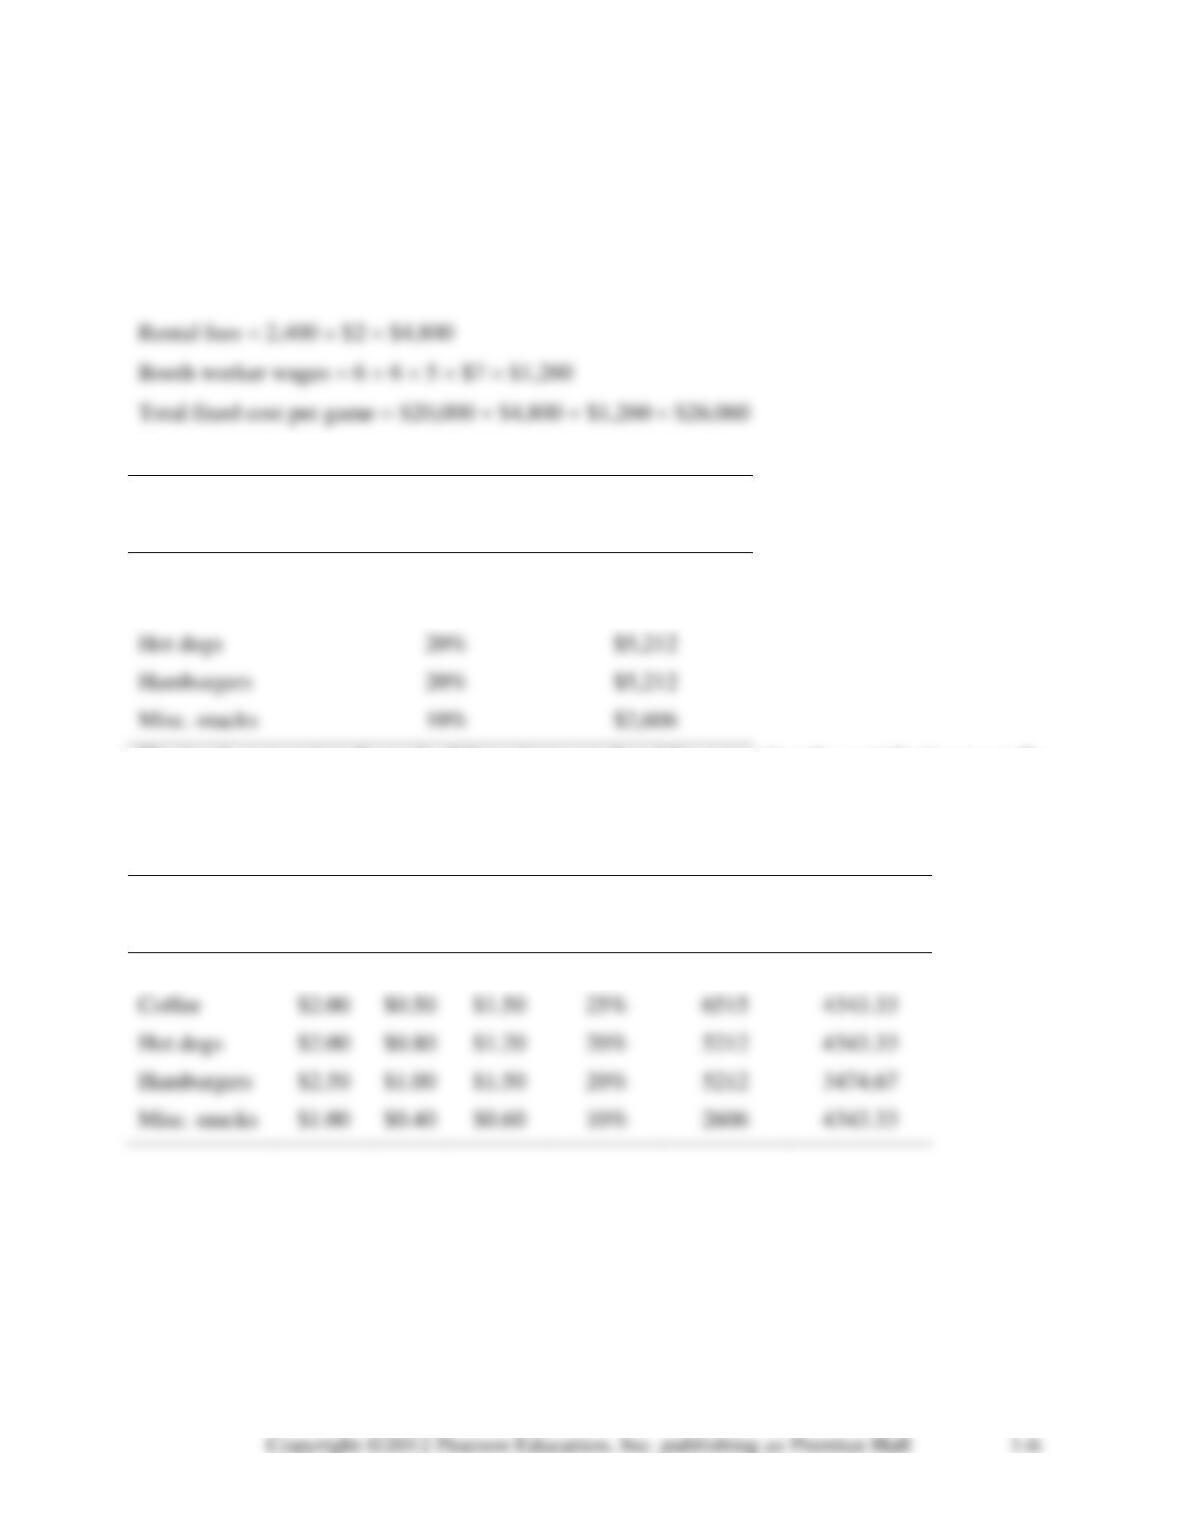
The total fixed cost per game includes salaries, rental fees, and cost of the workers in the six
booths. These are:
Salaries = $20,000
The cost of this allocated to each food item is shown in the table:
Percent
Allocated fixed
Item
revenue
cost
Soft drink
25%
$6,515
Coffee
25%
$6,515
Hot dogs
20%
$5,212
Hamburgers
20%
$5,212
Misc. snacks
10%
$2,606
The break-even points for each of these items are found by computing the contribution to profit
(profit margin) for each item and dividing this into the allocated fixed cost. These are shown in
the next table:
Selling
Var.
Profit
Percent
Allocated
Break even
Item
price
cost
margin
revenue
fixed cost
volume
Soft drink
$1.50
$0.75
$0.75
25%
6515
8686.67
Coffee
$2.00
$0.50
$1.50
25%
6515
4343.33
Hot dogs
$2.00
$0.80
$1.20
20%
5212
4343.33
Hamburgers
$2.50
$1.00
$1.50
20%
5212
3474.67
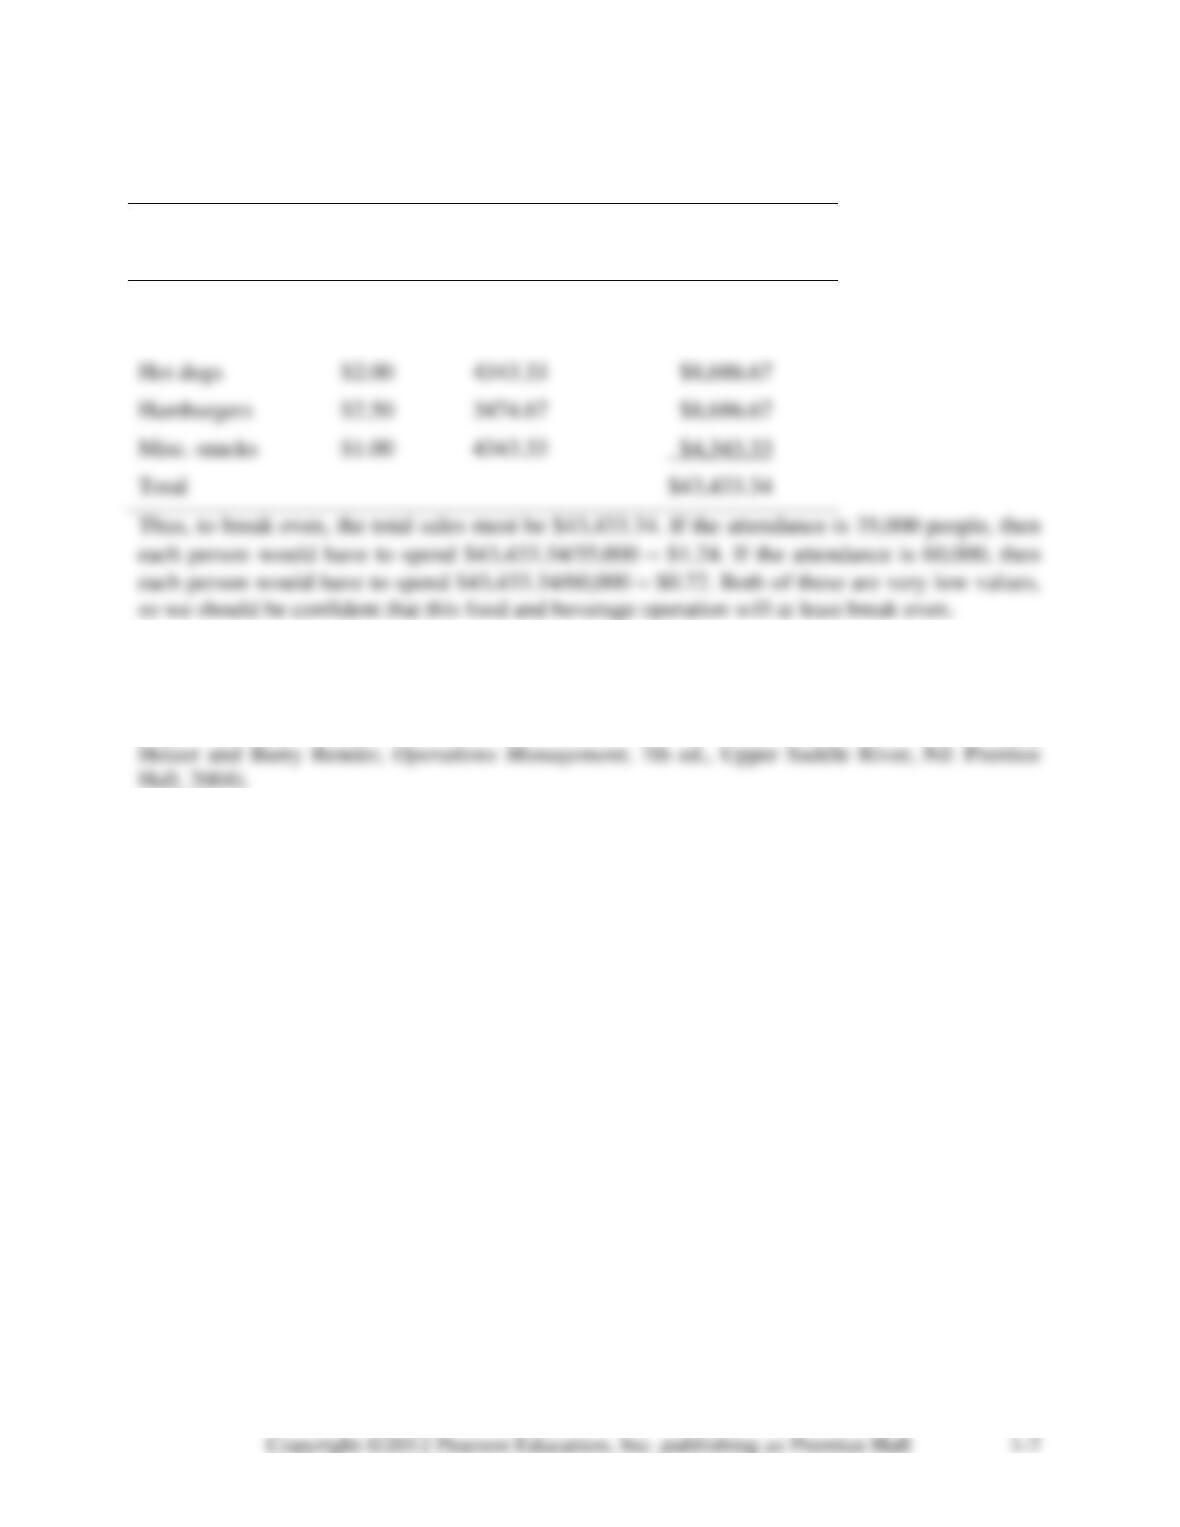
To determine the total sales for each item that is required to break even, multiply the selling price
by the break even volume. The results are shown:
Selling
Break even
Dollar volume
Item
price
volume
of sales
Soft drink
$1.50
8686.67
$13,030.00
Coffee
$2.00
4343.33
$8,686.67
Hot dogs
$2.00
4343.33
$8,686.67
Hamburgers
$2.50
3474.67
$8,686.67
$1.00
4343.33
$4,343.33
Total
$43,433.34
Note: While this process provides information about break-even points based on the current
percent revenues for each product, there is one difficulty. The total revenue using the break-even
points will not result in the same percentages (dollar volume of product/total revenue) as
originally stated in the problem. A more complex model is available to do this (see p. 284 Jay