1-12 CHAPTER 1: LINEAR EQUATIONS AND GRAPHS
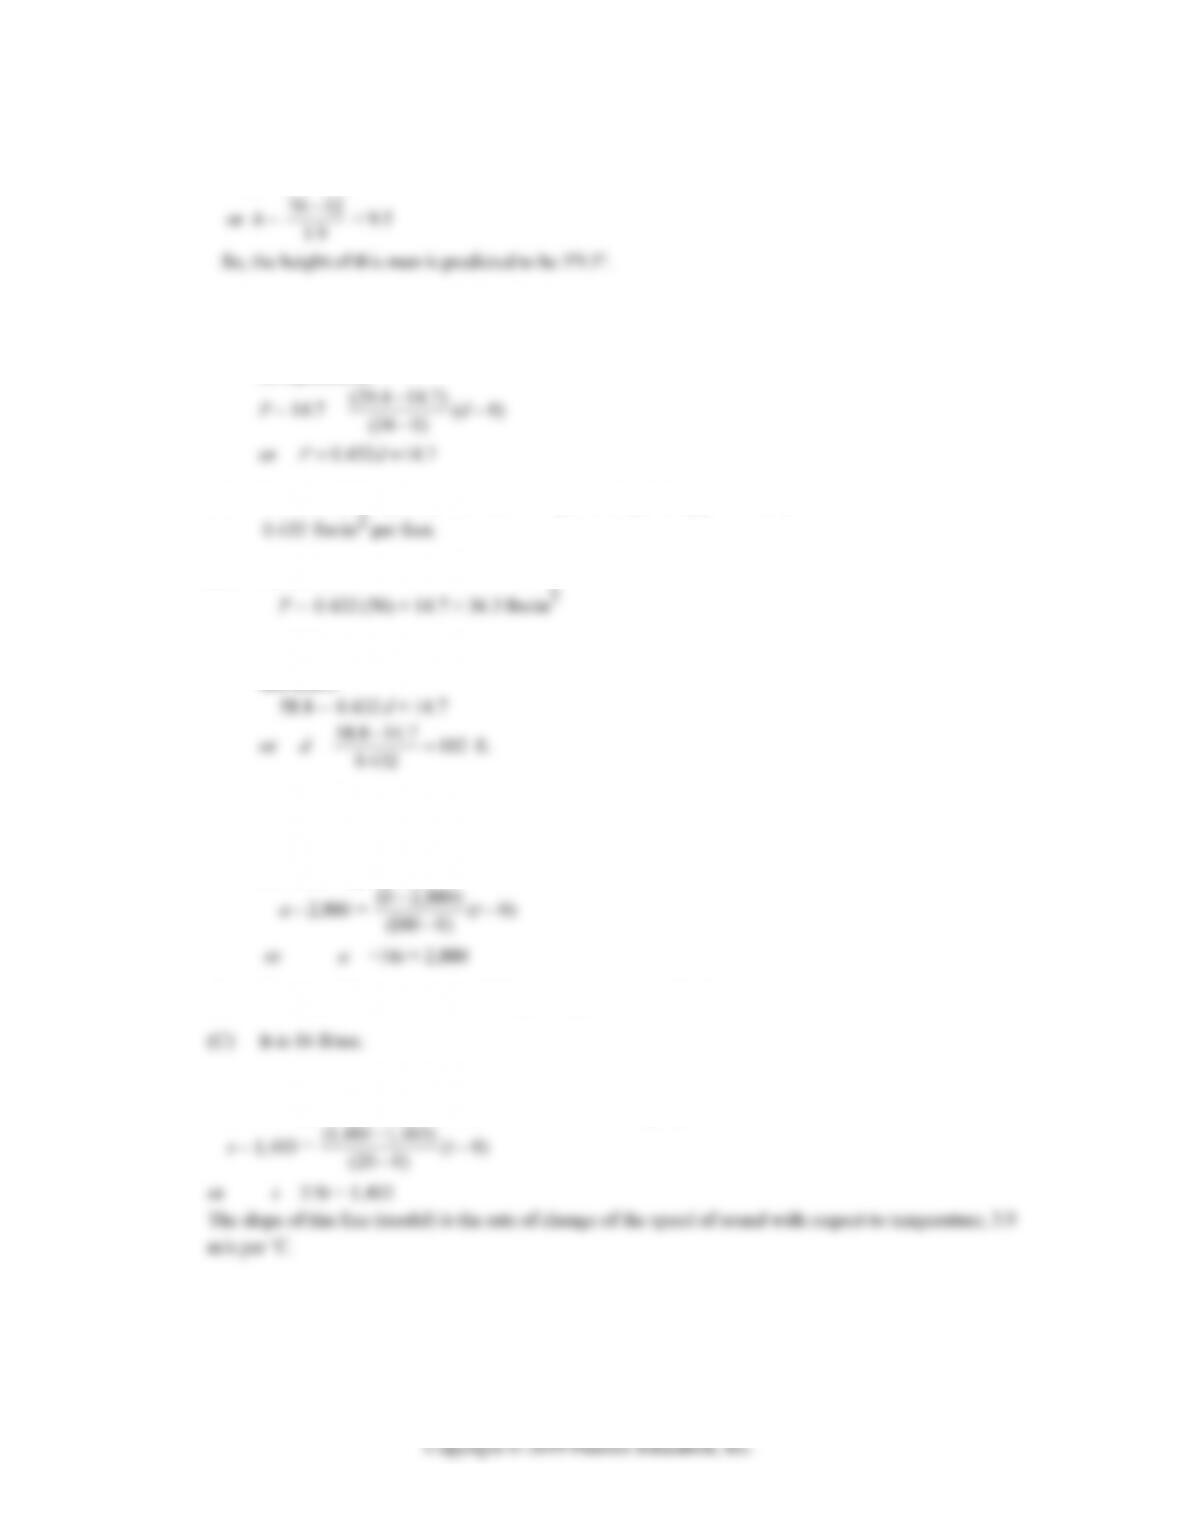
(D) For w = 70, we have
70 = 52 + 1.9h
≈ 9.5
4. We have two representations of (d, P): (0, 14.7) and (34, 29.4).
(A) A line relating P to d passes through the above two points.
Its equation is:
(B) The rate of change of pressure with respect to depth is approximately
(C) For d = 50,
(D) For P = 4 atmospheres, we have P = 4(14.7) = 58.8 lbs/in2
and hence
or d = 58.8 14.7
0.432 102
6. We have two representations of (t, a): (0, 2,880) and (180, 0).
(A) The linear model relating altitude a to the time in air t has
the following equation:
(B) The rate of descent for an ATPS system parachute is 16 ft/sec.
8. We have two representations of (t, s): (0, 1,403) and (20, 1,481).
So, the line passing through these points has the following equation:
EXERCISE 1-3 1-13
10. (A)
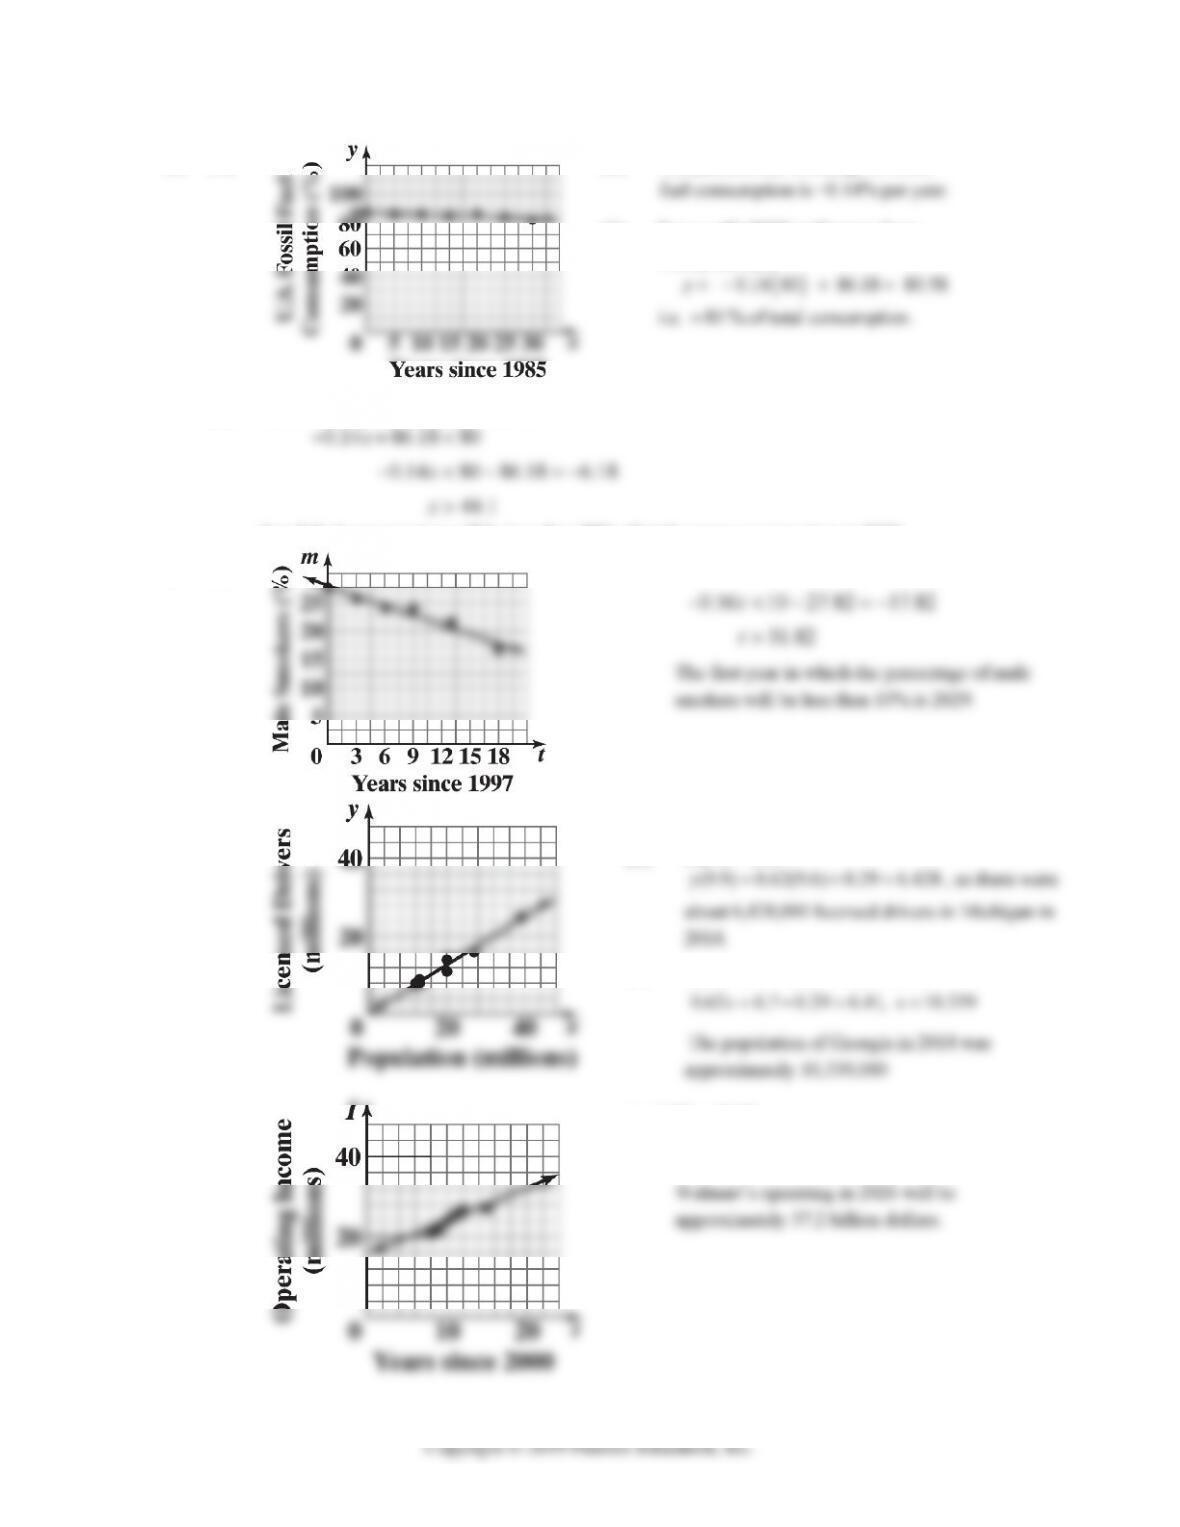
(B) The percent rate of change of fossil
(C) For x = 40 (2025 is 40 years from
1985), we have
(D) Solve 0.14 86.18 80x for x:
0.14 86.18 80
44.1
x
x
Fossil fuel consumption will be less than 80% of total energy consumption in 2030.
12. (A)
(B) Solve 0.56 27.82 10t for t:
t
14. (A)
0.62 0.29yx
(B) For x = 9.9,
(C) Solve 6.7 = 0.62x +0.29 for x:
16. (A)
0.82 15.84It
(B) At t = 26, I = 0.82(26) + 15.84 = 37.16.
CHAPTER 1 REVIEW 1-15
28. Supply: y = 1.53x + 2.85;
CHAPTER 1 REVIEW
1. 2x + 3 = 7x – 11
–5x = –14
2. 31
12 3 2
xx
3. 2x + 5y = 9
4. 3x – 4y = 7
(1-1)
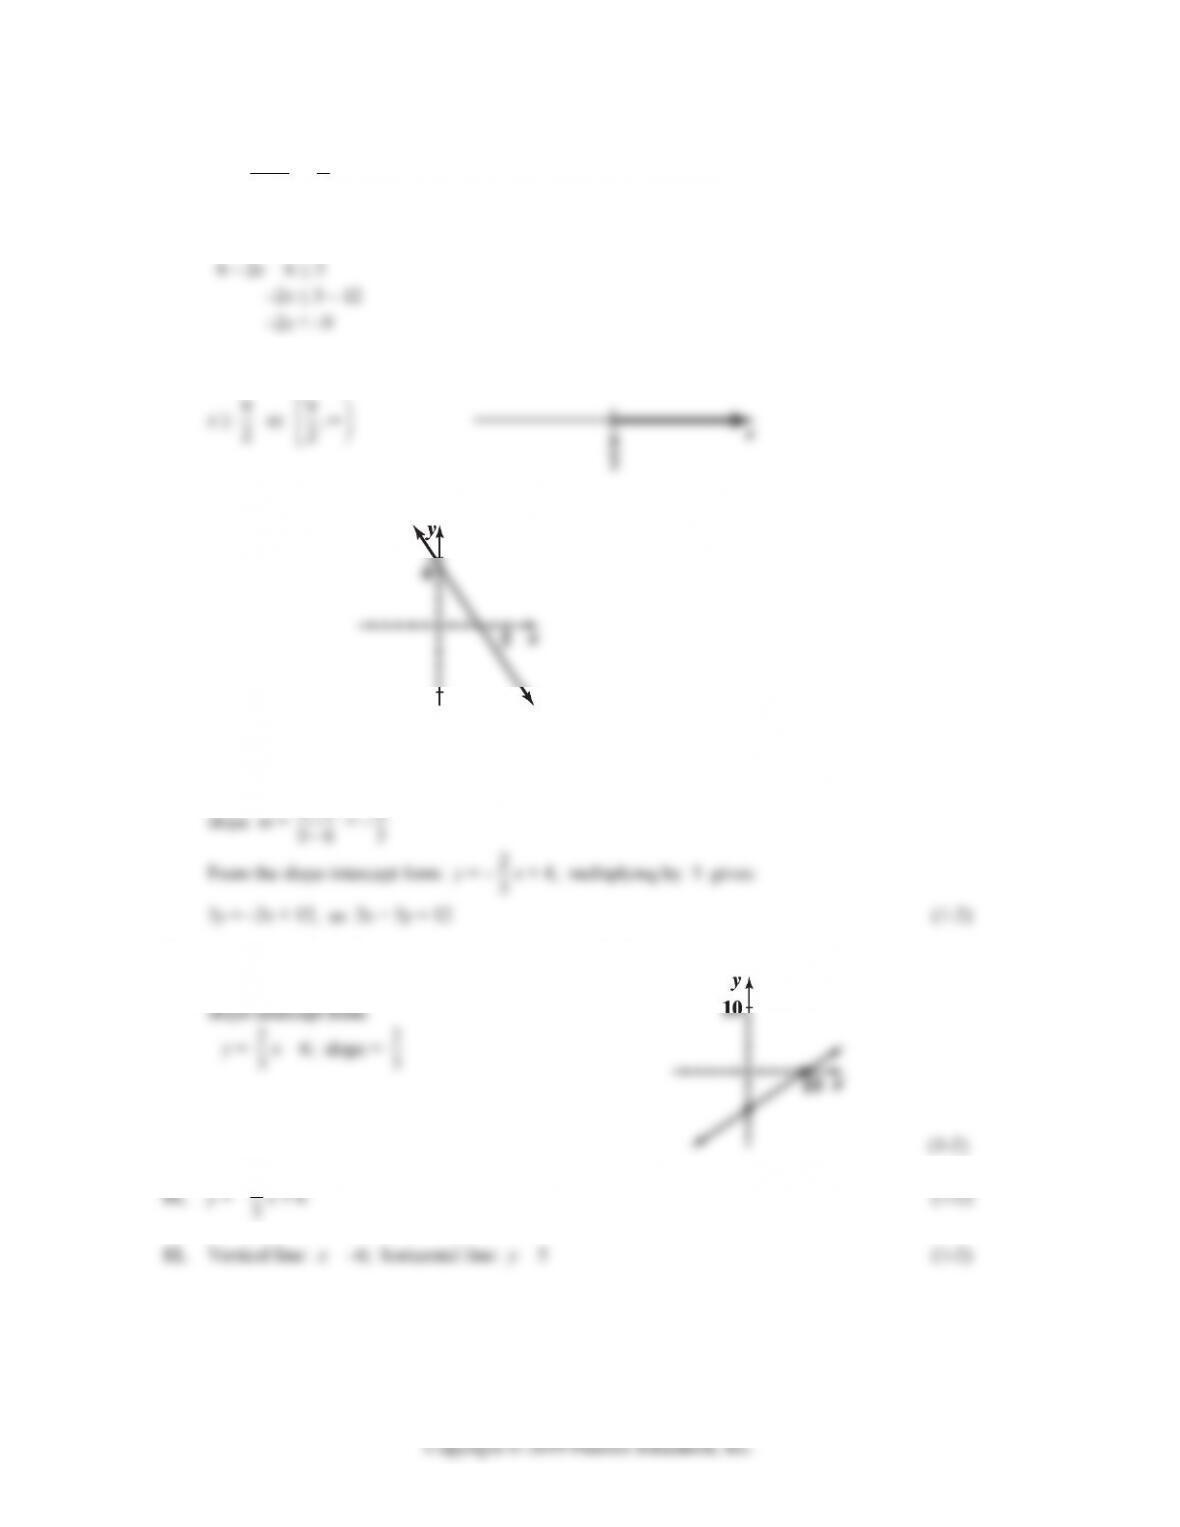
5. 4y – 3 < 10
4 or 13
6. –1 < –2x + 5 ≤ 3
(1-1)
1-16 CHAPTER 1: LINEAR EQUATIONS AND GRAPHS
7. 1 – 3
3
x ≤ 1
2
Multiply both sides of the inequality by 6. We do not reverse the direction of the inequality, since 6 > 0.
6 – 2(x – 3) ≤ 3
Divide both sides by –2 and reverse the direction of the inequality, since –2 < 0.
(1-1)
8. 3x + 2y = 9
(1-2)
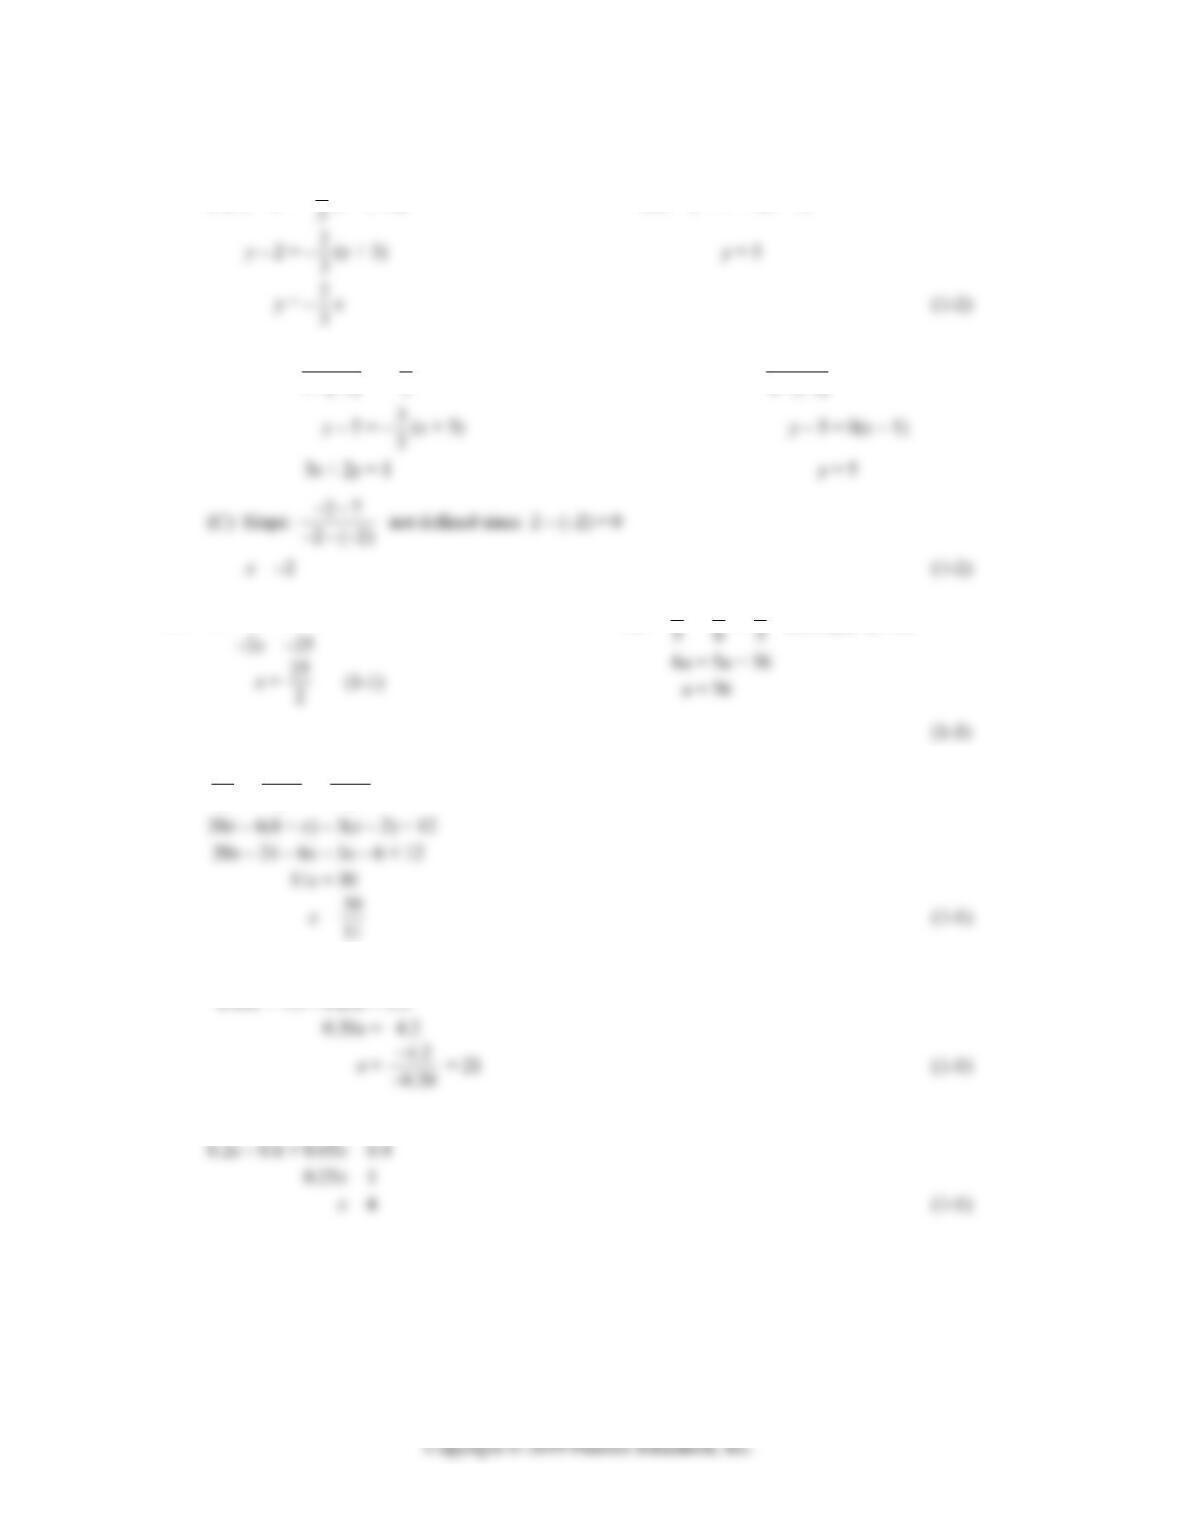
9. The line passes through (6, 0) and (0, 4)
10. x-intercept: 2x = 18, x = 9;
y-intercept: –3y = 18, x = –6;
Graph:
CHAPTER 1 REVIEW 1-17
13. Use the point-slope form:
(A) y – 2 = – 2
14. (A) Slope: 15
1(3)
= – 3
2 (B) Slope: 55
4(1)
= 0
15. 3x + 25 = 5x
16.
u = 6
u + 6
17. 5
3
x
– 4
2
x
= 2
4
x + 1 (multiply by 12)
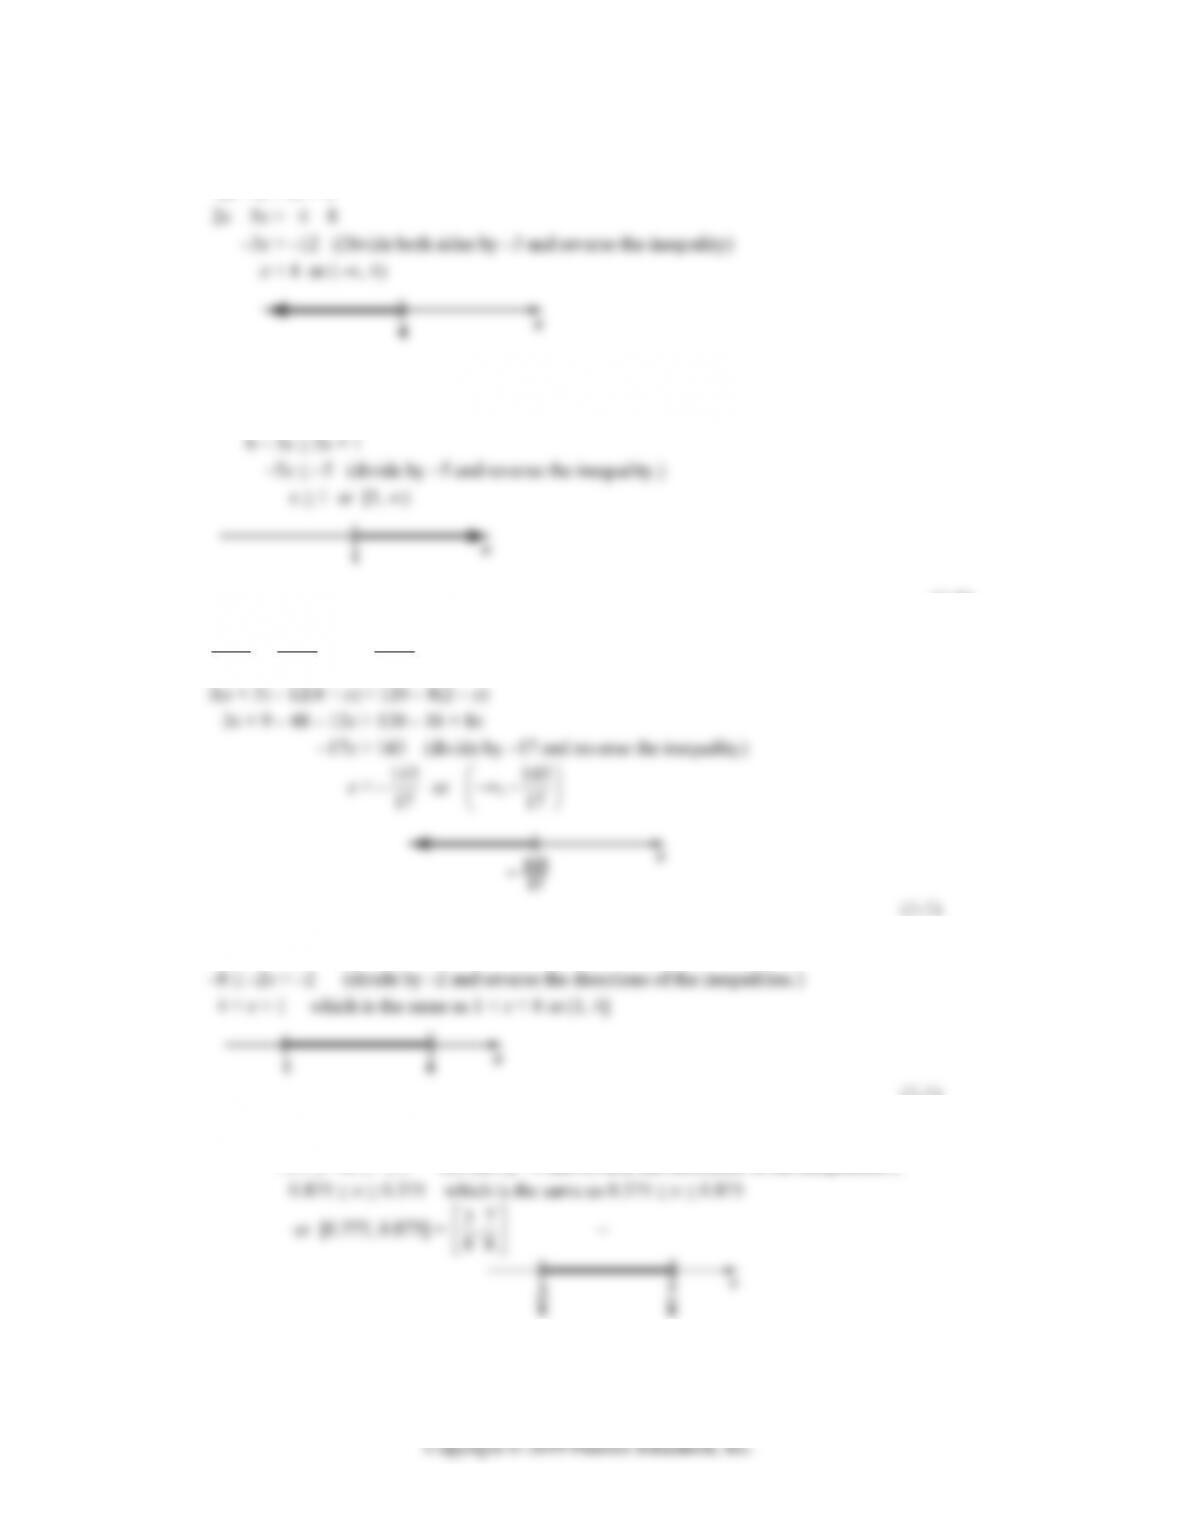
18. 0.05x + 0.25(30 – x) = 3.3
0.05x + 7.5 – 0.25x = 3.3
19. 0.2(x – 3) + 0.05x = 0.4
1-18 CHAPTER 1: LINEAR EQUATIONS AND GRAPHS
20. 2(x + 4) > 5x – 4
2x + 8 > 5x – 4
(1-1)
21. 3(2 – x) – 2 ≤ 2x – 1
(1-1)
22. 3
8
x – 4
2
x
> 5 – 2
3
x
(multiply by 24)
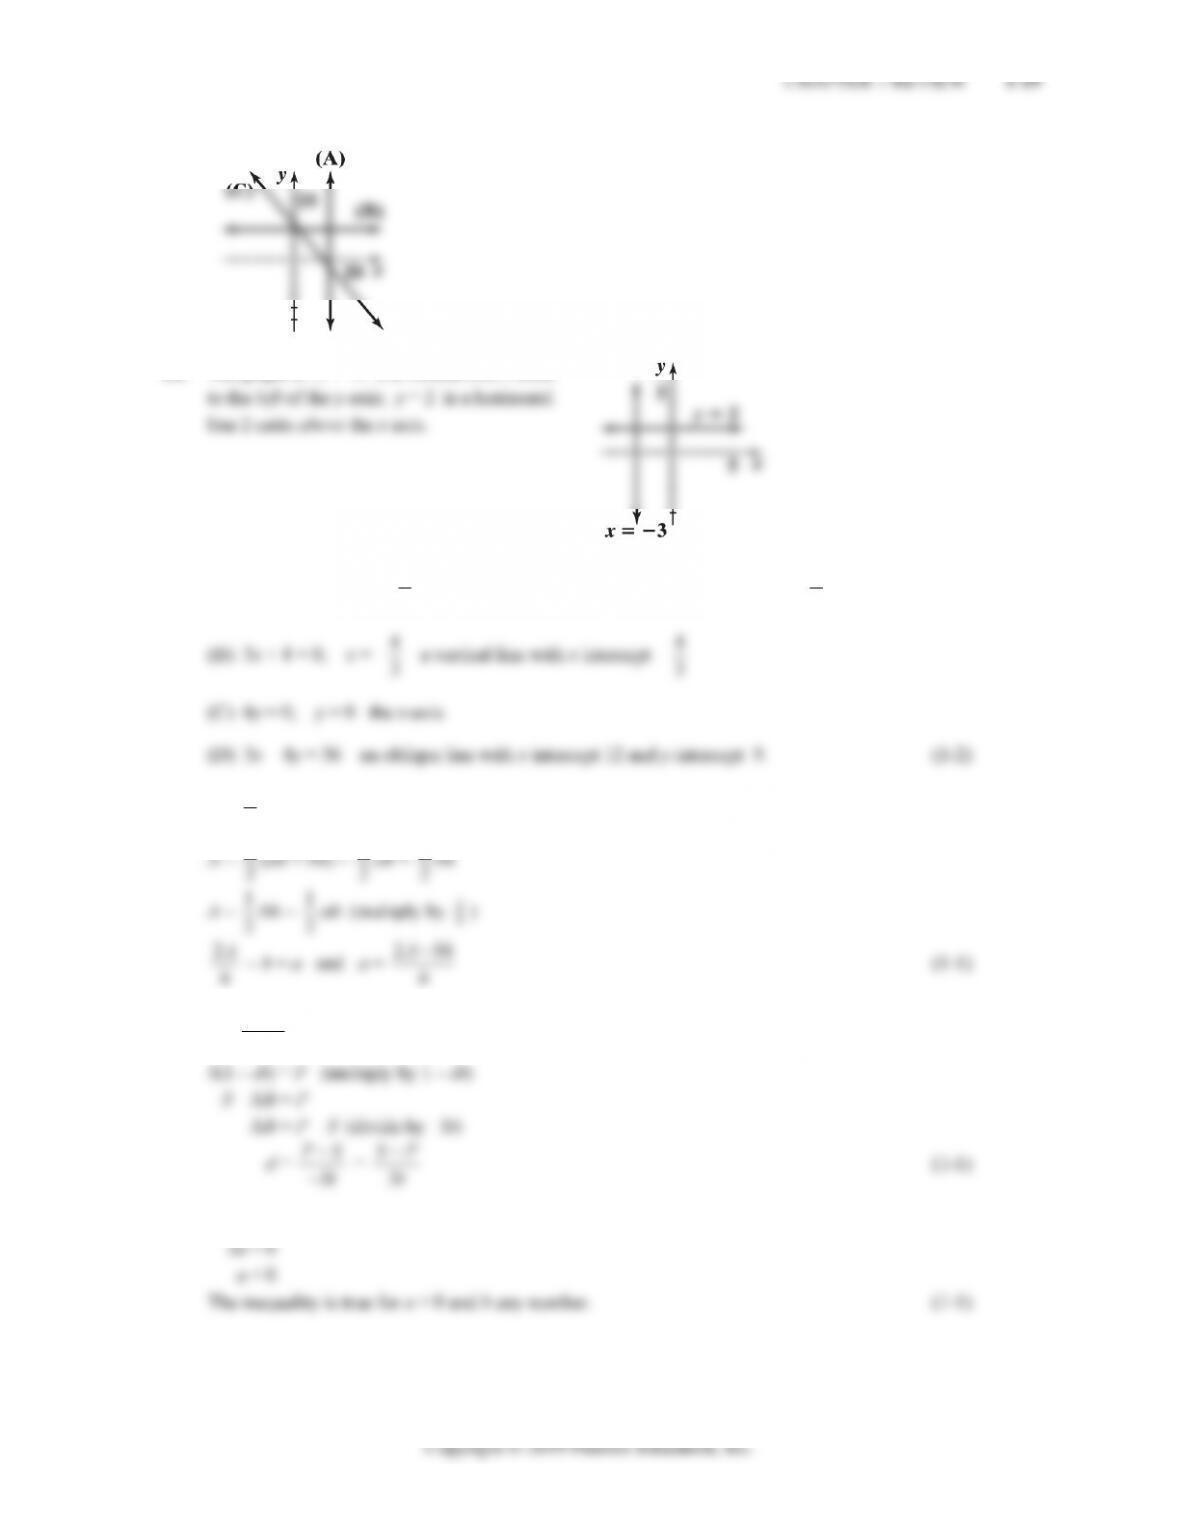
23. –5 ≤ 3 – 2x < 1
(1–1)
24. 1.5 2 4 0.5x
–3.5 ≤ –4x ≤ –1.5 (divide by –4 and reverse the directions of the inequalities.)
(1-1)
1-20 CHAPTER 1: LINEAR EQUATIONS AND GRAPHS
31. b < a < 0 (divide by b; reverse the direction of the inequalities since b < 0).
1 > a
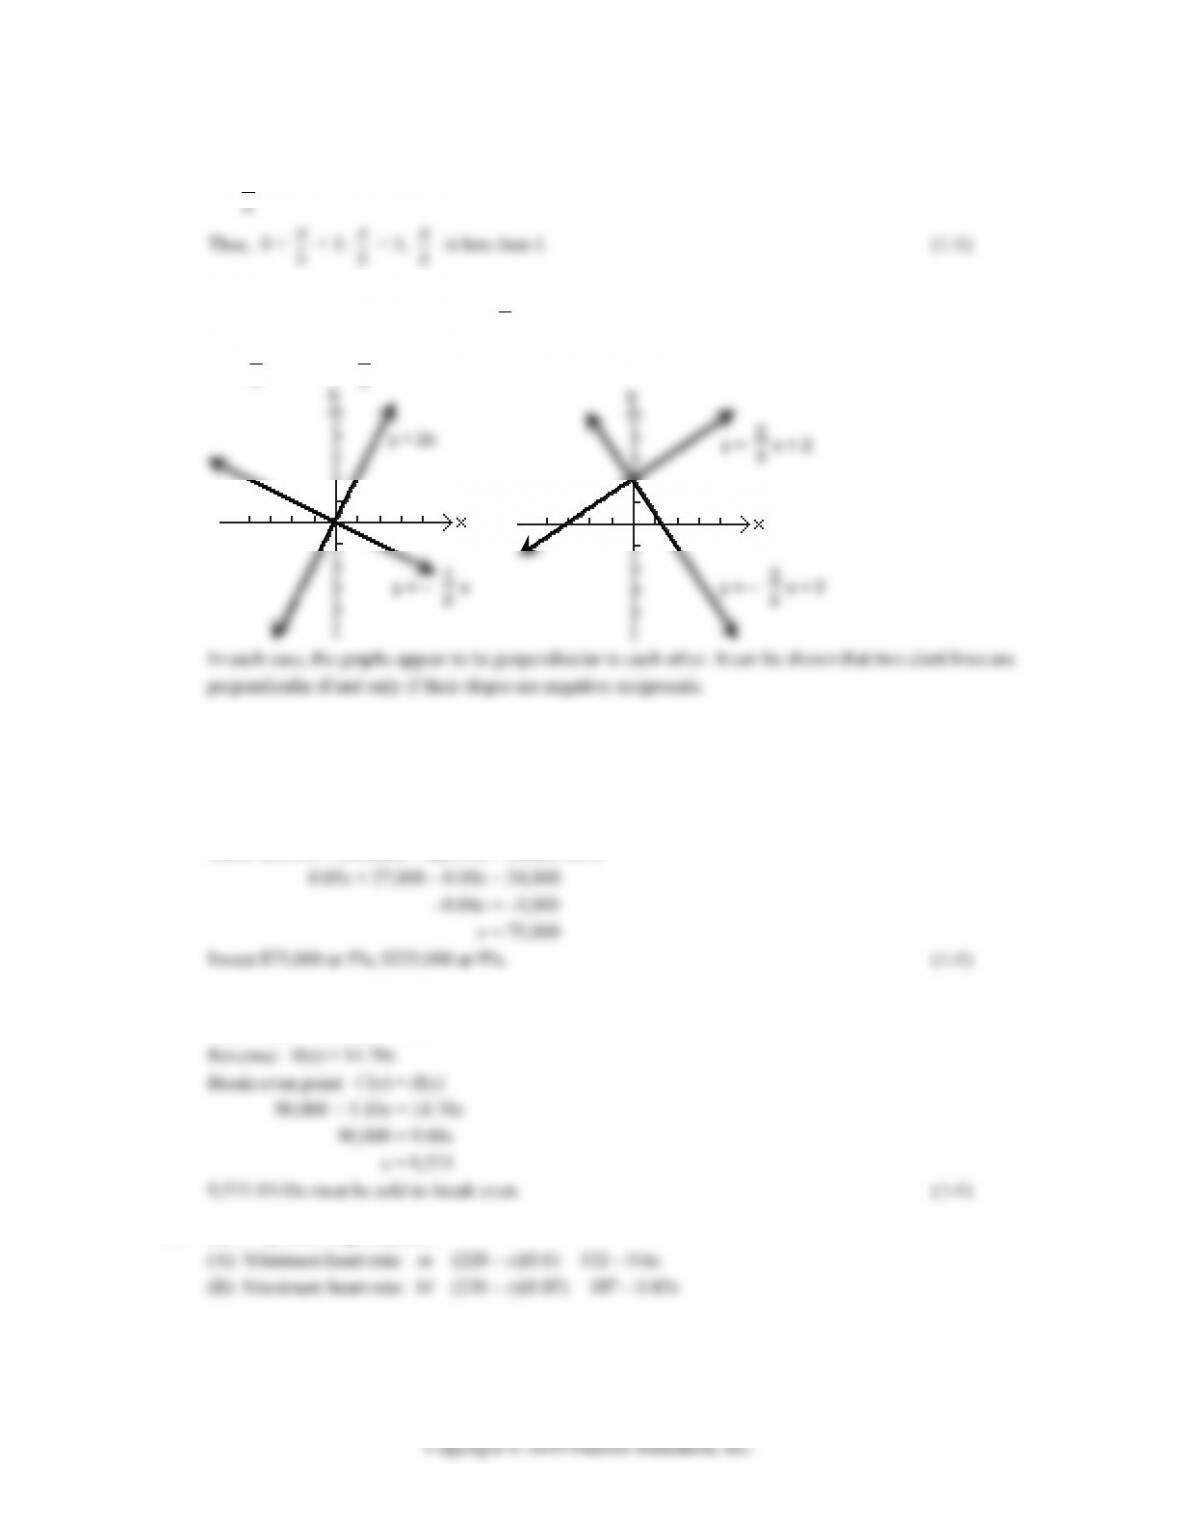
32. The graphs of the pairs {y = 2x, y = – 1
2x} and
{y = 2
3x + 2, y = – 3
2x + 2} are shown below:
(1-2)
33. Let x = amount invested at 5%.
Then 300,000 – x = amount invested at 9%.
Yield = 300,000(0.08) = 24,000
Solve x(0.05) + (300,000 – x)(0.09) = 24,000 for x:
34. Let x = the number of DVD’s.
Cost: C(x) = 90,000 + 5.10x
35. Let x = person’s age in years.
CHAPTER 1 REVIEW 1-21
(C) At x = 20, m = 132 – 0.6(20) = 120
(D) At x = 50, m = 132 – 0.6(50) = 102
36. V = mt + b
(A) At t = 0, V = 224,000; at t = 8, V = 100,000
37. R = mC + b
(A) From the given information, the points (50, 80) and (130, 208) satisfy this equation. Therefore:
slope m = 208 80
38. Let x = weekly sales
39. p = mx + b
From the given information, the points (1,160, 3.79) and
(1,320, 3.59) satisfy this equation. Therefore,
Using the point-slope form with (x1, p1) = (1,160, 3.79)
1-22 CHAPTER 1: LINEAR EQUATIONS AND GRAPHS
Copyright © 2019 Pearson Education, Inc.
If p = 3.29, solve 3.29 = –0.00125x + 5.24 for x:
–0.00125x = 3.29 – 5.24 = –1.95
x = 1,560
The stores would sell 1,560 bottles. (1-2)
40. T = 40 – 2M
(C) At T = –50,
41. (A) The dropout rate is decreasing at a rate of 0.308 percentage point per year.
(B)
(C) Solve –0.308t + 13.9 < 3 for t:
42. (A) The CPI is increasing at a rate of 4.295 units per year.
43. y = 0.74x + 2.83
(A) The rate of change of tree height with respect to Dbh is 0.74.
(B) Tree height increases by 0.74 foot.