SUMMARY OUTPUT
Regression Statistics
Multiple R 0.654225816
R Square 0.428011418
Adjusted R Square
0.380345703
Standard Error 95.1993558
Observations 14
ANOVA
df SS MS F Significance F
Regression 1 81379.92044 81379.92044 8.979439772 0.011137435
Residual 12 108755.0081 9062.917344
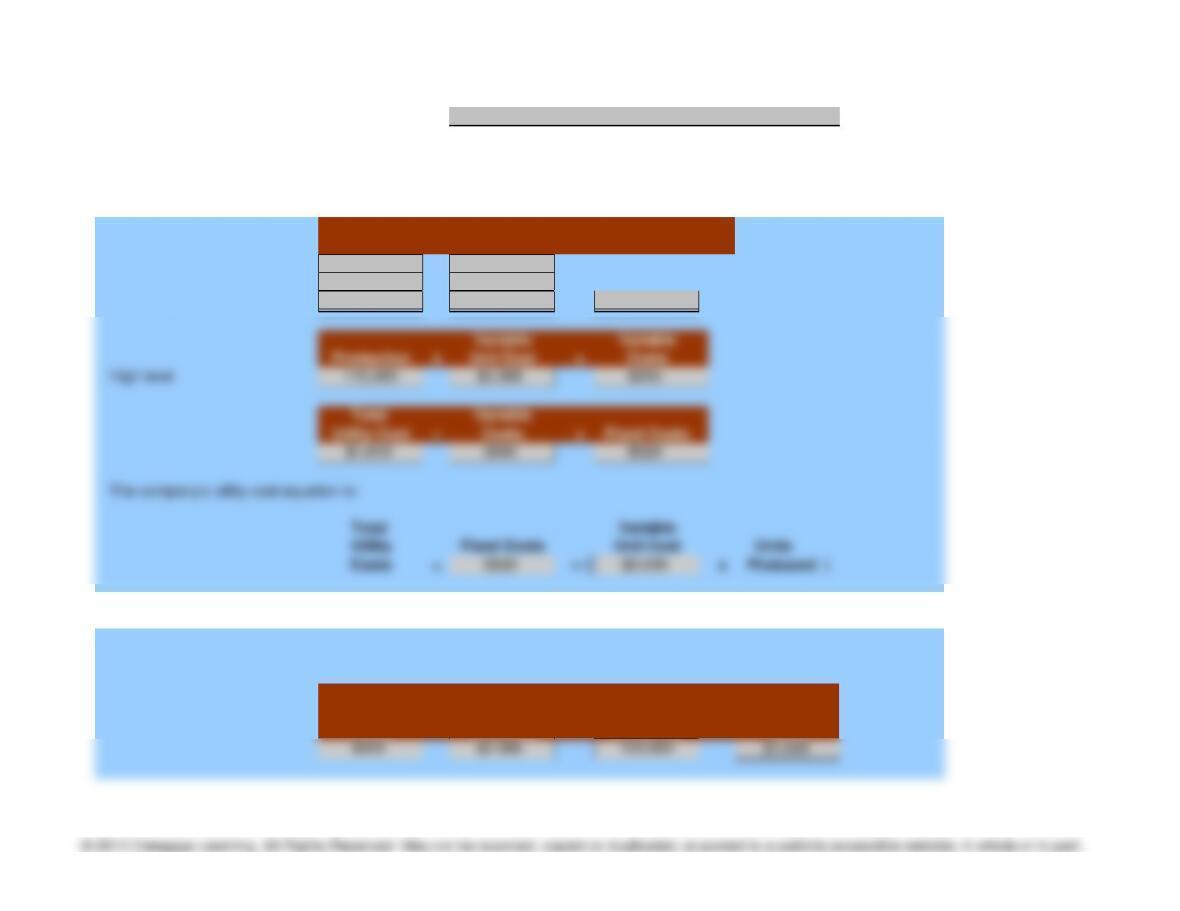
Problem 5-33 Name:
Enter the appropriate amounts/formulas in the shaded (gray) cells, or select from the drop-down list.
An asterisk (*) will appear in the column to the right of an incorrect answer.
A.
Variable
Utility Cost Production Unit Cost
High level of activity 1,619$ 115,000
Low level of activity 1,469 90,000
Difference 150$ 25,000 $0.006
B.
The expected cost of producing 120,000 units would be:
Total
Fixed Variable Units Utility
Costs Unit Cost Produced Costs
+ (
x
Instructor
) =
Production x Unit Cost = Costs
Total Variable
Utility Cost –Costs = Fixed Costs
The company‘s utility cost equation is:
C.
NOTE: You must have the Data Analysis pack – an add-on for Excel – installed in order for the statistical
analysis to function.
The Data Analysis pack is a powerful set of tools used to figure out the variance, correlation and covariance of data.
Although the Data Analysis pack is a standard feature that comes with Excel, it may not already be loaded into Excel.
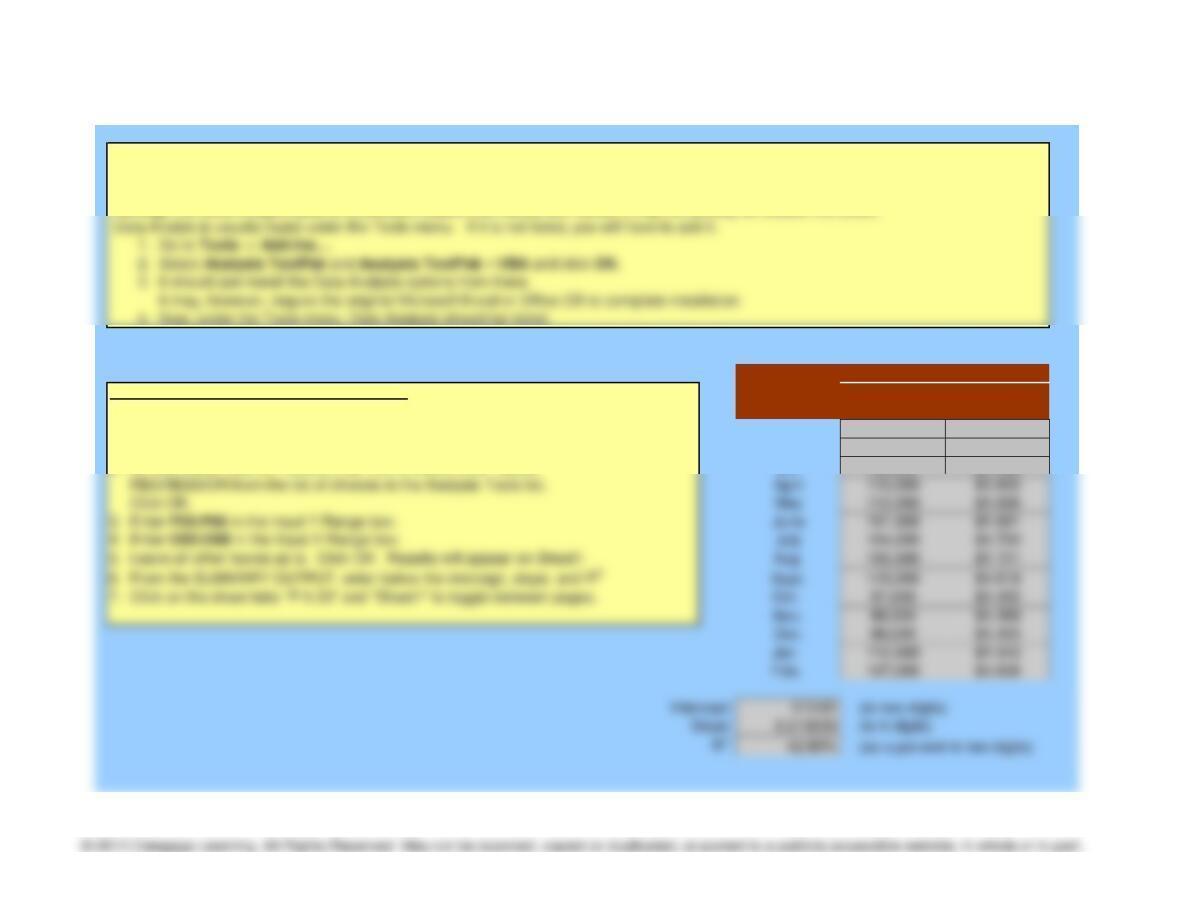
Instructions for Part C – 14 Months of Data Utility
1. Enter the number of production units and the utility cost for each month Month Production Cost
as they appear in the text in the gray cells at the right. A red asterisk Jan. 113,000 $1,712
will appear next to a row if both numbers are not correct. Feb. 114,000 $1,716
2. On the menu, click on TOOLS, then DATA ANALYSIS. Select Mar. 90,000 $1,469
REGRESSION from the list of choices in the Analysis Tools list. April 110,000 $1,600
Click OK. May 112,000 $1,698
7. Click on the sheet tabs “P 5-33” and “Sheet1” to toggle between pages. Oct. 97,000 $1,452
14 Months of Data
Using regression analysis, the cost formula would be:
Total
Intercept + ( Slope x Units ) = Utility Costs