
Solutions for Appendix A: CFA Questions and Problems
20 0
n 0.8
110 85
−
==
−
For every option sold we should purchase 0.8 shares of stock. If we sell 100 calls we should buy 80 shares of stock.
Sell 100 calls at 17.50 1,750
Buy 80 shares at 100 8, 000
Net cash flow 6, 250
=
=−
=−
C. If the current call price is $14, it is underpriced. Therefore, we should buy the call and sell the underlying
stock. The hedge ratio is
20 0
n 0.8
110 85
−
==
−
For every option purchased we should sell 0.8 shares of stock. If we buy 100 calls we should sell 80 shares of stock.
Buy 100 calls at 14 1, 400
=−
Level III
7. The company can enter into a swap to pay a fixed rate of 6.5 percent and receive a floating rate. The first
floating payment will be at 5 percent.
Interest payment on the floating rate note = $50,000,000(0.05 + 0.0125) (90/360) = $781,250

Solutions for Appendix A: CFA Questions and Problems
– 200 –
Chapter 15
Level III
1. The relatively constant elements in the asset allocation process are the prediction procedure, the investor’s
risk tolerance function, and the optimizer. Most of the investor’s expertise goes into formulating these stable
2. A. U.S. equities, and ex-U.S. equities represent respectively 30%/60% = 0.5 and 30%/60% = 0.5 of
global equities. Therefore, for global equities,
(0.5 8%) (0.5 10%) 9%
(0.5 14%) (0.5 10%) 12%
A
B
= + =
= + =
Global equities’ short-term expected return at 12 percent is above the long-term expectation of 9 percent because
U.S. equities are expected in the short-term to outperform their long-term expected return.
B. The results in Part A suggest three actions:
► In absolute terms, the global equities short-term expected return is 300 basis points above its expected long–
term value of 9 percent; in relative terms, that is equivalent to a 12%/9% − 1.0 = 33% higher expected return. For
global fixed income, the absolute and relative expected return differences are 125 basis points and 22 percent,
respectively. Because global equities appear more undervalued than global bonds, increase the weight on global
equities from 60 percent and decrease the weight on global fixed income from 40 percent.

Solutions for Appendix A: CFA Questions and Problems
points in the short term.
► Within the new global fixed-income allocation, overweight U.S. bonds and underweight ex-U.S. bonds,
reflecting their short-term expected performance.
3. The portfolio managed by Galicia is experiencing style drift. The threefold increase in the weighting of
growth stocks suggests that Galicia has decided to shift to more of a market orientation, although some or all of the
4. A. The principal benefit of all stocks being categorized as either growth or value (MSCI approach) is
that it is collectively exhaustive. That said, many stocks are “border” stocks (i.e., have characteristics that place
them near the value/growth border) that don’t really exhibit significant value or growth characteristics but are
categorized in one of these styles anyway. The Dow Jones method’s neutral/core category eliminates this problem,
Chapter 16
Level III
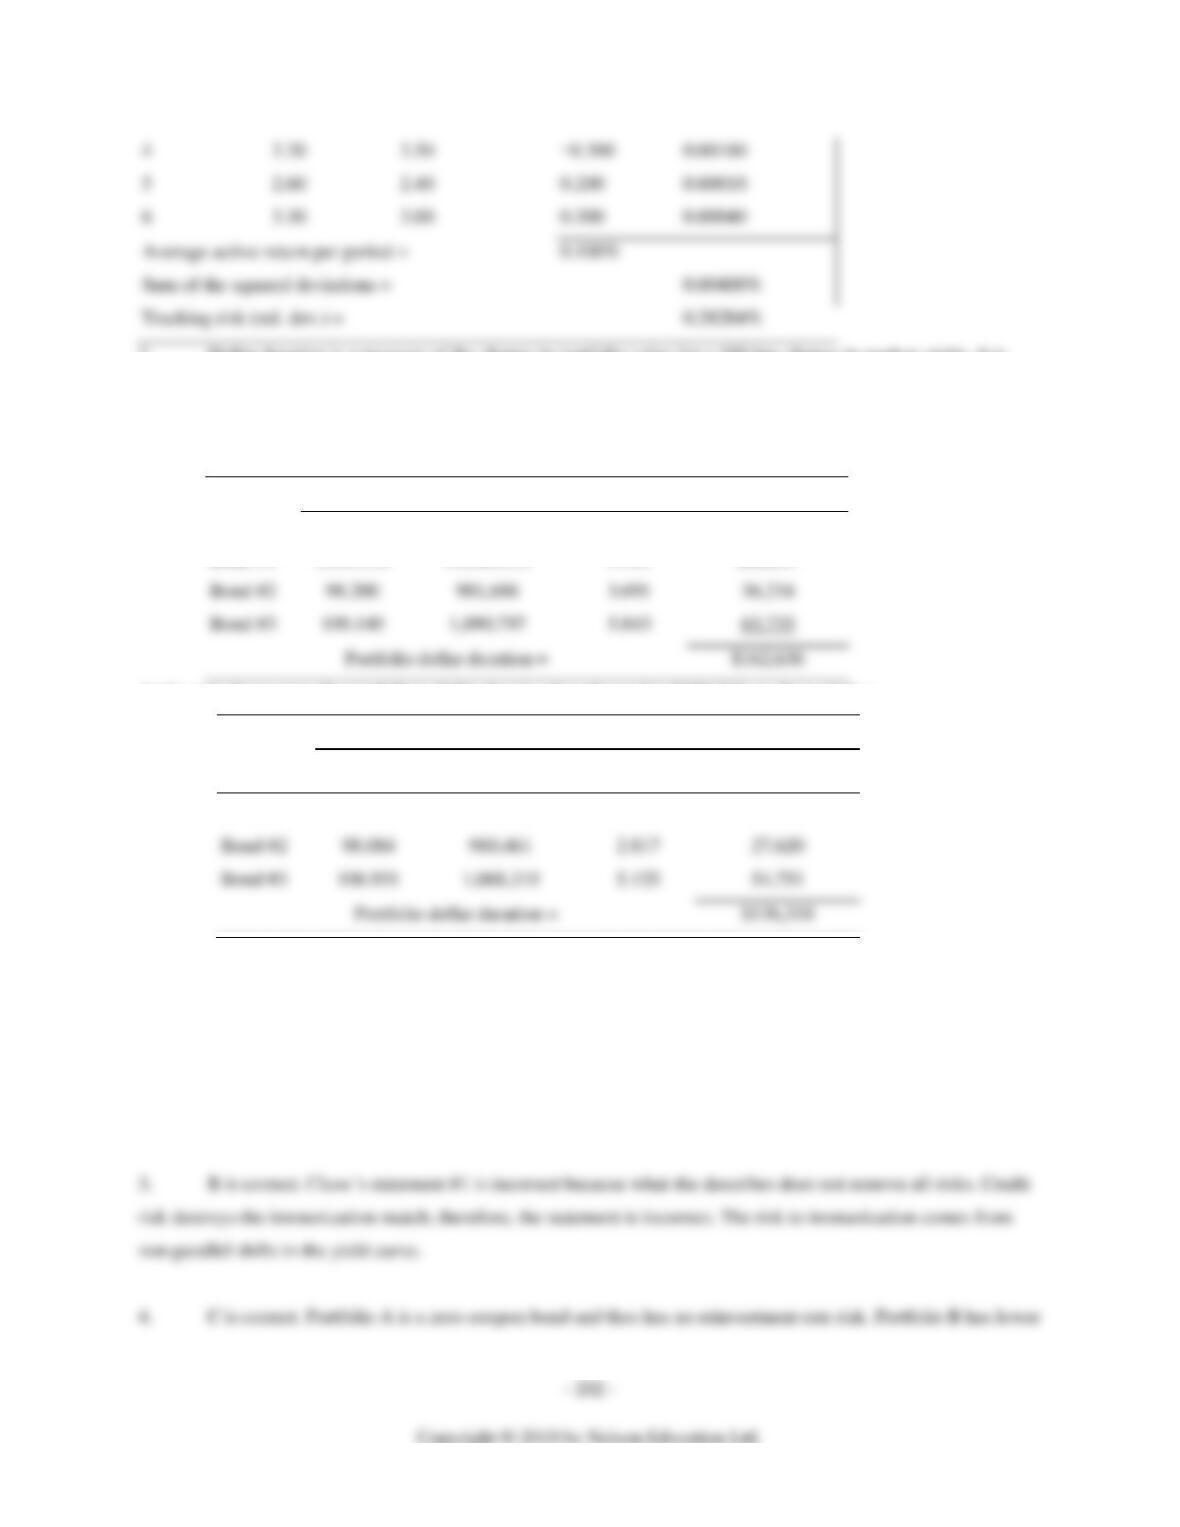
1. The tracking risk is the standard deviation of the active returns. For the data shown in the problem, the
tracking risk is 28.284 bps, as shown below:
Period
Portfolio
Return
Benchmark
Return
Active
Return
(AR – Avg. AR)2
1
14.10%
13.70%
0.400%
0.00090%
Solutions for Appendix A: CFA Questions and Problems
6
3.30
3.00
0.300
0.00040
Average active return per period =
Sum of the squared deviations =
2. Dollar duration is a measure of the change in portfolio value for a 100 bps change in market yields. It is
defined as Dollar duration = Duration × Dollar value × 0.01
A. A portfolio’s dollar duration is the sum of the dollar durations of the component securities. The dollar
duration of this portfolio at the beginning of the period is $162,636, which is calculated as
initial Values
Security
Price
Market Value
Duration
Dollar Duration
Bond #1
$106.110
$1,060,531
5.909
$62,667
Bond #3
5.843
At the end of one year, the portfolio’s dollar duration has changed to $136,318, as shown below.
After 1 Year
Security
Price
Market Value
Duration
Dollar Duration
Bond #1
$104.240
$1,042,043
5.177
$53,947
Bond #2
980,461
2.817
Bond #3
5.125
B. The rebalancing ratio is a ratio of the original dollar duration to the new dollar duration:
Rebalancing ratio = $162,636/$136,318 = 1.193
C. The portfolio requires each position to be increased by 19.3 percent. The cash required for this rebalancing
is calculated as:
Cash required 0.193 ($1,042, 043 980, 461 1,068,319)
$596,529
= + +
=

Solutions for Appendix A: CFA Questions and Problems
– 203 –
5. B is correct. The SRB will accept (i.e., require) a return of 4.50% (semiannual compounding). Find the time
ten future value of $100 million at this rate. The answer is $100,000,000 × (1 + .045/2)20 = $156,050,920.
7. C is correct. If the distribution of the durations of the assets is wider than that of the liabilities, the durations
Chapter 17
Level I
1. A. Efficient market hypothesis (EMH) states that a market is efficient if security prices immediately
and fully reflect all available relevant information. Efficient means informationally efficient, not operationally
efficient. Operational efficiency deals with the cost of transferring funds. If the market fully reflects information, the
Empirical evidence supports the weak form.
A strong body of evidence supports weak-form efficiency in the major U.S. securities markets. For example, test
results suggest that technical trading rules do not produce superior returns after adjusting for transaction costs and
taxes.

Solutions for Appendix A: CFA Questions and Problems
– 204 –
iii. Strong form of EMH holds that current market prices reflect all information, whether publicly available or
privately held, that is relevant to the firm.
B. Technical analysis in the form of charring involves the search for recurrent and predictable patterns in stock
prices to enhance returns. The EMH implies that this type of technical analysis is without value. If past prices
contain no useful information for predicting future prices, there is no point in following any technical trading rule
for timing the purchases and sales of securities. According to weak-form efficiency, no investor can earn excess
returns by developing trading rules based on historical price and return information. A simple policy of buying and
holding will be at least as good as any technical procedure. Tests generally show that technical trading rules do not
produce superior returns after making adjustments for transactions costs and taxes.
Fundamental analysis uses earnings and dividend prospects of the firm, expectations of future interest rates, and risk
C. Portfolio managers have several roles or responsibilities even in perfectly efficient markets. The most
important responsibility is to:
i. Identify the risk/return objectives for the portfolio given the investor’s constraints. In an efficient market,
portfolio managers are responsible for tailoring the portfolio to meet the investor’s needs rather than requirements
and risk tolerance. Rational portfolio management also requires examining the investor’s constraints, such as

Solutions for Appendix A: CFA Questions and Problems
level of systematic risk that matches the investor’s risk tolerance.
iii. Reducing transaction costs with a buy-and-hold strategy. Proponents of the EMH advocate a passive
investment strategy that does not try to find under or overvalued stocks. A buy-and-hold strategy is consistent with
v. Implement the chosen investment strategy and review it regularly for any needed adjustments. Under the
EMH, portfolio managers have the responsibility of implementing and updating the previously determined
investment strategy of each client.
D. Whether active asset allocation among countries could consistently outperform a world market index
depends on the degree of international market efficiency and the skill of the portfolio manager. Investment
professionals often view the basic issue of international market efficiency in terms of cross-border financial market
2. Let us compute the terminal value of $1 invested. The share class with the highest terminal value net of all
expenses would be the most appropriate, because all classes are based on the same portfolio and thus have the same
portfolio risk characteristics.

Solutions for Appendix A: CFA Questions and Problems
A. Class A. $1 × (1 − 0.05) = $0.95 is the amount available for investment at t = 0, after paying the front-end
sales charge. Because this amount grows at 9% per year, reduced by annual expenses of 0.0125, the terminal value
per $1 invested after one year is $0.95 × 1.09 × (1 − 0.0125) = $1.0226.
B. Class A. The terminal value per $1 invested after three years is $0.95 × 1.093 × (1 − 0.0125)3 = $1.1847.
Class B. Ignoring any deferred sales charge, after three years, $1 invested glows to $1 × 1.093 × (1 − 0.015)3 =
$1.2376. The deferred sales charge would be 2%; therefore, the terminal value is $1.2376 × 0.98 = $1.2128.
Class C. There would be no deferred sales charge. Thus, after three years, $1 invested grows to $1 × 1.093 × (1 −
D. Class A. The terminal value per $1 invested after 15 years is $0.95 × 1.0915 × (1 − 0.0125)15 = $2.8653.
Class B. There would be no deferred sales charge. So, the terminal value per $1 invested after 15 years is $1 × 1.0915
Level II
3. C is correct. This question–asks about compliance procedures relating to personal investments of members
and candidates. The statement in answer C clearly conflicts with the recommended procedures in the Handbook.
Employers should compare personal transactions of employees with those of clients on a regular basis regardless of
the existence of a requirement by a regulatory organization. Such comparisons ensure that employees’ personal
Solutions for Appendix A: CFA Questions and Problems
trades do not conflict with their duty to their clients, and the comparisons can be conducted in a confidential manner.
The statement in answer A does not conflict with the procedures in the Handbook. Disclosure of such policies will
Level III
4. The real return from the recommended allocation should meet the minimum required return identified in
the IPS. The allocation philosophy will reflect the Foundation’s return objective, above-average risk tolerance, low
liquidity requirements, and tax-exempt status. In general the portfolio allocation should include the following:
► An allocation to fixed-income instruments of less than 50 percent, because real returns of bonds are
forecasted to be lower than those of stocks. Bonds will be included primarily for diversification and risk reduction.
Asset Class
7-Year Forecast of
Real Returns
Recommended
Allocation
Real Return
Contribution
Cash (U.S.): T-bills
0.7%
0%
—
Bonds

Solutions for Appendix A: CFA Questions and Problems
International
4.9
10
0.490
Stocks
Large cap
5.5
30
1.650
Small cap
8.5
10
0.850
International
6.6
10
0.660
Venture capital
5.0
10
0.500
5. A. The three main large-cap styles are value, growth, and market oriented.
B. Value managers seek 10 buy stocks below their intrinsic value. That said, the stocks may be cheap for good
reason. Also, it may take a long time for stocks to reach their intrinsic value. Growth managers buy stocks of
6. A. Equity market-neutral strategies identify over-and undervalued stocks while neutralizing the
fund’s exposure to market risk by combining long and short positions with similar exposure to related market or
sector factors. Therefore, as their name suggests, they have little or no market risk. They also have low credit risk
because their long–short positions result in net low leverage. As expected, there is virtually no correlation between
funds using this strategy and the S&P 500.
Convertible arbitrage strategies exploit anomalies in the prices of corporate convertible bonds, warrants, and
preferred stock. The convertible arbitrage funds buy or sell these securities and then hedge the risk of changes in
Solutions for Appendix A: CFA Questions and Problems
B. The usefulness of historical hedge fund data continues to be controversial. Research has shown that the
volatility of returns is more persistent through time than the level of returns. Issues such as survivorship and backfill
bias have a significant impact on historical tests of performance persistence. Additionally, lock–up periods,
restrictions on redemptions/withdrawals, and the relatively short track record of many hedge funds complicate the
extrapolation of past performance to expected (future) performance of hedge funds.
Chapter 18
Level III
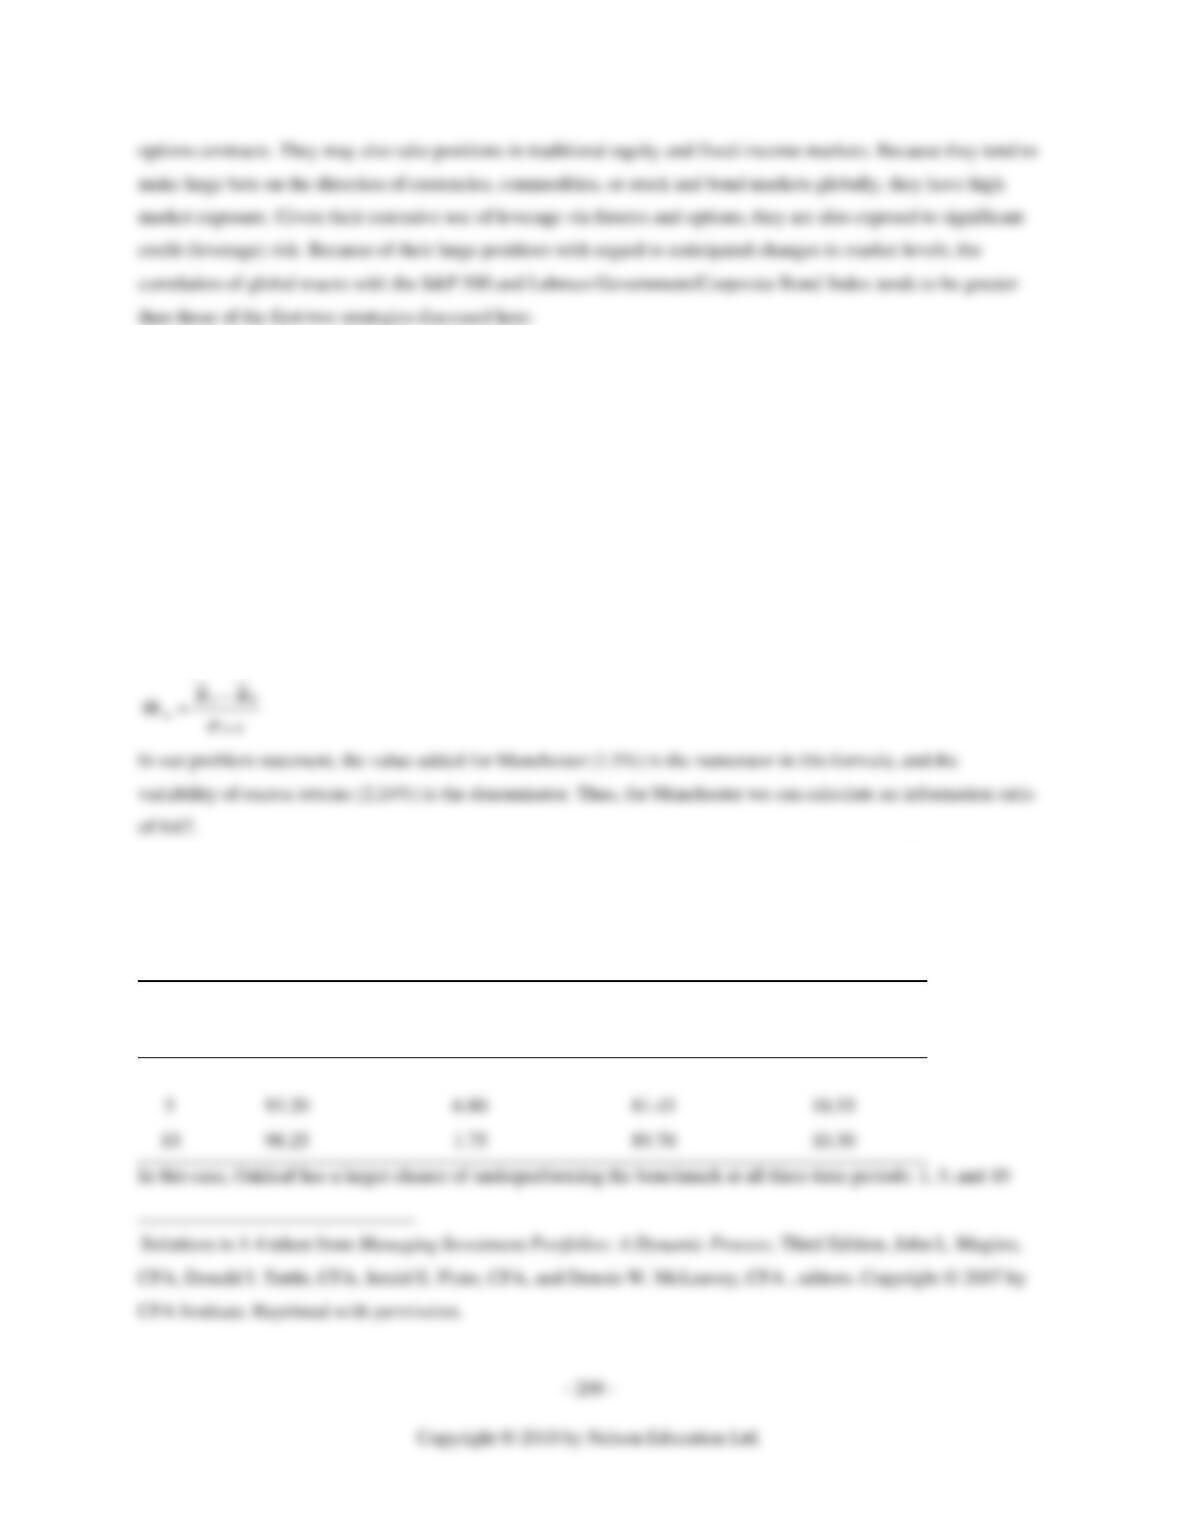
1. We begin by calculating the information ratio for each of the two managers. The formula for the
information ratio is:
Similarly, for Oakleaf we can calculate an information ratio of 0.4 (4% excess returns divided by 10% variability).
When we review our table, it gives the probability of outperformance. Since the question refers to
underperformance, we must subtract the values in the table from 1 to determine the probability of
underperformance.
Year
Manchester
Outperformance
Manchester
Underperformance
Oakleaf
Outperformance
Oakleaf
Underperformance
1
74.75%
25.25%
65.54%
34.46%
5

Solutions for Appendix A: CFA Questions and Problems
2. In general terms, equity will earn higher returns than cash on average over the long term. However, there
are periods of declining equity performance when cash may outperform equities.
3. A. and B. To calculate annual performance for Year 1 and Year 2, convert the quarterly returns to
relative form (1 + r), link them multiplicatively, and subtract 1.
For Year 1:
1QYear 1: 1 4.76% 1.0476
2QYear 1: 1+12.08% 1.1208
3QYear 1: 1 ( 4.88%) 0.9512
4QYear 1: 1 7.14% 1.0714
+=
=
+ − =
+=
D. To calculate annualized compound performance, convert the cumulative rate of return to relative form (1 +

Solutions for Appendix A: CFA Questions and Problems
4. The GIPS standards require that the total return of a benchmark (or benchmarks) that reflects the
investment strategy or mandate represented by the composite must be presented for each annual period. If no
benchmark is presented, the presentation must explain why not (Provision II.5.A.6).

Solutions for Appendix A: CFA Questions and Problems
Web Chapter 19
Level I
1. C is correct. Impairment write-downs reduce equity in the denominator of the debt–to-equity ratio but do
2. B is correct. Higher reported tax expense relative to taxes paid will increase the deferred tax asset, whereas
lower reported tax expense relative to taxes paid increases the deferred tax liability.
4. A is correct. In the early years, a finance lease generally results in higher reported expenses, lower
5. C is correct. ROE = Return on assets × Financial leverage. ROA can be decomposed into the product of net
profit margin (net income divided by revenue) and total asset turnover (revenue divided by average total assets).
6. C is correct. The increase in the average tax rate in 2005, as indicated by the decrease in the value of the tax
burden (the tax burden equals one minus the average tax rate), offset the improvement in efficiency indicated by
Level II
7. C is correct. The ROE has been trending higher. ROE can be calculated by multiplying (Net profit margin)

Solutions for Appendix A: CFA Questions and Problems
8. A is correct. The DuPont analysis shows that profit margins and asset turnover have both increased over the
9. B is correct. The Power and Industrial segment has the lowest EBIT margins but uses about 31 percent of
the capital employed. Further, Power and industrial’s proportion of the capital expenditures has increased from 32
11. A is correct. The cash-flow-based accruals ratio falls from 11.0 percent in 2007 to 5.9 percent in 2008, and
12. B is correct. Net cash flow provided by (used in) operating activity has to be adjusted for interest and taxes,
13. A is correct. Operating cash flow before interest and taxes to operating income rises steadily (not
erratically) from 1.2 to 1.3 to 1.9. The ratios over 1.0 and the trend indicate that earnings are supported by cash flow.
Web Chapter 20
Level I
1. C is correct. Credit analysts consider both business risk and financial risk.

Solutions for Appendix A: CFA Questions and Problems
2. A. P/E: EPS equals net income divided by the number of shares outstanding or 289/440 = 0.66. P/E =
13.89/13.71 = 1.
B. One advantage of P/S over P/E is that companies’ accounting decisions can have a much greater impact
upon reported earnings than they are likely to have on reported sales. Although companies are able to make a
0.048 or 4.8 percent. Sales is the top line in the income statement: It does not reflect costs. Thus differences in P/S
ratios may reflect differences in cost structure; the net profit margin, reflect cost structures, is relevant to
determining whether this possible explanation for different P/S ratios may be valid in a given instance.
3. A. Book value per share = [(Shareholders’ equity) − (Total value of equity claims that are senior to
common stock)]/(Number of common stock shares outstanding) = (11,707 − 8,442)/440 = 3,265/440 = 7.42. P/B =
13.89/7.42 = 1.9.
B. One advantage of P/B over P/E is that book value is more stable than EPS and P/B may be more
4. A. Per-share CF = EPS plus per-share depreciation, amortization, and depletion. CF = net income of
289 + depreciation and amortization of 707 = 996 million. So per-share CF = 996/440 = 2.26. P/CF = 13.89/2.26 =
6.1.

Solutions for Appendix A: CFA Questions and Problems
Note that “other noncash expenses” of 91 were not added back to net income in computing CF.
Level II
5. A.
01 (ROE )
Intrinsic P/E ratio 1 .
ROE
r
Pbr
E r r b
−
= = +
−
In this case, b = 0, because the company pays out all its earnings. So, P0/E1 = 1/r = 1/0.13 = 7.69.
B. Again, P0/E1 = 1/r = 1/0.13 = 7.69.
C. It is clear from the expression in Part A that if b = 0, the intrinsic P/E value is independent of ROE. To
6. The dividends in Stages 2 and 3 can be valued with the H-model, which estimates their value at the
beginning of Stage 2. In this case, V6 would capture the value of Stages 2 and 3 dividends. V6 would then be
discounted to the present. Also, the present values of dividends D1 through D6 need to be added to the present value
of V6.
Solutions for Appendix A: CFA Questions and Problems
– 216 –
66
60(1 ) 9(1.14) 19.7548
0.16
10 / 2 5
S
DDg
r
H
=+ = =
=
==
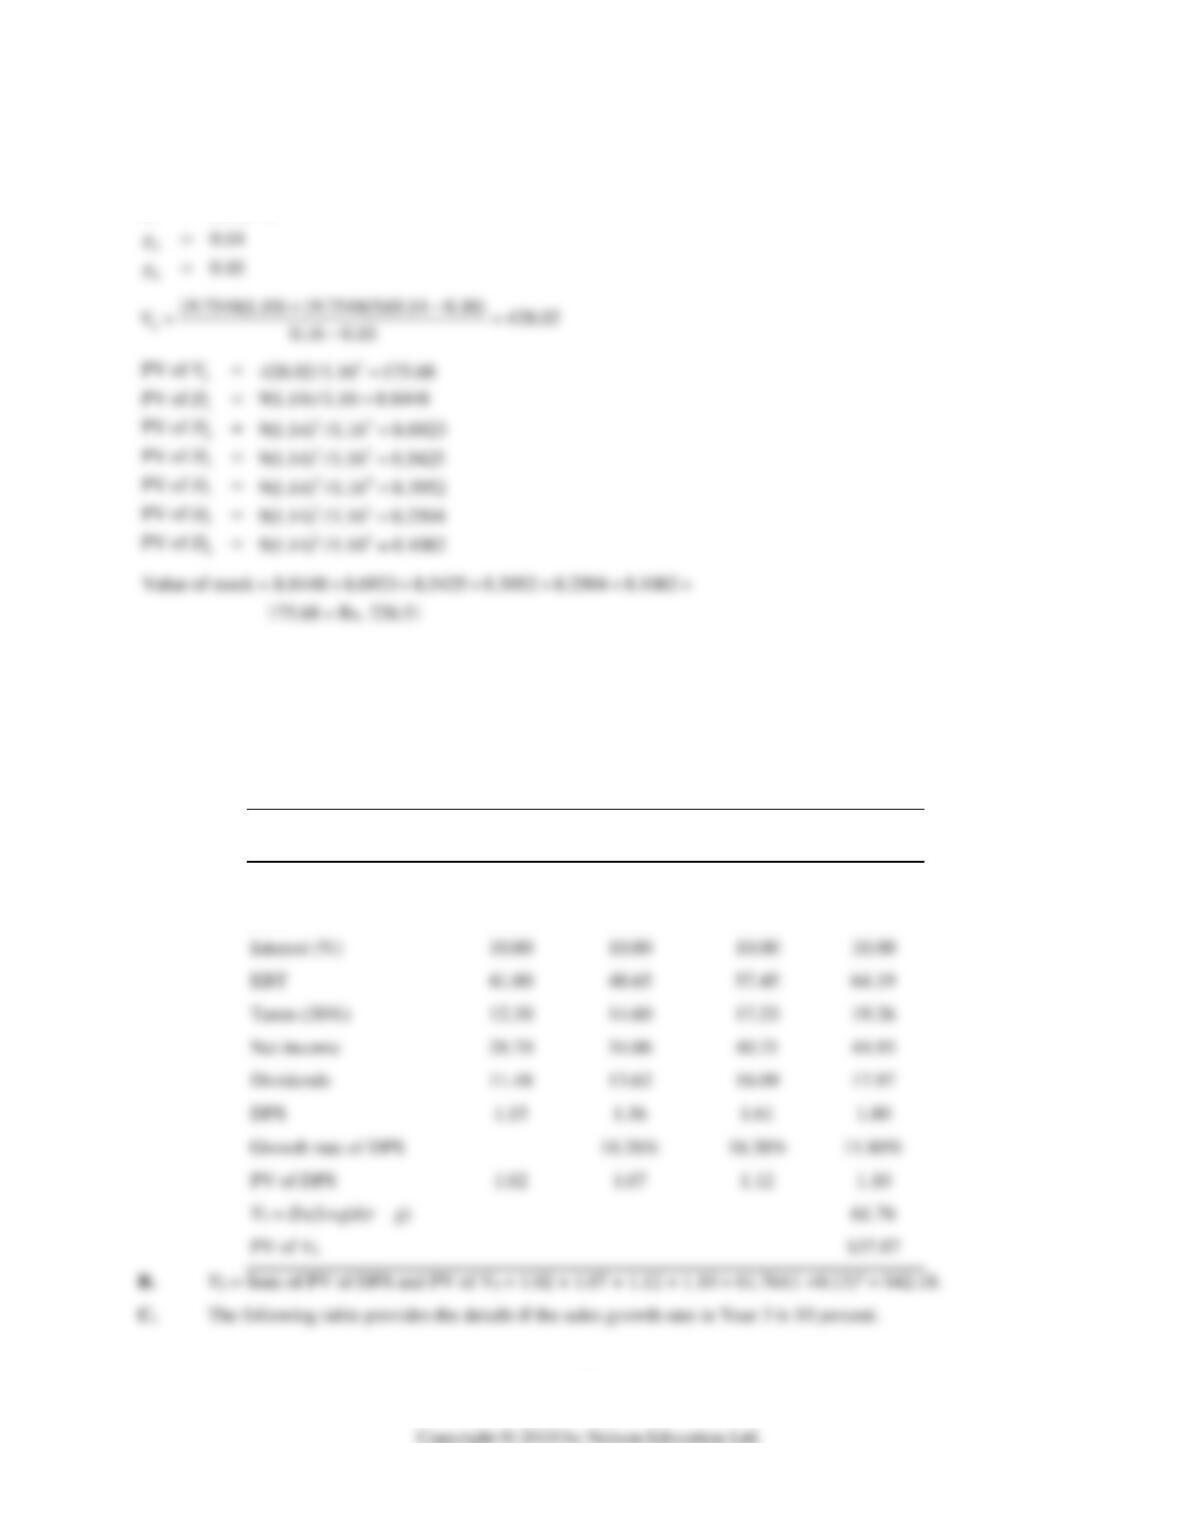
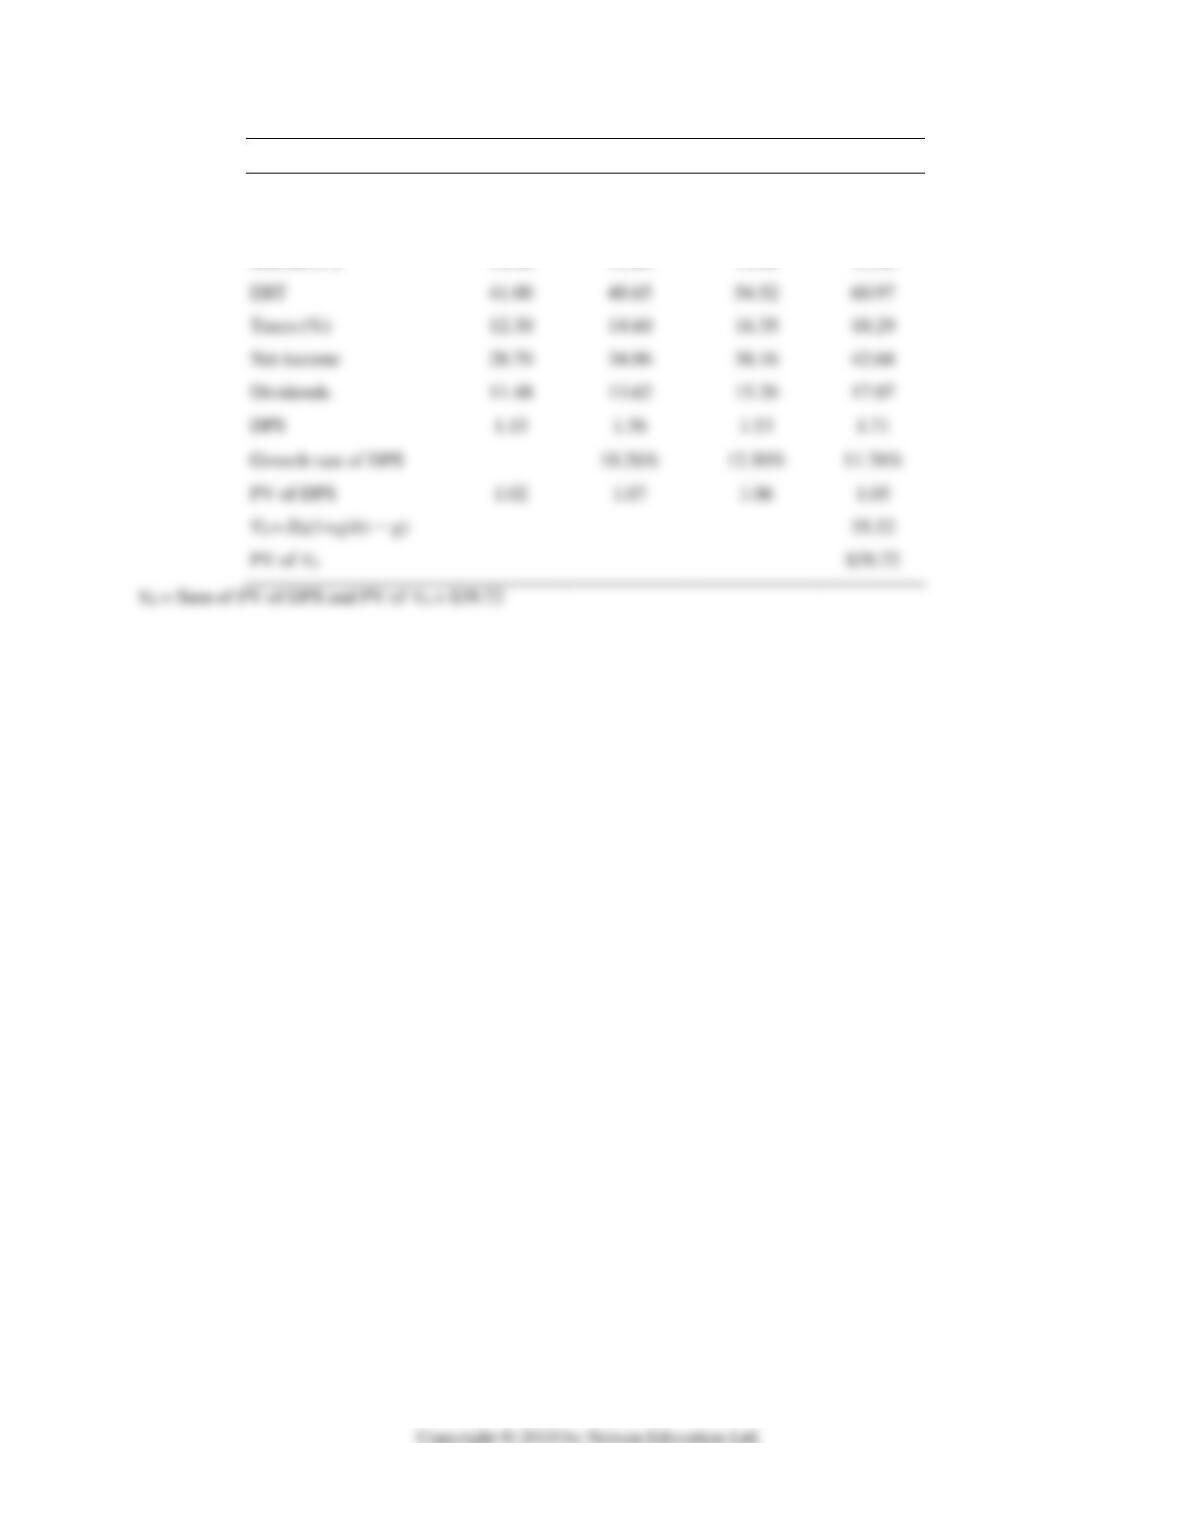
7. A. The table on the following page provides the details from the spreadsheet model. The constant
growth rate after Year 4 is 2 percent less than that in Year 4. So,
44
0.1180 0.0200 0.098 or 9.8 percent.
(1 ) /( ) 1.80(1.098) /(0.13 0.098) $61.76
g
V D g r g
= − =
= + − = − =
Year
1
2
3
4
Sales ($ millions)
300.00
345.00
396.75
436.43
EBIT
51.00
58.65
67.45
74.19
Net income
28.70
34.06
40.21
44.93
PV of DPS
Solutions for Appendix A: CFA Questions and Problems
– 217 –
Year
1
2
3
4
Sales ($ millions)
300.00
345.00
379.50
417.45
EBIT
51.00
58.65
64.52
70.97
Interest (%)
10.00
10.00
10.00
10.00
Taxes (%)
12.30
14.60
16.35
18.29
Net income
28.70
34.06
38.16
42.68
Growth rate of DPS
PV of DPS
35.52