Solutions for Web Appendix 1A: Questions and Problems
– 10 –
APPENDIX 1A (Web)
A REVIEW OF STATISTICS AND THE SECURITY MARKET LINE
Answers to Problems
1(a). Expected Return = (Probability of Return)(Possible Return)
1(b). Standard deviation can be used as a good measure of relative risk between two investments
that have the same expected rate of return.
1(c). The coefficient of variation must be used to measure the relative variability of two
investments if there are major differences in the expected rates of return.
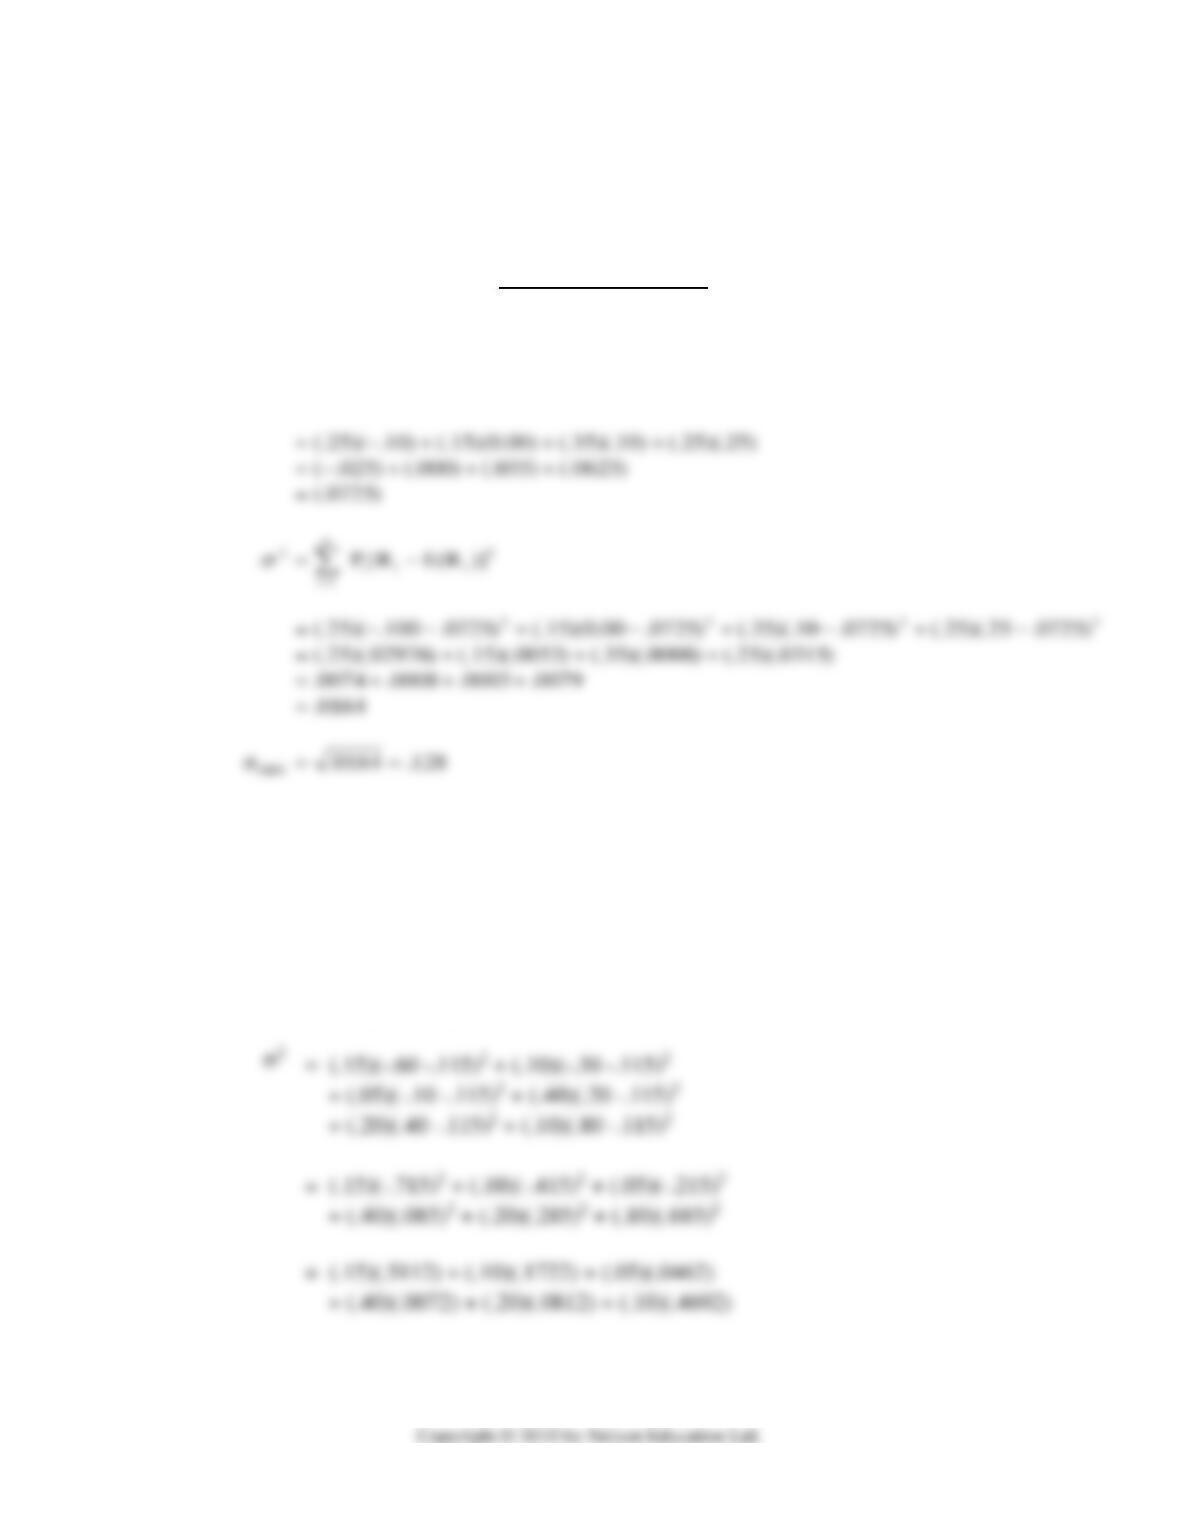
2(a). E(RCCC) = (.15)(-.60) + (.10)(-.30) + (.05)(-.10) + (.40)(.20) + (.20)(.40) + (.10)(.80)
= (-.09) + (-.03) + (-.005) + .08 + .08 + .08 = .115
]R[P)E(R
ii
n
1i
GDC
=
=
Solutions for Web Appendix 1A: Questions and Problems
– 11 –
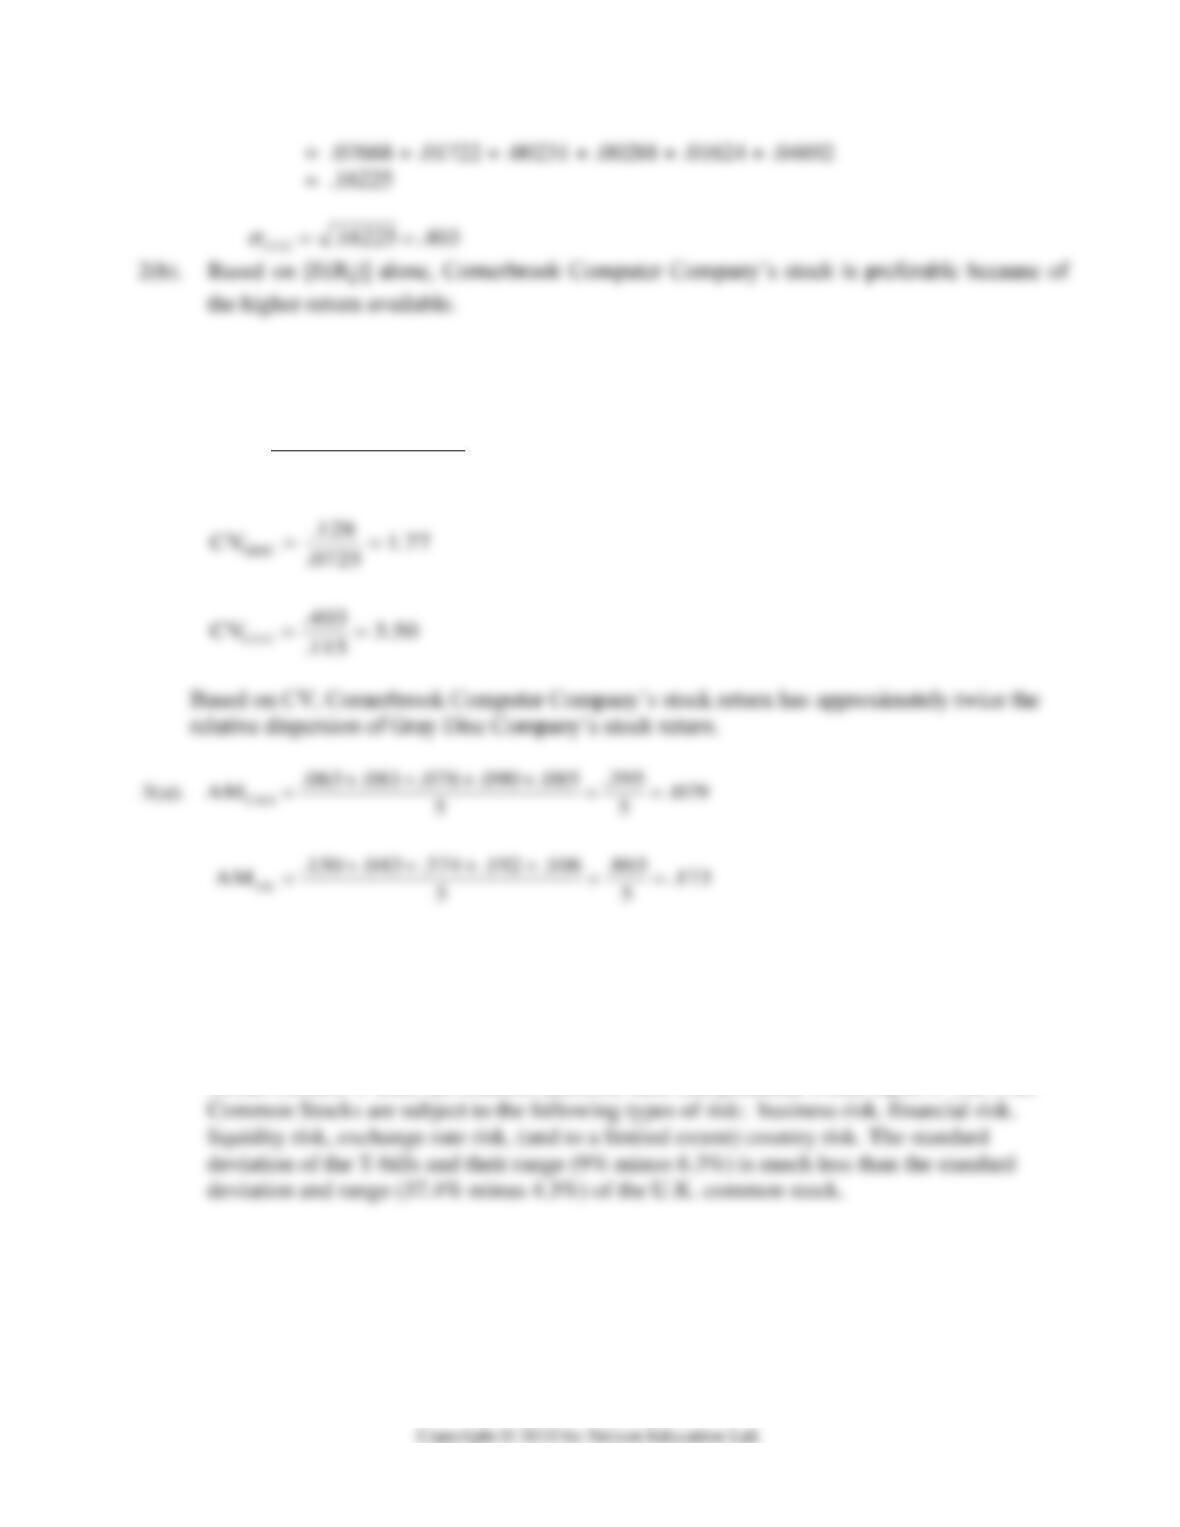
2(c). Based on standard deviation alone, the Gray Disc Company’s stock is preferable because
of the likelihood of obtaining the expected return since it has a lower standard deviation
Standard deviation of Canadian T-bills: 0.92% or 0.0092
Standard deviation of U.K. Common Stock: 11.2% or 0.112
3(b). The average return of T-Bills is lower than the average return of U.K. Common
Stocks because T-Bills are riskless, therefore their risk premium would equal 0. The U.K.
ReturnExpected
DeviationStandard
CV 2(d).
=
Solutions for Web Appendix 1A: Questions and Problems
– 12 –
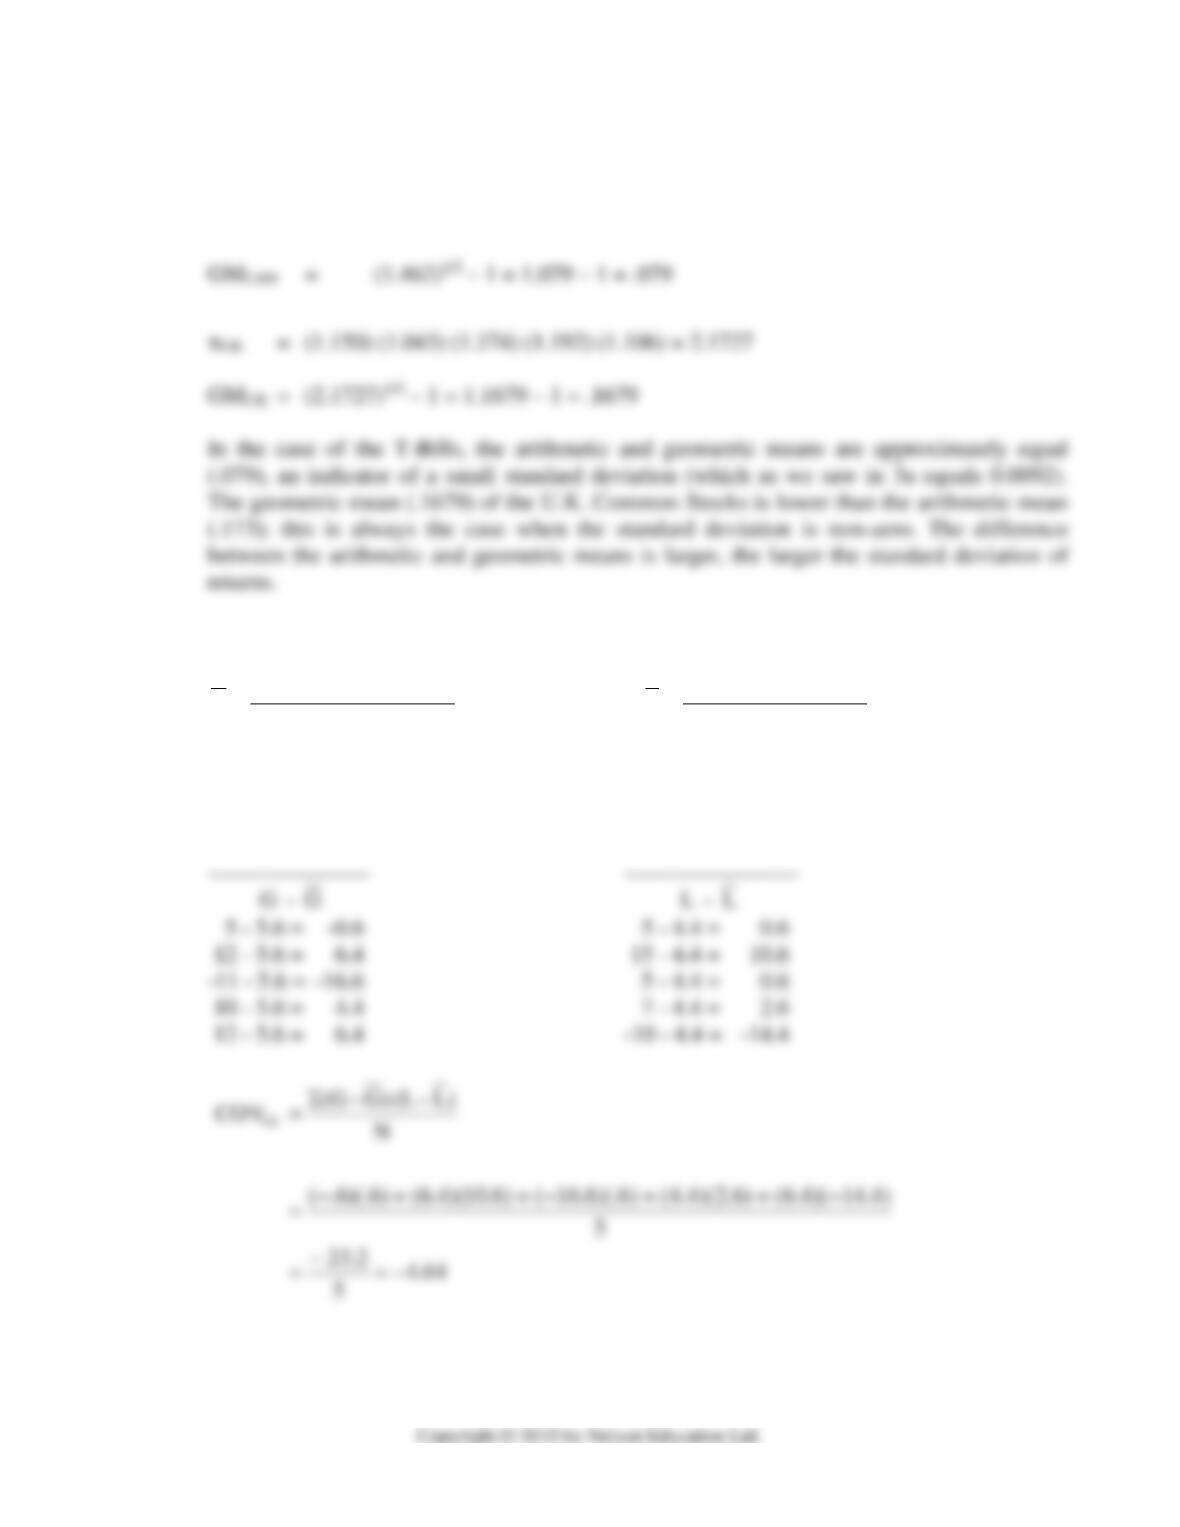
3(c). GM = 1/n – 1
CAN = (1.063) (1.081) (1.076) (1.090) (1.085) = 1.462
4. Granum’s average return Leader’s average return
4.4 22/5 5.6 28/5
5
)1075155(
L
5
)121011125(
G
====
−+++
=
++−+
=
Solutions for Web Appendix 1A: Questions and Problems
– 13 –
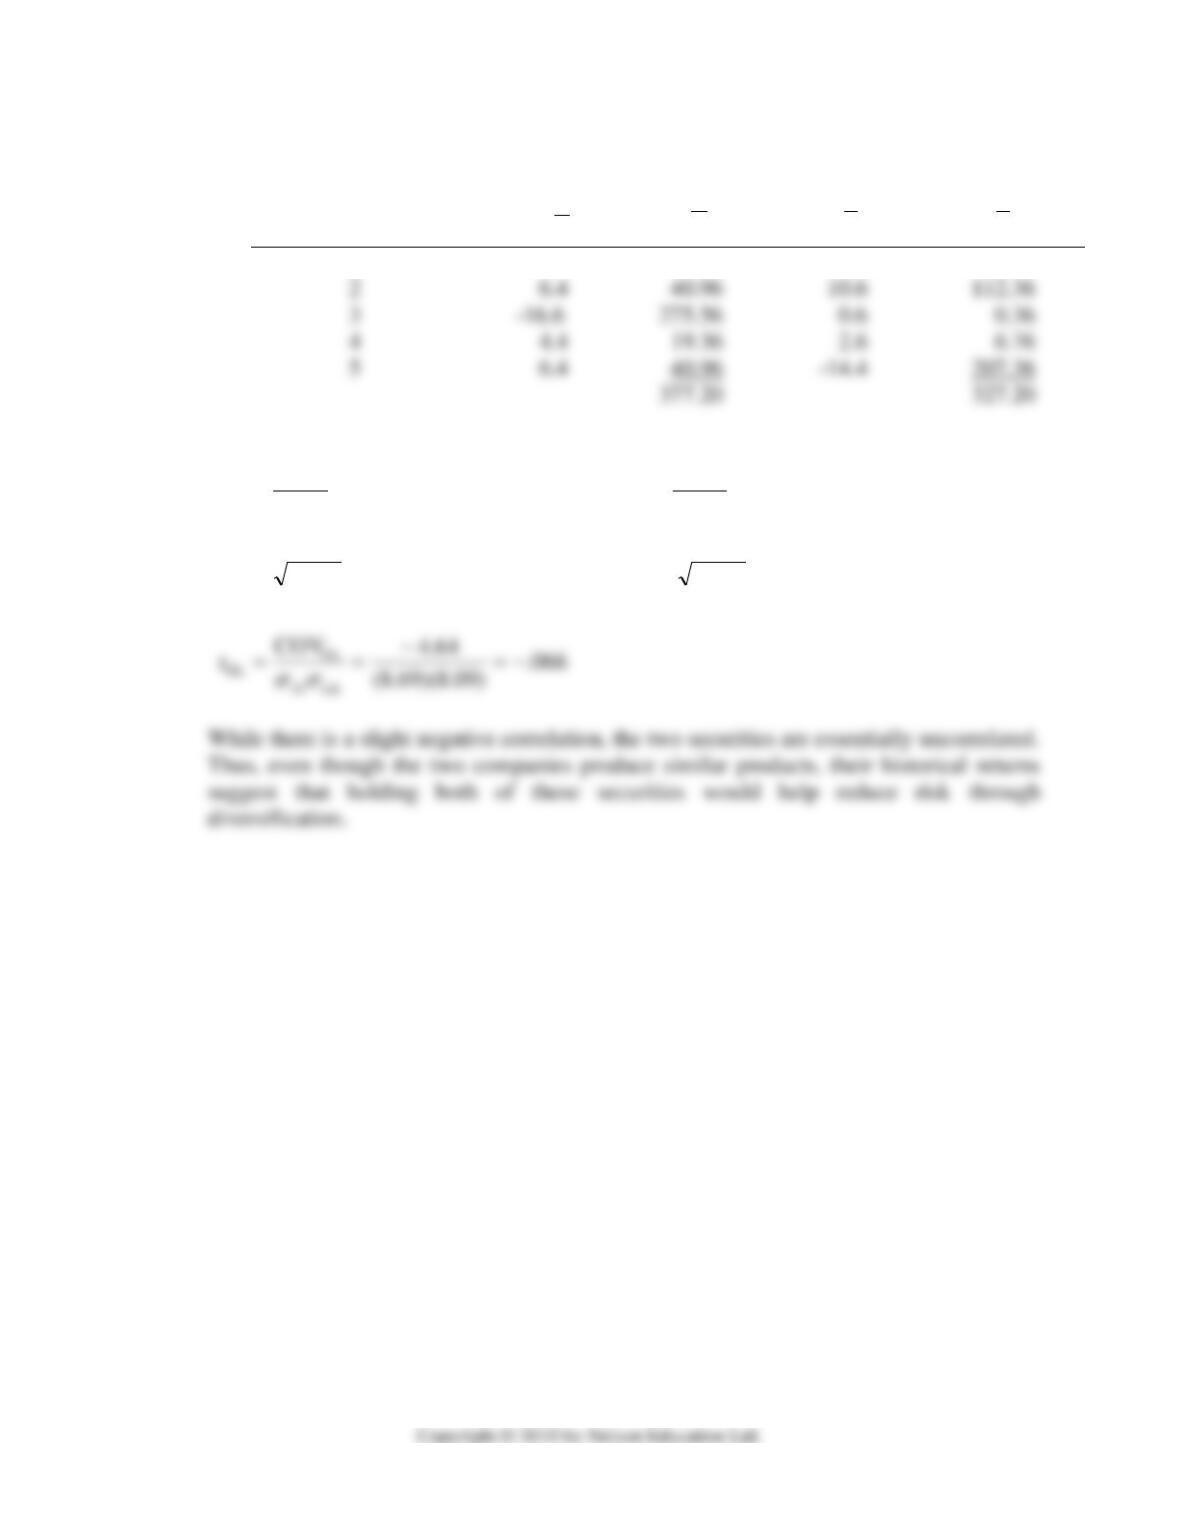
5. Calculation of Correlation Coefficient
Observation
1
-0.6
.36
0.6
.36
2
6.4
40.96
10.6
112.36
3
-16.6
275.56
0.6
0.36
4
4.4
19.36
2.6
6.76
5
6.4
40.96
-14.4
207.36
377.20
327.20
G–G
2
)G–(G
)L–(L
2
)L–(L
09.844.65 69.844.75
44.65
5
2.327
44.75
5
2.377
LK
2
L
2
====
====
G
G