Lab Exercise – 802.11
Objective
To explore the physical layer, link layer, and management functions of 802.11. It is widely used to wire-
less connect mobile devices to the Internet, and covered in §4.4 of your text. Review that section first.
Requirements
Wireshark: This lab uses the Wireshark software tool to capture and examine a packet trace. A packet
trace is a record of traffic at a location on the network, as if a snapshot was taken of all the bits that
passed across a particular wire. The packet trace records a timestamp for each packet, along with the
bits that make up the packet, from the lower–layer headers to the higher–layer contents. Wireshark runs
on most operating systems, including Windows, Mac and Linux. It provides a graphical UI that shows the
Step 1: Fetch a Trace
We provide a trace that you can use by starting Wireshark and selecting Open from the File menu. On
Windows/Mac, you may locate the trace file and open it directly to launch Wireshark with the trace. You
can now proceed to Step 2; the rest of this section is informational.
Unlike for the other labs, it may be difficult to gather your own trace, for several reasons. The main issue
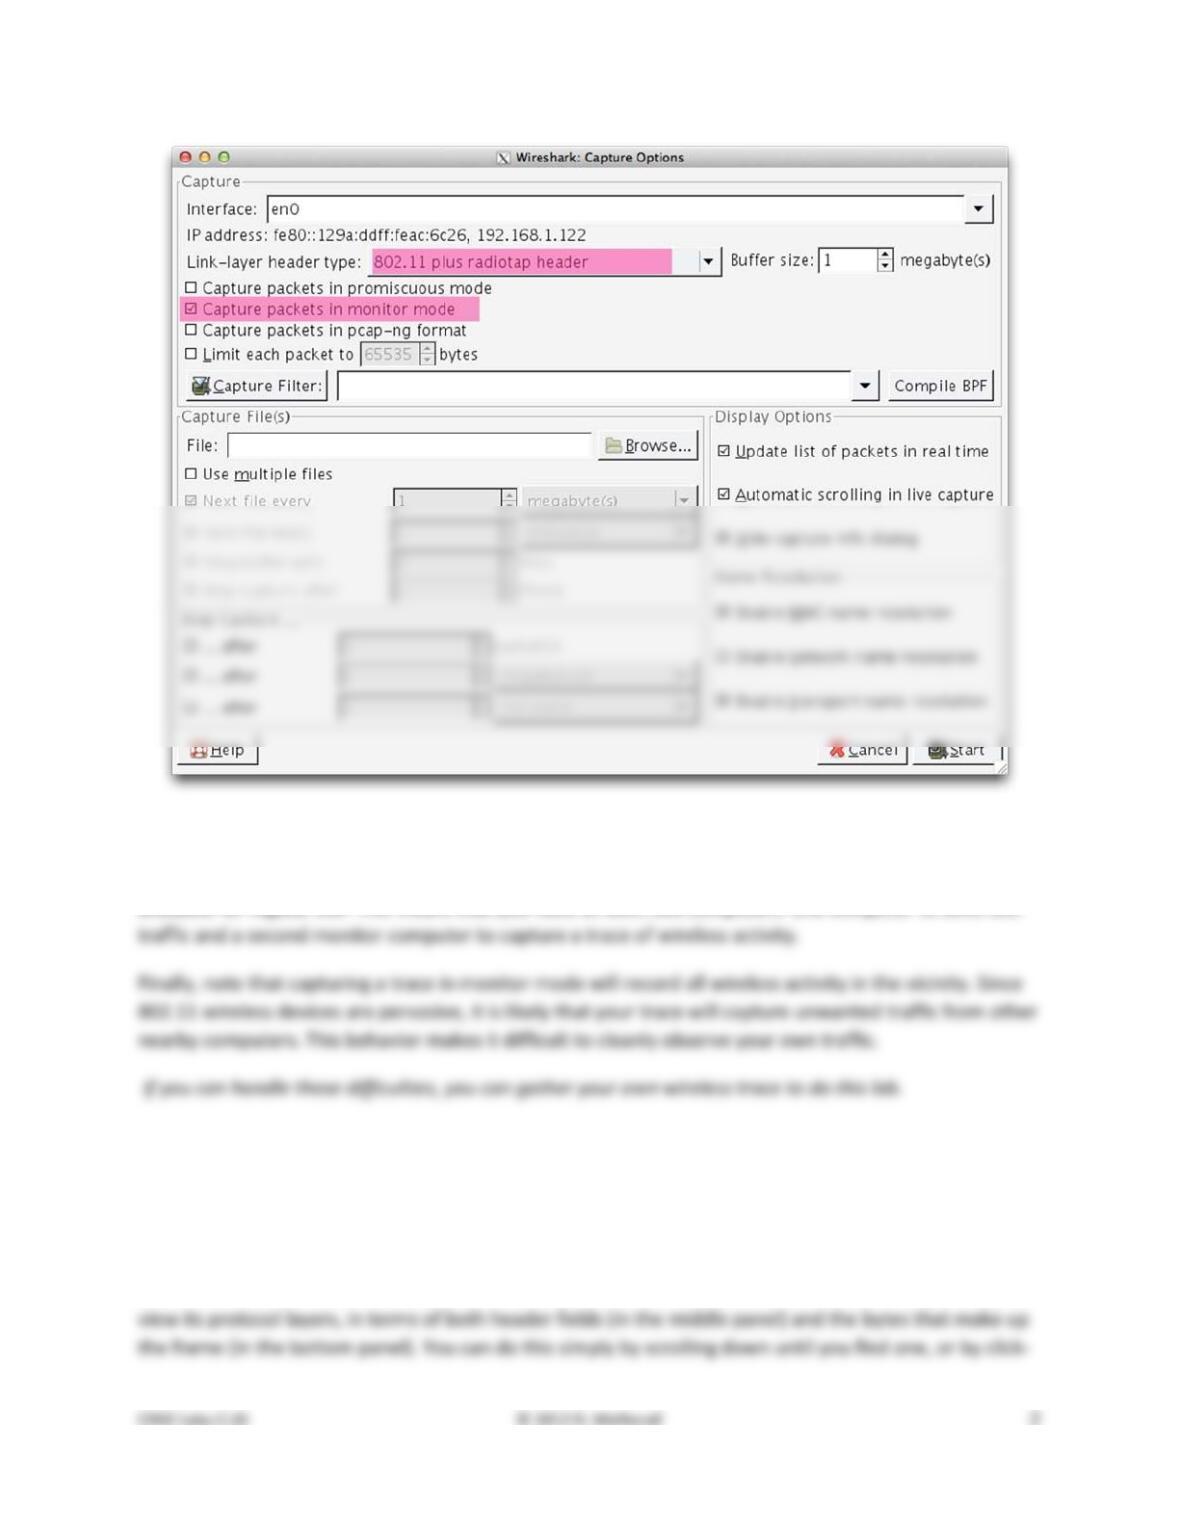
Figure 1: Capturing a wireless trace with Monitor mode (Mac)
A second difficulty is that when an interface captures wireless traffic in monitor mode, it is often not
available for regular use. This means that you need at least two computers: one computer to send test
Step 2: Inspect the Trace
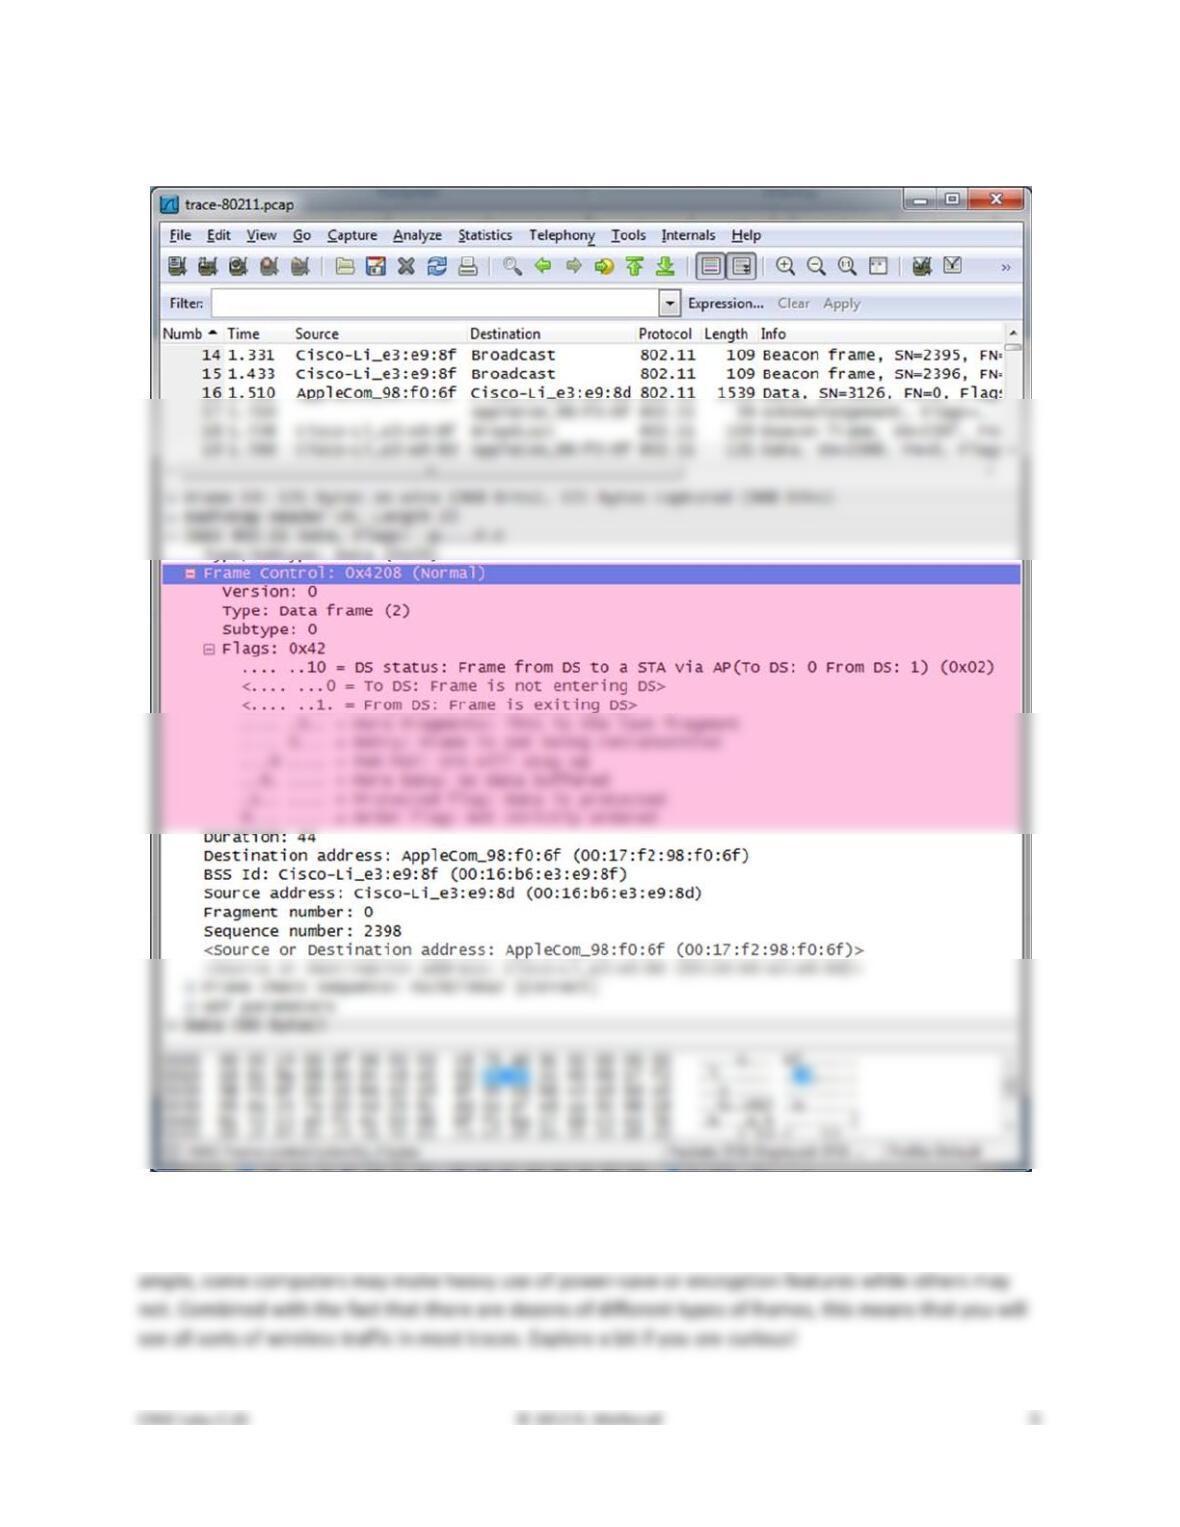
To begin, we will take a look at the format of an 802.11 frame. There are many different kinds of 802.11
frames that will be captured in a trace; the Info field describes the type, such as Beacon, Data, and
Acknowledgement. We will inspect a Data frame, which carries packets across 802.11 networks.
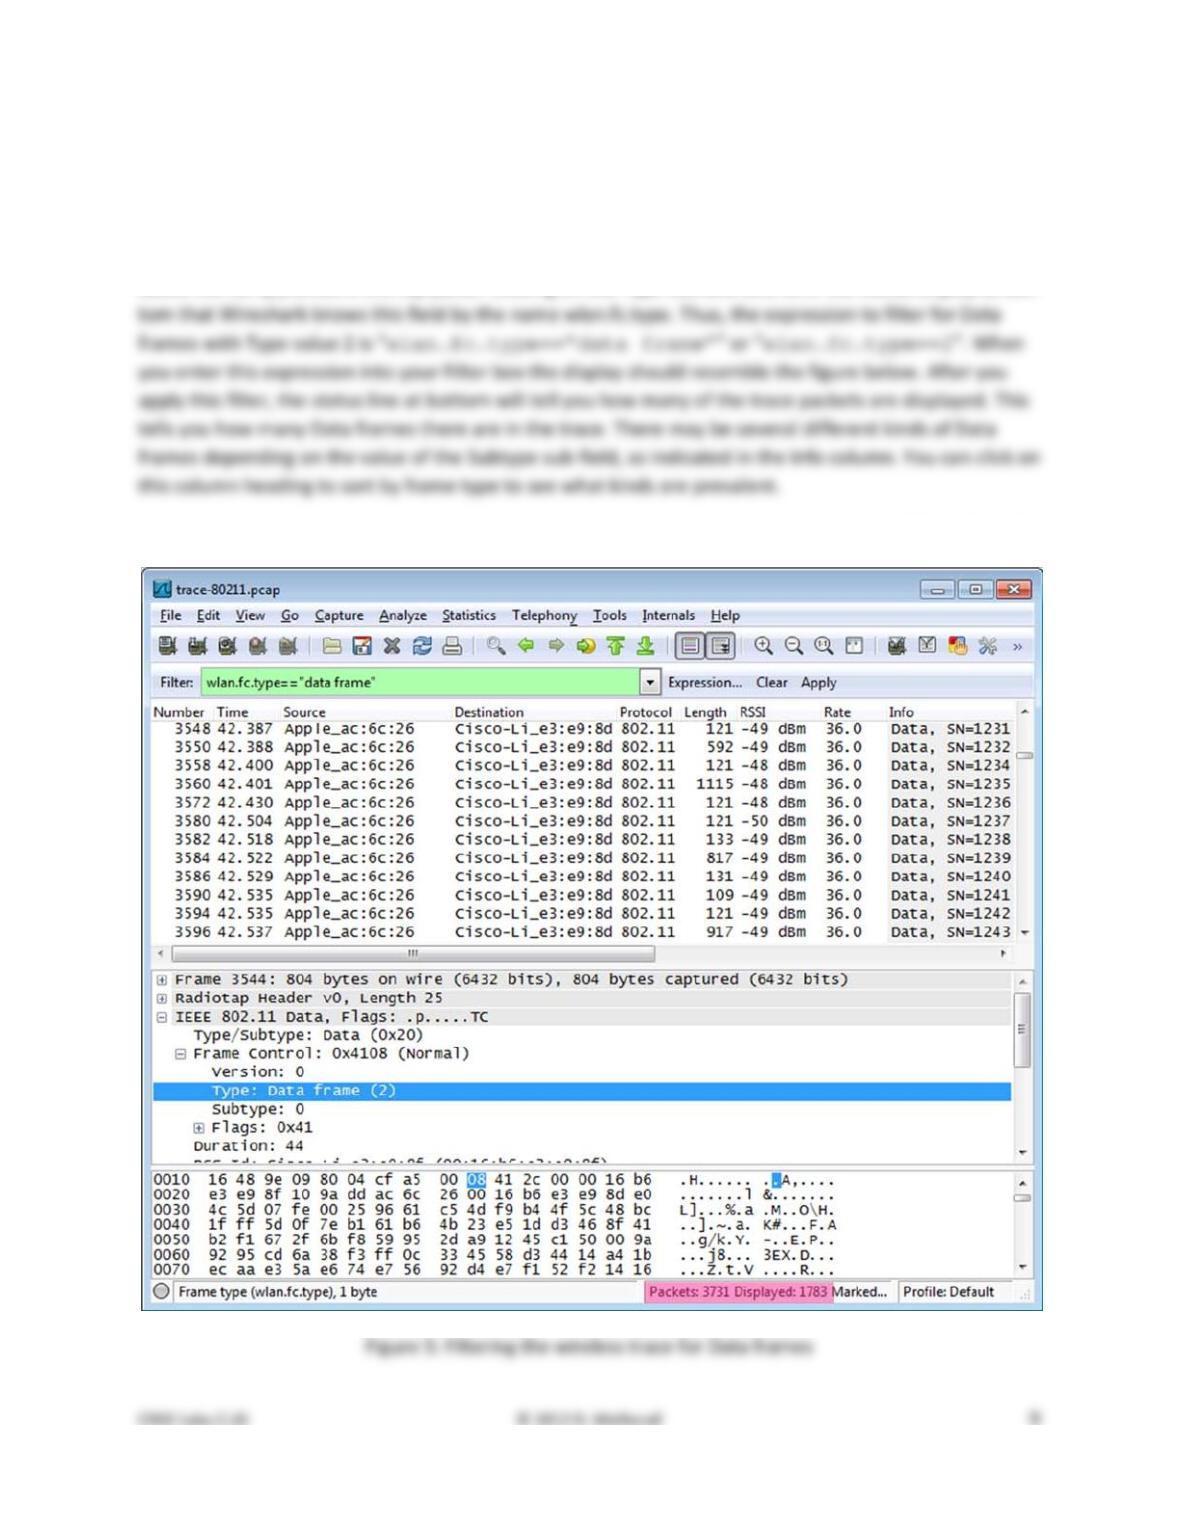
Find a Data frame in the trace and select it. Wireshark will let us select a frame (from the top panel) and
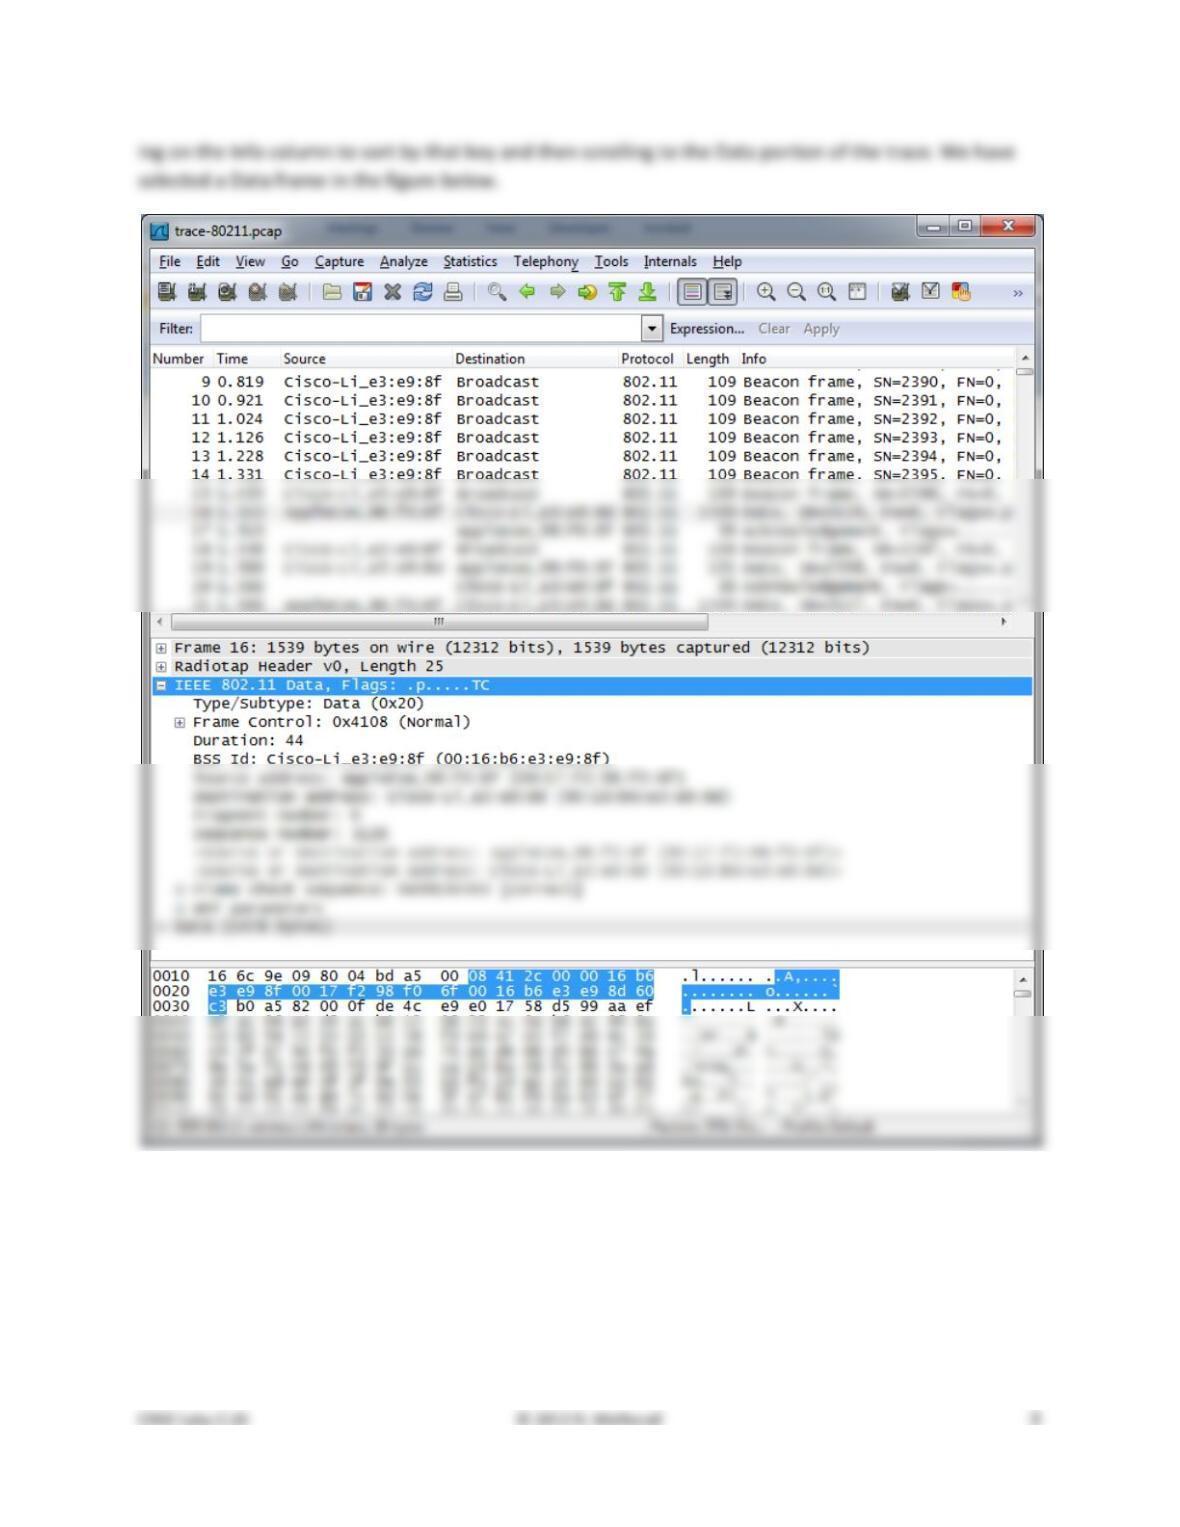
Figure 2: Inspecting an 802.11 Data frame
Inspect the protocol layers recorded with the frame for these protocols. Look in the middle panel.
• Frame is a record added by Wireshark with information about the time and length of the frame;
it does not capture bits that were sent “over the air”.
• Radiotap is also a record created by Wireshark to capture physical layer parameters, such as the
strength of the signal and the modulation. Skip this record for now; we will investigate it later.
• IEEE 802.11 is the bits of the 802.11 Data frame. This is the record we are looking for, and we
will go into its details shortly. It is selected and expanded in the figure so that you can see the in–
If Wireshark can understand the contents of the Data frame payload then it will create protocol records
Expand the IEEE 802.11 record of the Data frame and inspect the details of the various header fields. You
can expand this block using the “+” expander or icon; it is shown expanded in our figure. To inspect the
fields, you may compare them with Fig. 4–29. The fields in Wireshark are:
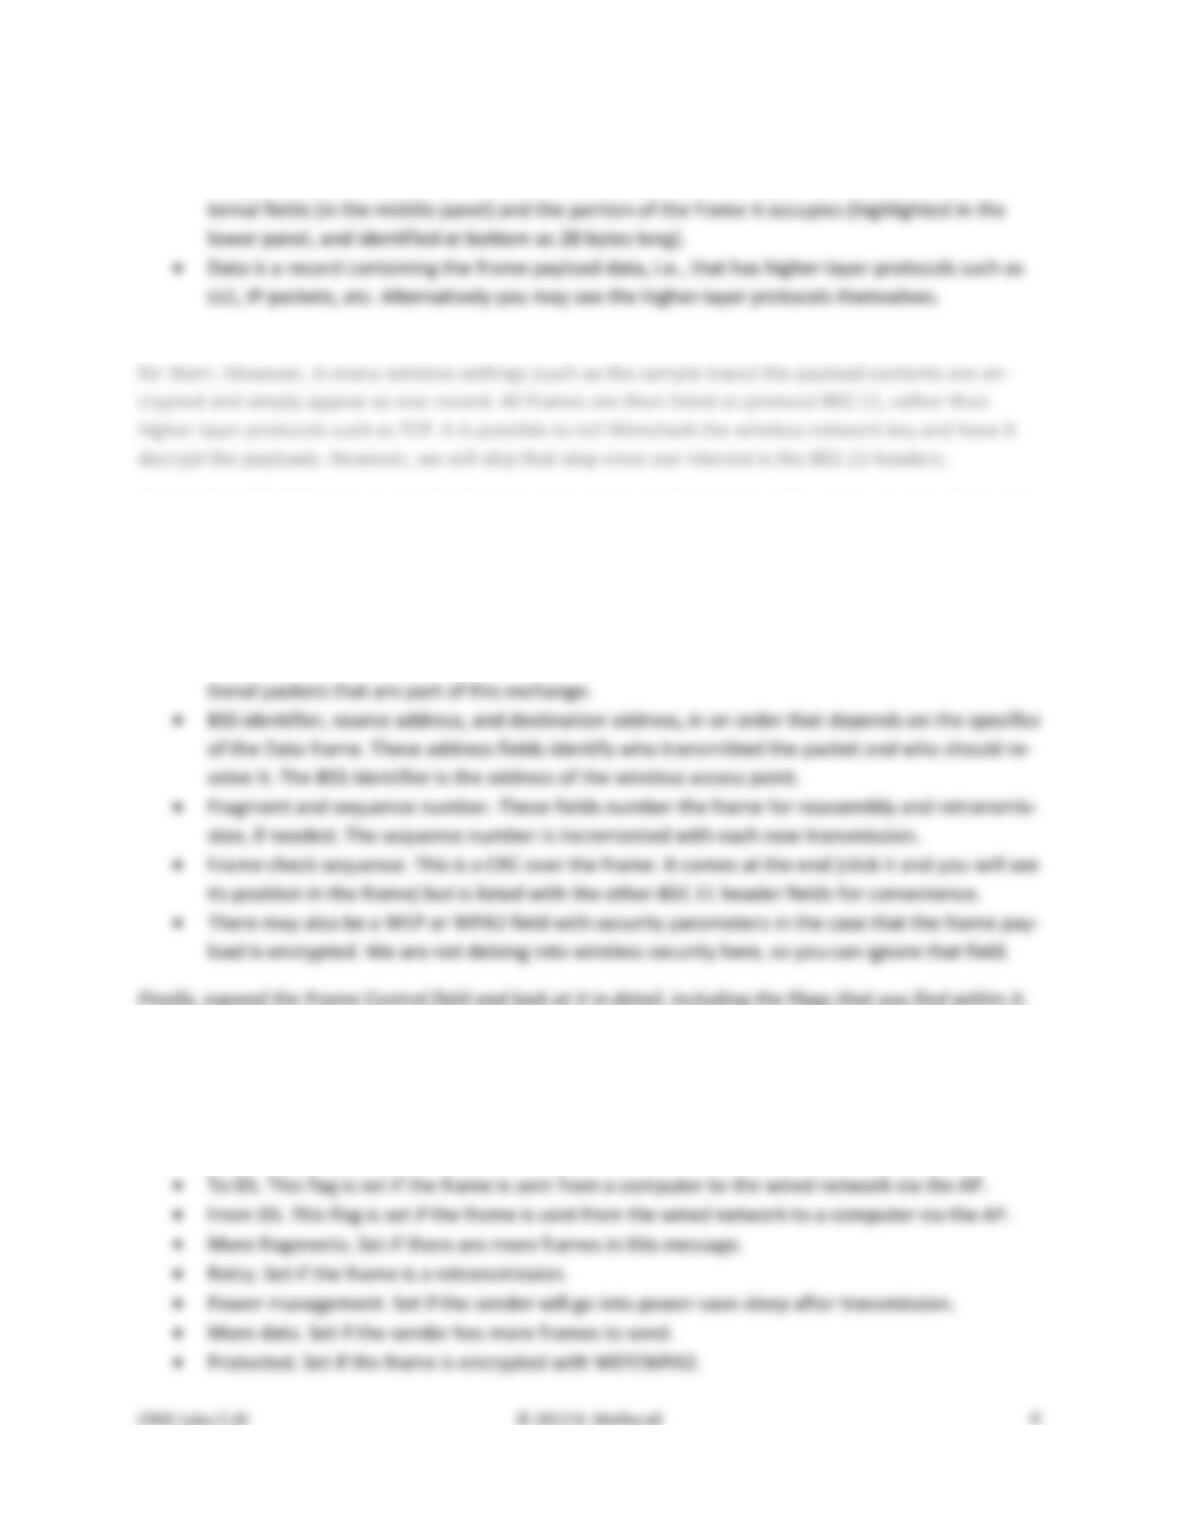
• Frame Control . It encodes the frame Type and Subtype, e.g., Data, as well as various flags. We
will look at these fields in more detail shortly.
• Duration. This field tells computers how much time is needed on the wireless medium for addi-
All 802.11 frames begin with a Frame Control field, and the details of the subfields and flags determine
the format of the rest of the message; it may be like the Data frame we explored above or very different
such as an Ack frame we will look at later. The subfields are:
• Version, with a value of zero for the current version.
• Type and Subtype specify the type of frame, e.g., Data or Ack.
• Order. Set if the receiver must keep the frames in order.
Figure3: Expanded view of the Frame Control fields and Flags
Different computers may use these flags differently depending on how they implement 802.11. For ex-
Step 3: 802.11 Physical Layer
Now that we have some familiarity with 802.11 Data frames, we will take a closer look at different parts
of the wireless system, starting with the physical layer. At the lowest layer, sending and receiving mes-
sages is all about the frequency band, modulation, the signal–to–noise ratio with which the signal is re-
ceived. We can look at all of these factors using information in the Radiotap header!
Answer the numbered questions in this step to explore the physical layer aspects, beginning with fre-
quency. The frequency or channel is the same for all frames in the trace, since the wireless network in-
terface is set to listen on a fixed frequency.
1. What is the channel frequency? To find the frequency, expand the Radiotap header of any frame
and look for the Channel frequency.
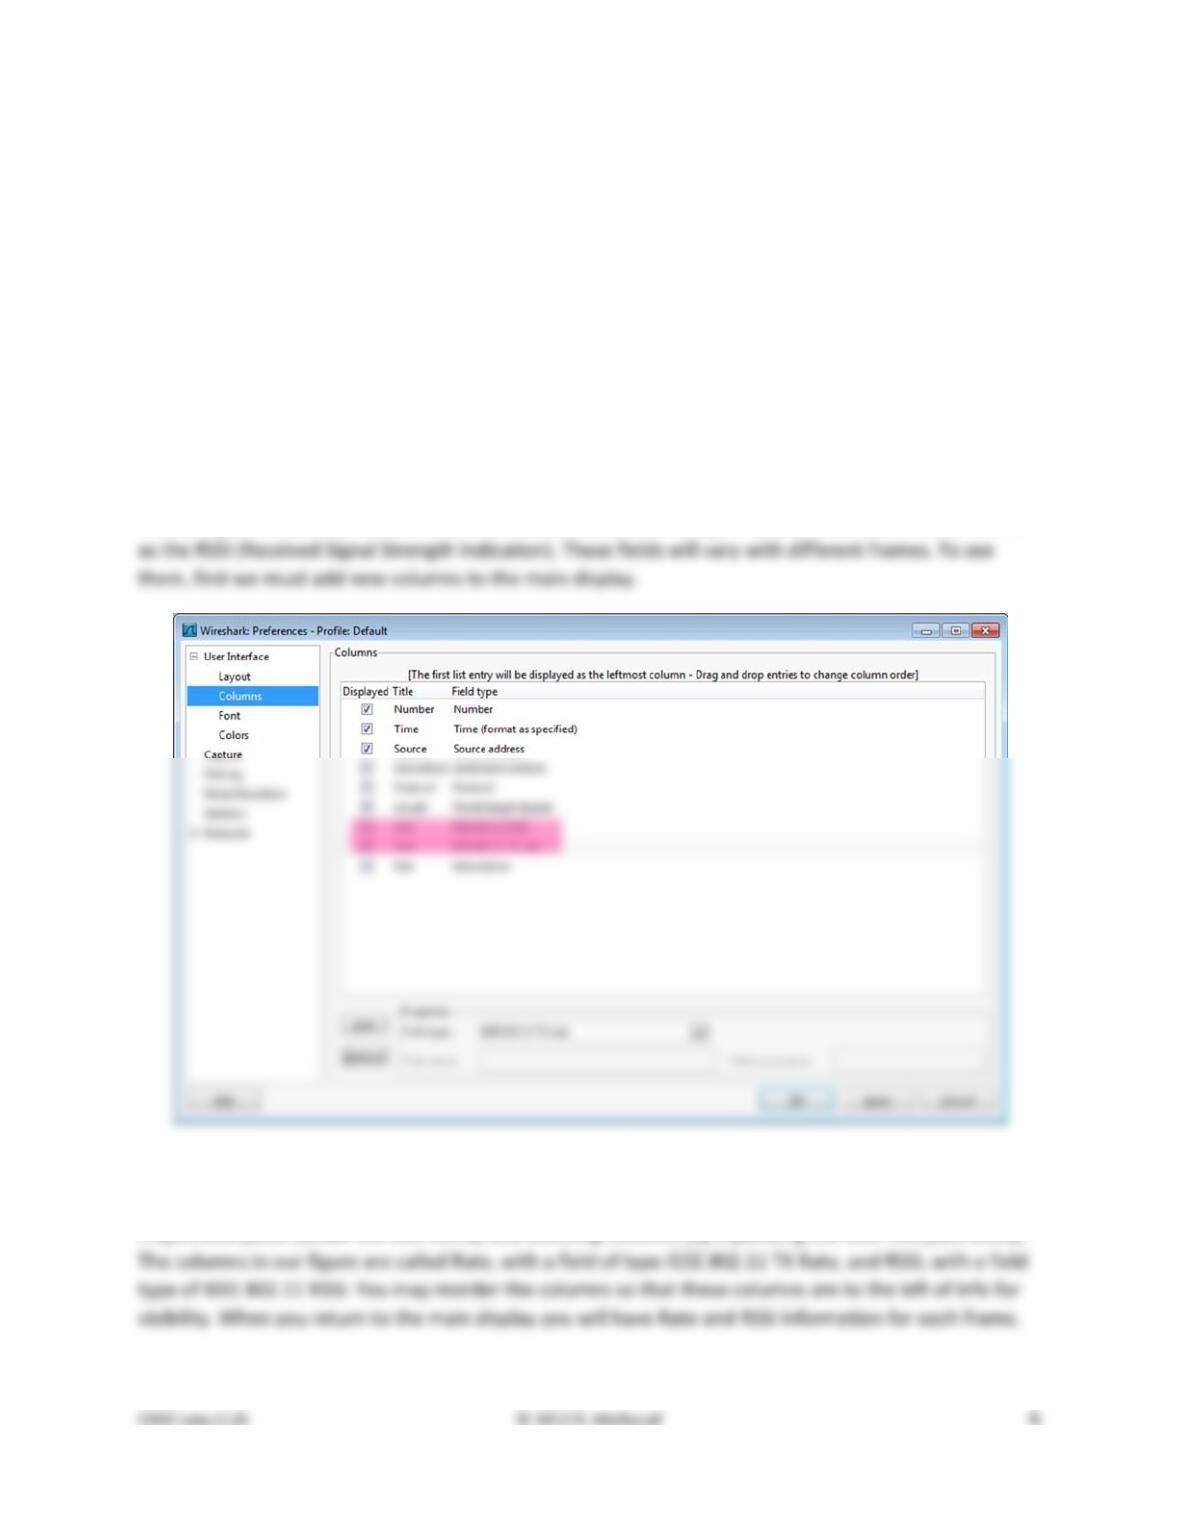
To look at the modulation we can observe the Data Rate value, and to look at the SNR we can observe
the SSI Signal value (combined with the SSI Noise value). The SSI Signal value is more commonly known
Figure 2: Adding columns for RSSI and Rate
Add two new display columns for the TX Rate (or Data Rate) and RSSI (or SSI Signal value) by going to the
Preferences panel (under the Edit menu) and selecting Columns (by expanding the User Interface block).
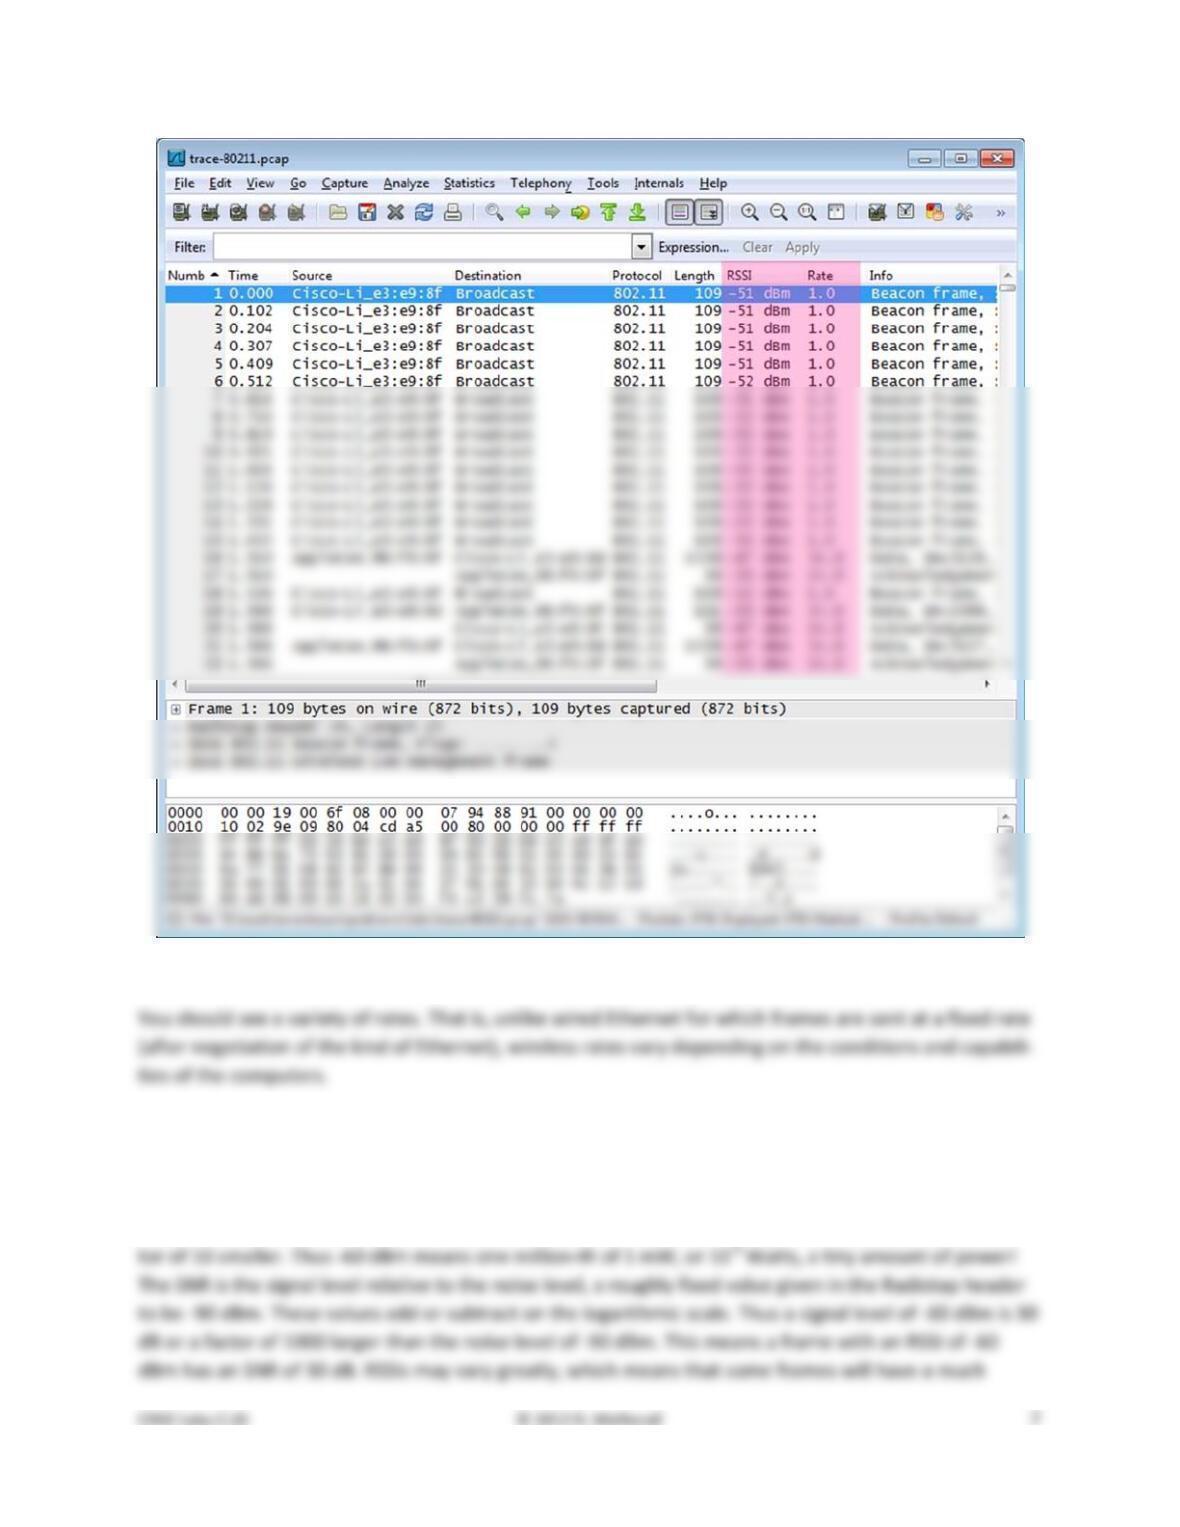
Figure 3: Wireless trace showing Rate and RSSI for each frame
2. What rates are used? Give an ordered list of rates from lowest to highest. Hint: you can click the
Rate column to sort by that value.
You should also see a variety of RSSI values, such as “–60 dBm”. RSSI is measured on a log scale in which
0 dBm means 1 milliWatt of power and each +10 means a factor of 10 larger and each –10 means a fac-
3. What is the range of RSSI and hence variation in SNRs in the trace? Give this as the strongest and
weakest RSSI and the dB difference between them.
Step 4: 802.11 Link Layer
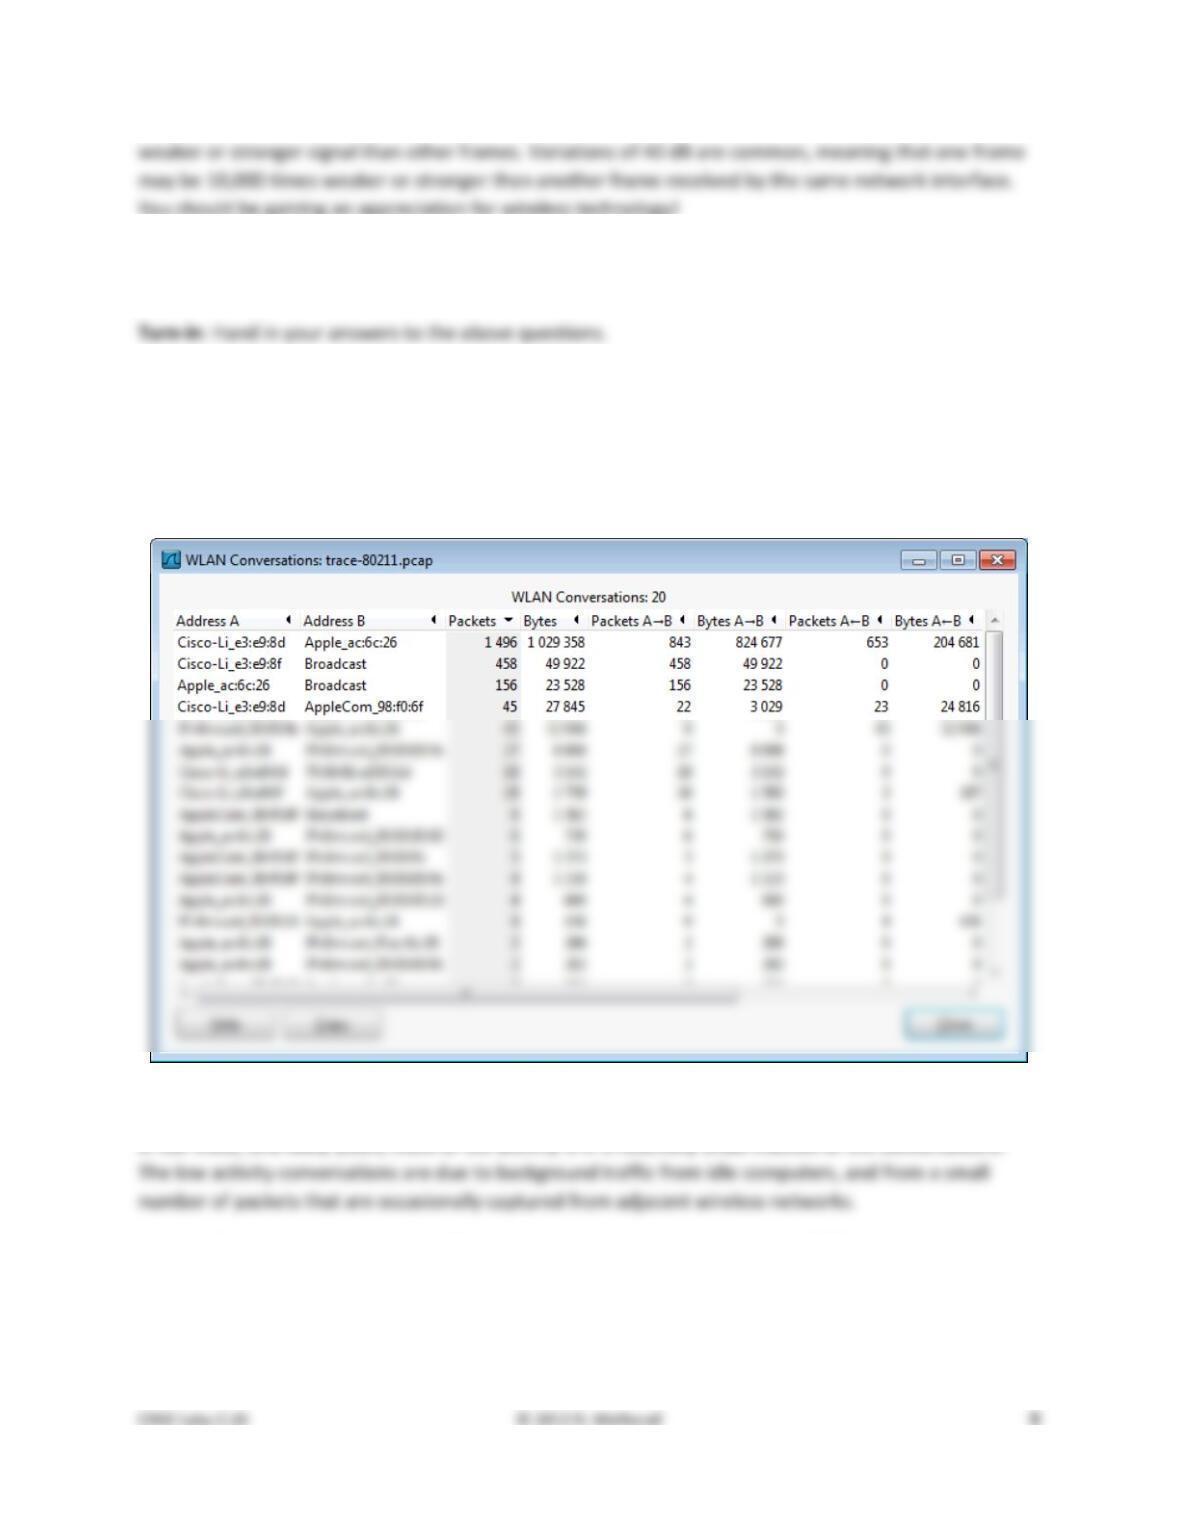
Under the Statistics menu, select Conversations and WLAN (for wireless LAN, i.e., 802.11). This will pull
up a window like that of the figure below which lists each pair of communicating computers. You can
sort this list by size by clicking on the Packets or Bytes column headings. This view will help us further
explore the trace, starting with a summary of the link layer activity.
Figure 4: 802.11 conversations ordered by size
In our trace, and likely yours, most of the activity is in a relatively small fraction of the conversations.
Answer the numbered questions in this step to explore the link layer aspects of 802.11:
1. What is the BSS ID used by the most active wireless conversations? A BSS ID value identifies an
AP, so this BSS ID identifies the most active AP, presumably the AP we are monitoring. To help
find it, you can sort on the source or destination address by clicking on the column heading.
We can also look to see the amounts we have of different types of traffic. 802.11 frames are either Data,
Control, or Management frames. These frames are distinguished by the value in the Type subfield of the
Frame Control field. You can inspect different packets to see the values for different types of frames.
Filter to see only Data frames by entering the expression “wlan.fc.type==2” into the Filter box
above the list of frames in the top panel. Clicking on the Type subfield tells us in the status display at bot-
2. How many Data frames are in the trace, and what is the most common subtype of Data frame?
3. How many Control frames are in the trace, and what is the most common subtype?
4. How many Management frames are in the trace, and what is the most common subtype?
As you look at these different types of frames, note their lengths. Data frames may be long, up to 1500
bytes, while Management frames are typically much shorter, and Control frames are very short. You
5. List in the order they are sent the IEEE 802.11 fields in an Acknowledgement frame and their
lengths in bytes. Do not break down the Frame Control field into subfields, as we have already
looked at these details.
We will investigate Management frames in the next step. To conclude our look at the link layer, let us
consider reliability and features such as power management. We expect that wireless transmissions are
6. Give an estimate of the retransmission rate as the number of retransmissions over the number of
original transmissions. Show your calculation.
Finally, we will look at power management. Increasingly, 802.11 client devices use power management
7. What fraction of the frames sent to the AP signal that the client is powering down?
Step 5: 802.11 Management
As well as the Data and Acknowledgment frames, we will look at several types of Management frames
that are used to connect a computer to an AP so that it may send and receive messages.
Beacon Frames
Select a Beacon frame in your trace whose BSS ID is that of the main AP from Step 4. Beacon frames are
sent out periodically by an AP to advertise its existence and capabilities to nearby computers. The IEEE
802.11 record for this frame will be similar to the record for a Data frame that we reviewed above, with
different type and subtype codes to indicate that it is a Beacon frame. However, the payload of this
frame will differ: it is an IEEE 802.11 wireless LAN management frame record. You will see that after
some fixed parameters it has a series of tagged parameters that list the capabilities of the AP. These in-
clude the SSID name of the AP (a text string to go with the BSS ID), the data rates it supports, and the
channel on which it is operating.
Expand the payload of the Beacon frames to view its parameters and answer these questions:
1. What is the SSID of the main AP? This is one of the tagged parameters in the Beacon frame.
2. How often are Beacon frames sent for the main AP? You may find the Beacon interval given in
Association
Once a computer has learned of an AP via a Beacon or otherwise, it must associate with the AP and pos-
sibly authenticate itself before it can use the wireless network. You will see the computer send the Asso-
ciation Request to the AP until it is acknowledged. If association is successful then the AP will return an
Association Response, which the computer will acknowledge. After the usual IEEE 802.11 header fields,
the Association Request and Response carry information that describes the capabilities of the AP and
computer, such as what rates it supports. In this way, both endpoints can know the other’s abilities.
Find and examine an Association Request and Association Response frame to answer this question:
5. What are the Type and Subtype values of Association Request / Association Response frames?
You may also see Authentication Request and Authentication Response frames before the association.
Probe Request/Response
Finally, we will look briefly at Probe frames. Instead of a computer waiting to learn about an AP from
Beacons, a computer may probe for specific APs. A Probe Request is sent by a computer to test whether
an AP with a specific SSID is nearby. If the sought after AP is nearby then it will reply with a Probe Re-
sponse. Like Beacon and Association frames, each of these frames has the usual header and carries a list
of parameters describing the capabilities of the computer and AP. It is common for computers to send
Probe Requests for wireless networks that they have previously used to speed up connection to a
known network, e.g., when a laptop has returned home for the day. Thus you may see a sequence of
probes for many different SSIDs. Only the SSIDs that are present will reply.
Find and examine a Probe Request and Probe Response frame to answer this question:
6. What are the Type and Subtype values for the Probe Request / Probe Response frames?
Explore on your own
We encourage you to explore 802.11 on your own once you have completed this lab. We have covered
the basics of many topics, each of which you can delve into more deeply. Some ideas:
• Look to see how a given client uses different rates over time. This is called rate adaptation.
• See which clients are using power management and if you can understand their sleep behavior.
Solutions – 802.11
The solutions below are based on our capture and use of tools. Your answers will differ in the details if
Step 3: 802.11 Physical Layer
Answers to the questions:
1. The Channel frequency is 2462 MHz, or 2.462 GHz. It is known as “802.11b/g channel 11”.
2. The rates are 1, 6, 12, 18, 24, 38, 48, and 54 Mbps. This is most of the possible 802.11b/g rates.
Step 4: 802.11 Link Layer
Answers to the questions:
2. There are 1783 Data frames, or 48% of the total (3731) frames. The most common Data frame is
3. There are 1391 Control frames or 37% of the total. The most common Control frame is the
4. There are 557 Management frames or 15% of the total. The most common Management frame
6. There are 1430 original Data frames and 353 retransmission Data frames. Our estimate of the
Step 5: 802.11 Management
Beacon frames:
2. Beacon frames are sent by the “djw” AP every 102.4 milliseconds, or a rate of roughly
3. The AP supports 1, 2, 5.5, 6, 9, 11, 12, 18, 24, 36, 48, and 54 Mbps. The rates are given in two
4. The Beacon frames for this AP are all transmitted at a rate of 1 Mbps. This is typical. A low rate
Association frames:
Probe frames:
[END]