Lab Exercise – HTTP
Objective
HTTP (HyperText Transfer Protocol) is the main protocol underlying the Web. HTTP is covered in §7.2.4
of your text. Review that section before doing this lab.
Requirements
Wireshark: This lab uses Wireshark to capture or examine a packet trace. A packet trace is a record of
traffic at some location on the network, as if a snapshot was taken of all the bits that passed across a
particular wire. The packet trace records a timestamp for each packet, along with the bits that make up
the packet, from the low–layer headers to the higher–layer contents. Wireshark runs on most operating
systems, including Windows, Mac and Linux. It provides a graphical UI that shows the sequence of pack-
telnet: This lab uses telnet to set up an interactive two–way connection to a remote computer. telnet is
installed on Window, Linux and Mac operating systems. It may need to be enabled under Windows. Se-
lect “Control Panel” and “More Settings” (Windows 8) or “Programs and Features” (Windows 7), then
Browser: This lab uses a web browser to find or fetch pages as a workload. Any web browser will do.
Step 1: Manual GET with Telnet
Use your browser to find a reasonably simple web page with a short URL, making sure it is a plain HTTP
URL with no special port number. Since HTTP is a text–based application protocol, we can see how it
works by entering our own HTTP requests and inspecting the HTTP responses. To do this you will use
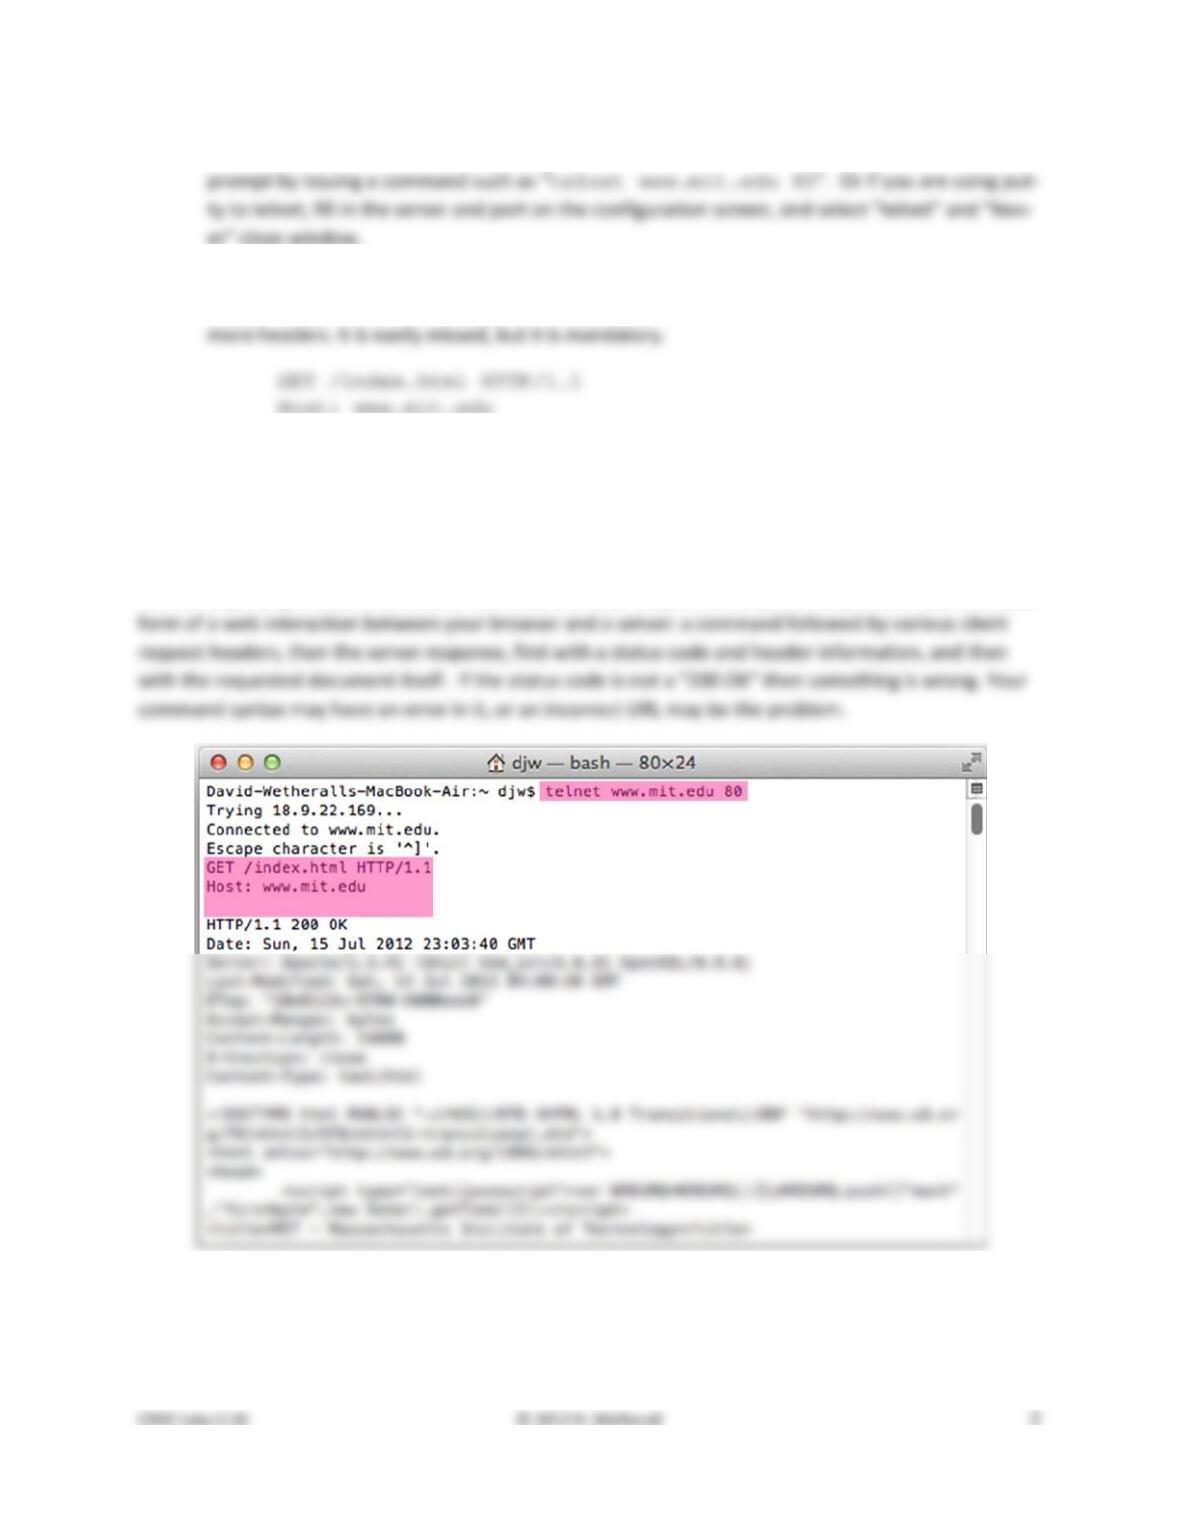
1. Run telnet and connect to server on port 80. You can do this from a terminal or command
2. Once you are connected, issue an HTTP GET command by typing the three lines below. The first
two lines identify the path and server. The last line is a blank line, to tell the server there are no
3. Observe the response that comes back. If the connection does not close by itself, you may close
it by typing the telnet escape character of “control–]” and then typing the command “q” for quit.
Congratulations, you have issued your own GET and seen the inner workings of the web! Our interaction
is shown in the figure below, with the parts that we typed highlighted. You may need to scroll back up to
see the beginning of your interaction. The details of your output will vary, but they should take the basic
Figure 1: Performing an HTTP GET with telnet

1. What version of HTTP is the server running?
2. How is the beginning of the content sent by the server recognized by the client?
3. How does the client know what type of content is returned?
Step 2: Capture a Trace
Capture a trace of your browser making HTTP requests as follows; alternatively, you may use a supplied
trace. Now that we seen how a GET works, we will observe your browser as it makes HTTP requests.
Browser behavior can be quite complex, using more HTTP features than the basic exchange, so we will
set up a simple scenario. We are assuming that your browser will use HTTP in this simple scenario rather
than newer Web protocols such as SPDY, and if this is not the case you will need to disable SPDY.
1. Use your browser to find two URLs with which to experiment, both of which are HTTP (not
HTTPS) URLs with no special port. The first URL should be that of a small to medium–sized image,
2. Prepare your browser by reducing HTTP activity and clearing the cache. Apart from one fresh
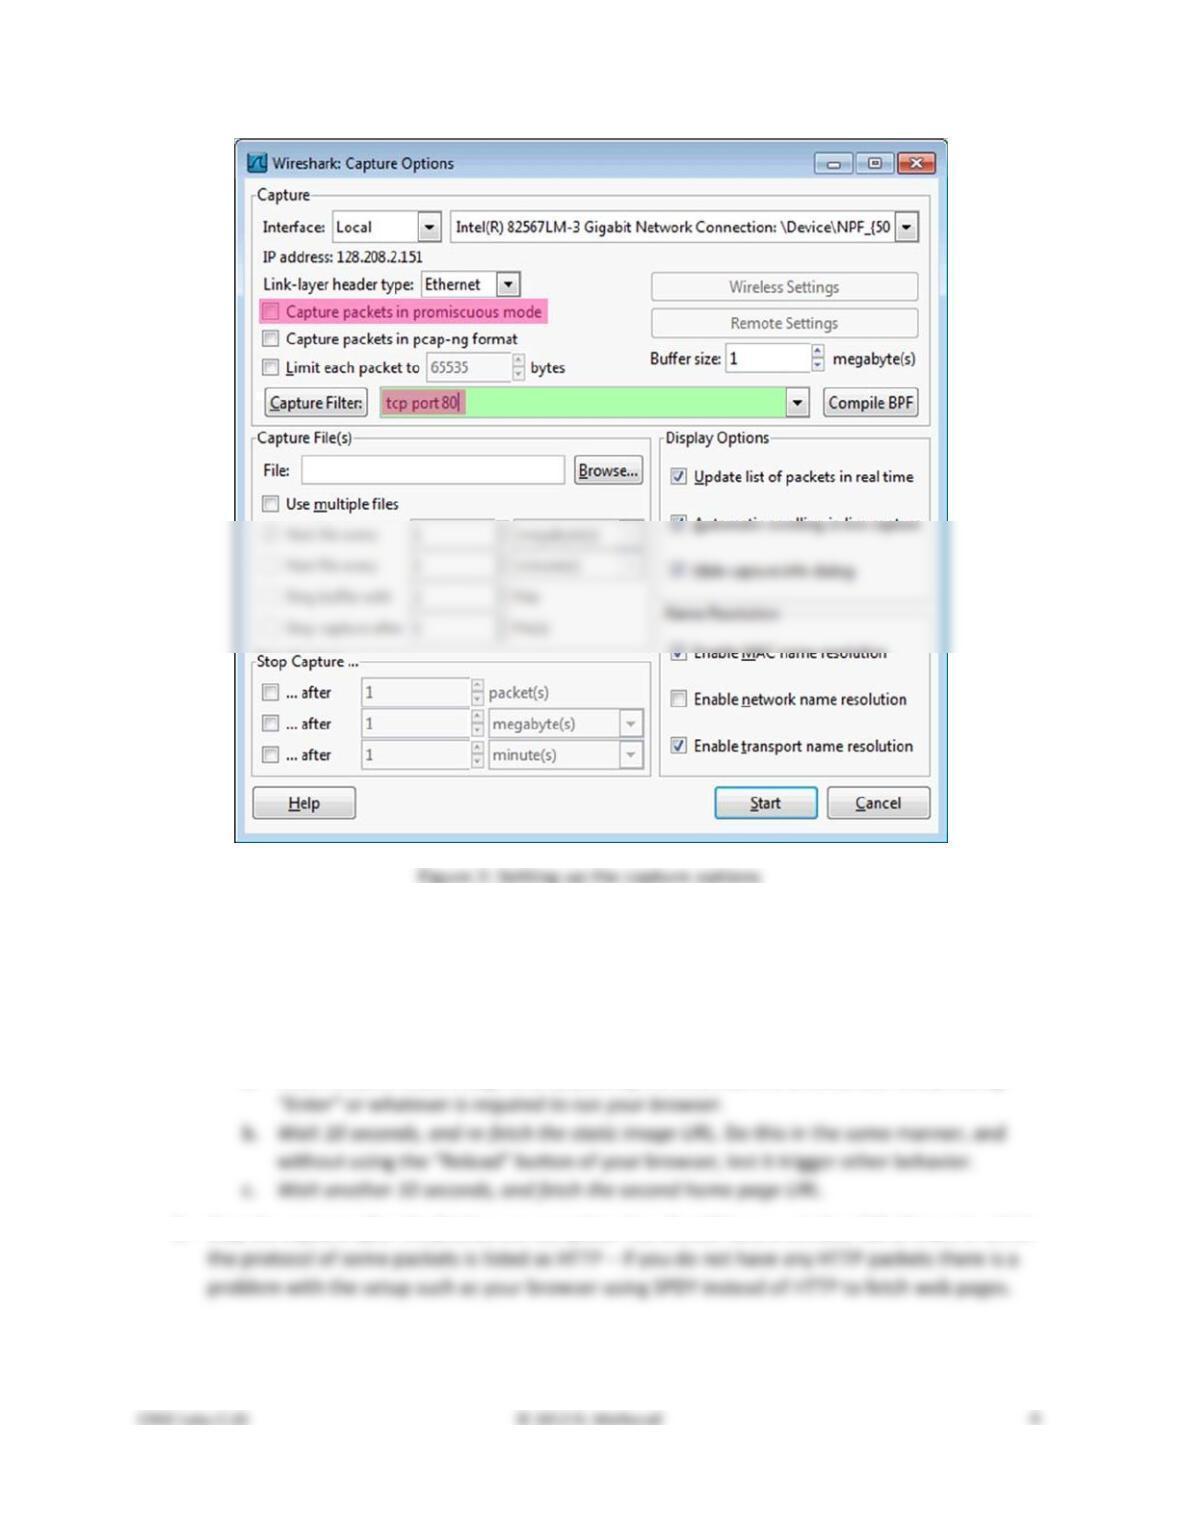
3. Launch Wireshark and start a capture with a filter of “tcp port 80”. We use this filter be-
cause there is no shorthand for HTTP, but HTTP is normally carried on TCP port 80. Your capture
window should be similar to the one pictured below, other than our highlighting. Select the in-
terface from which to capture as the main wired or wireless interface used by your computer to
4. Fetch the following sequence of URLs, after you wait for a moment to check that there is no
HTTP traffic. If there is HTTP traffic then you need to find and close the application that is caus-
ing it. Otherwise your trace will have too much HTTP traffic for you to understand. You will paste
each URL into the browser URL bar and press Enter to fetch it. Do not type the URL, as this may
cause the browser to generate additional HTTP requests as it tries to auto–complete your typing.
a. Fetch the first static image URL by pasting the URL into the browser bar and pressing
5. Stop the capture after the fetches are complete. You should have a window full of trace in which
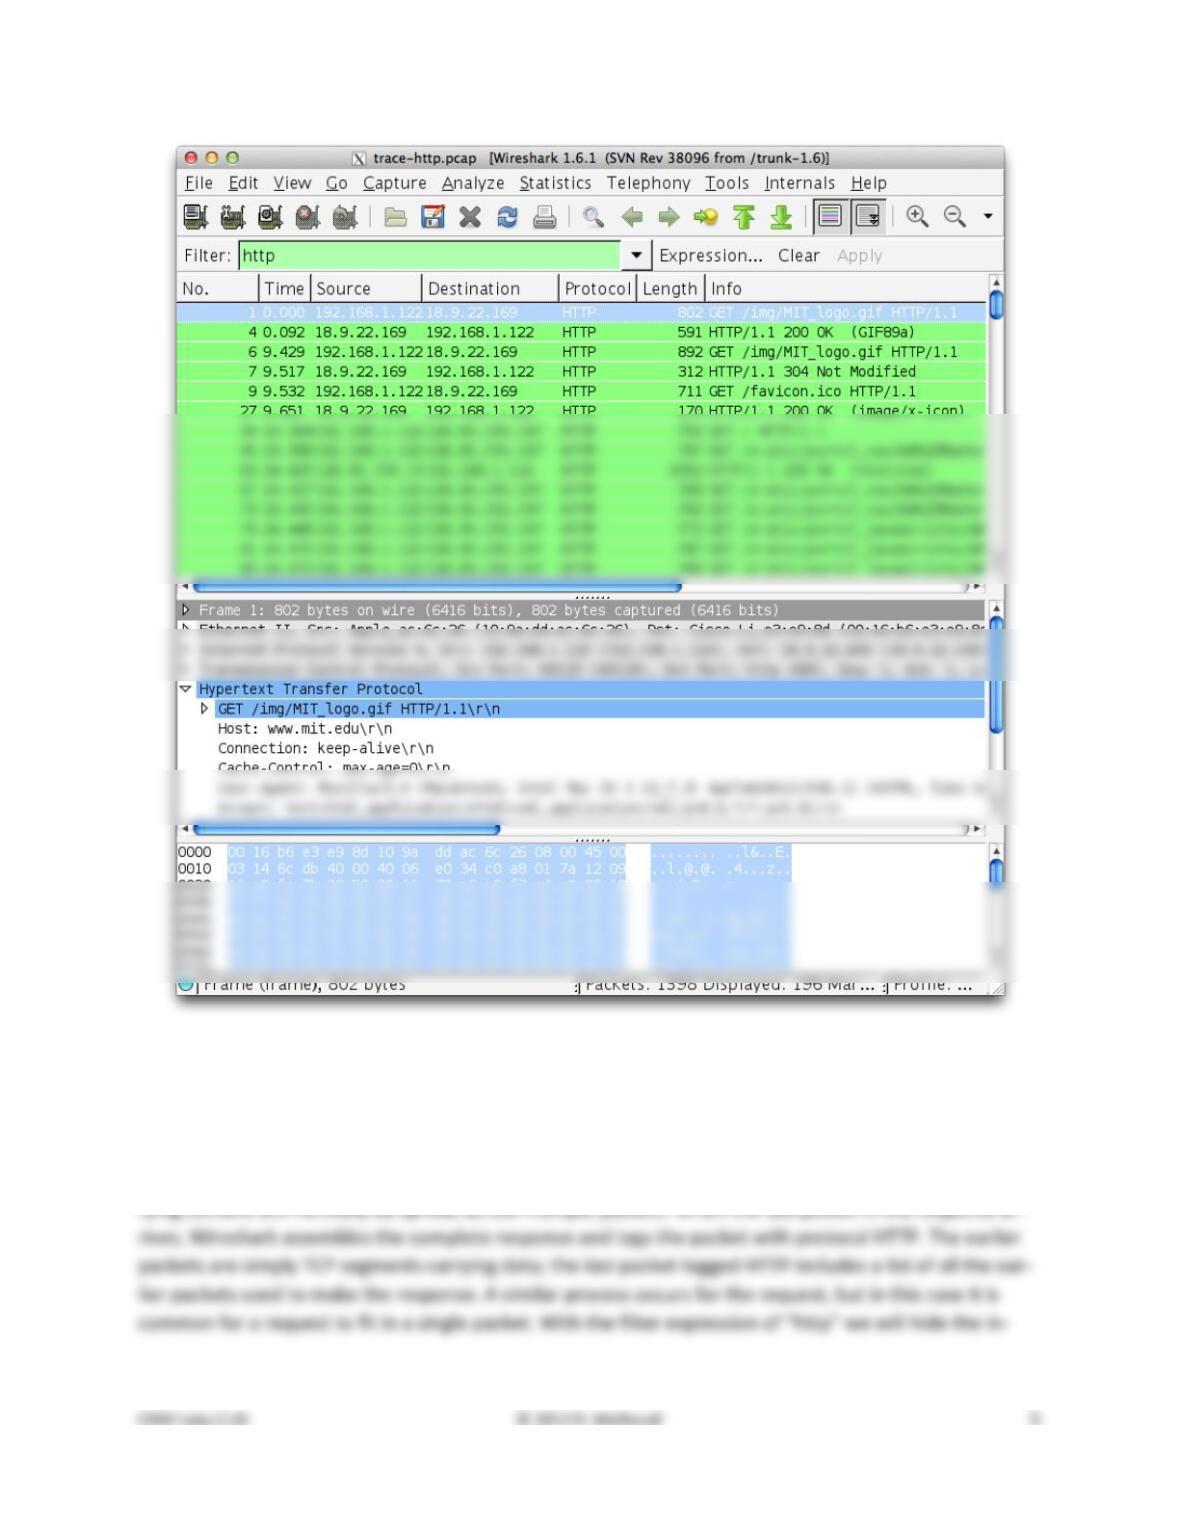
Figure 3: Trace of HTTP traffic showing the details of the HTTP header
Step 3: Inspect the Trace
To focus on HTTP traffic, enter and apply a filter expression of “http”. This filter will show HTTP re-
quests and responses, but not the individual packets that are involved. Recall that an HTTP response car-
Select the first GET in the trace, and expand its HTTP block. This will let us inspect the details of an HTTP
request. Observe that the HTTP header follows the TCP and IP headers, as HTTP is an application proto-
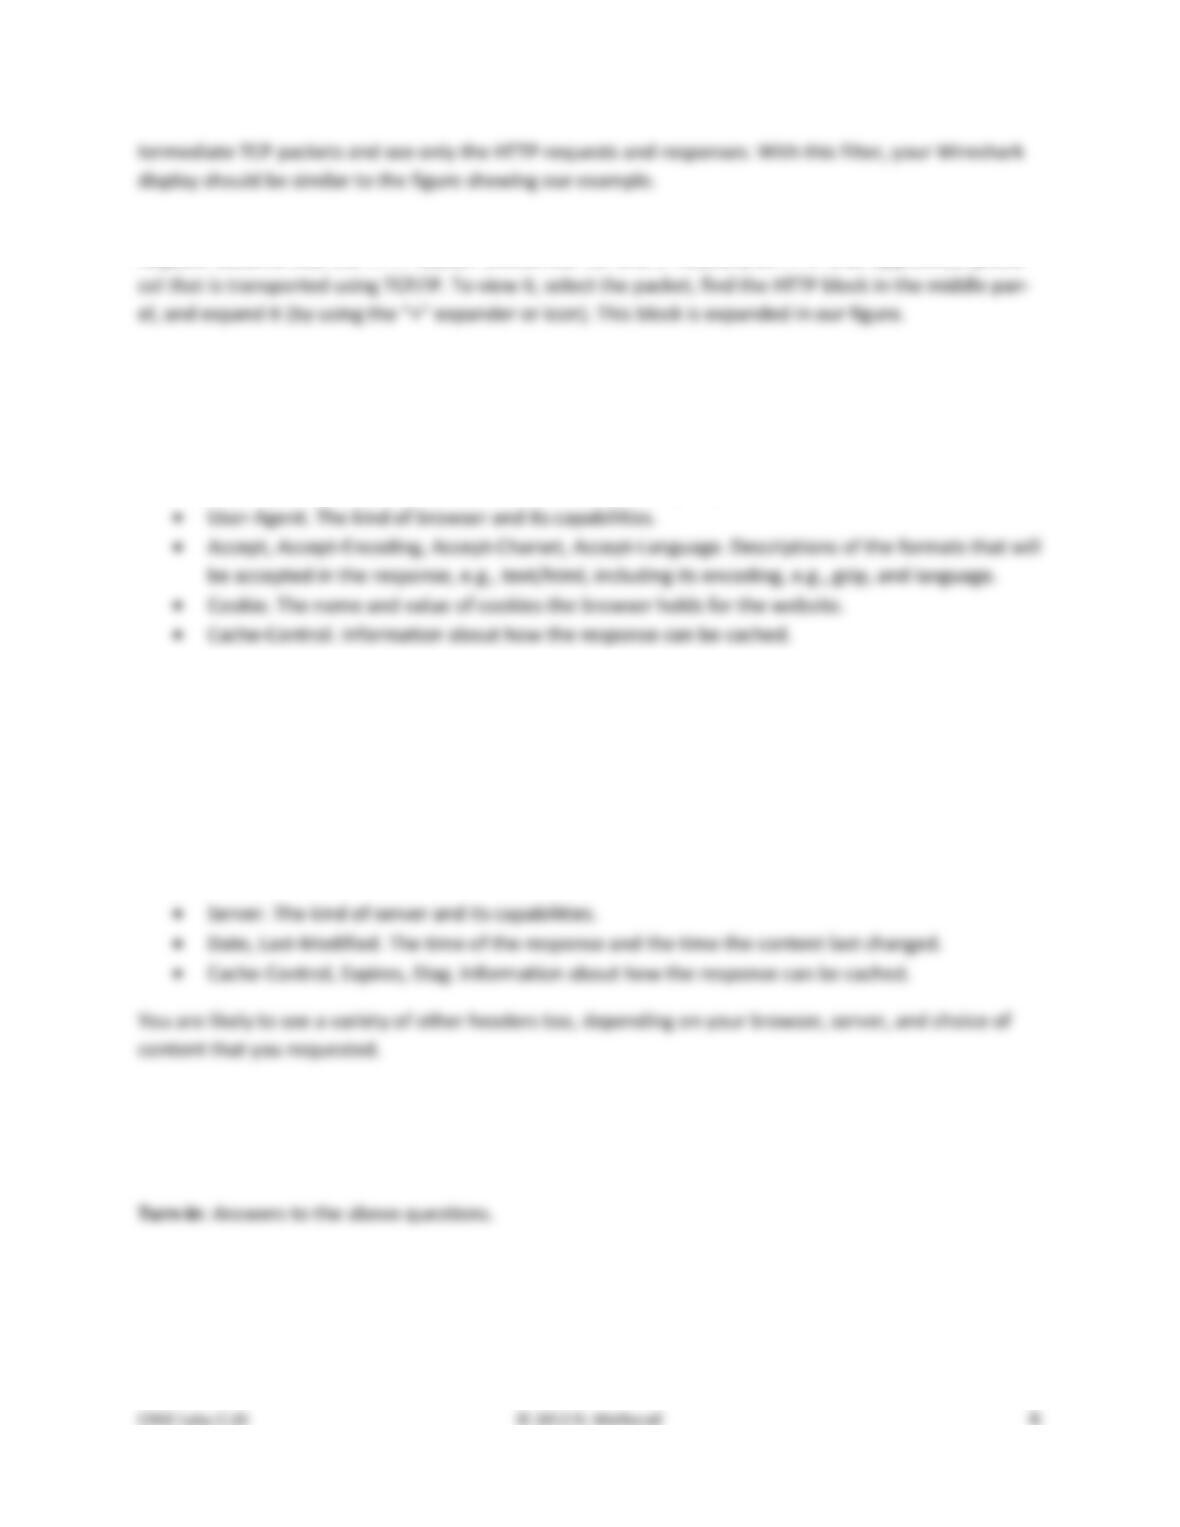
Explore the headers that are sent along with the request. First, you will see the GET method at the start
of the request, including details such as the path. Then you will see a series of headers in the form of
tagged parameters. There may be many headers, and the choice of headers and their values vary from
browser to browser. See if you have any of these common headers:
• Host. A mandatory header, it identifies the name (and port) of the server.
The request information is sent in a simple text and line–based format. If you look in the bottom panel
you can read much of the request directly from the packet itself!
Select the response that corresponds to the first GET in the trace, and expand its HTTP block. The Info for
this packet will indicate “200 OK” in the case of a normal, successful transfer. You will see that the re-
sponse is similar to the request, with a series of headers that follow the “200 OK” status code. However,
different headers will be used, and the headers will be followed by the requested content. See if you
have any of these common headers:
Answer the following questions:
1. What is the format of a header line? Give a simple description that fits the headers you see.
2. What headers are used to indicate the kind and length of content that is returned in a response?
Step 4: Content Caching
The second fetch in the trace should be a re–fetch of the first URL. This fetch presents an opportunity for
us to look at caching in action, since it is highly likely that the image or document has not changed and
therefore does not need to be downloaded again. HTTP caching mechanisms should identify this oppor-
tunity. We will now see how they work.
Select the GET that is a re–fetch of the first GET, and expand its HTTP block. Likely, this will be the second
GET in the trace. However, look carefully because your browser may issue other HTTP requests for its
own reasons. For example, you might see a GET for /favicon.ico in the trace. This is the browser request-
Now find the header that will let the server work out whether it needs to send fresh content. We will ask
you about this header shortly. The server will need to send fresh content only if the content has
changed since the browser last downloaded it. To work this out, the browser includes a timestamp tak-
Answer the following questions:
1. What is the name of the header the browser sends to let the server work out whether to send
fresh content?
Step 5: Complex Pages
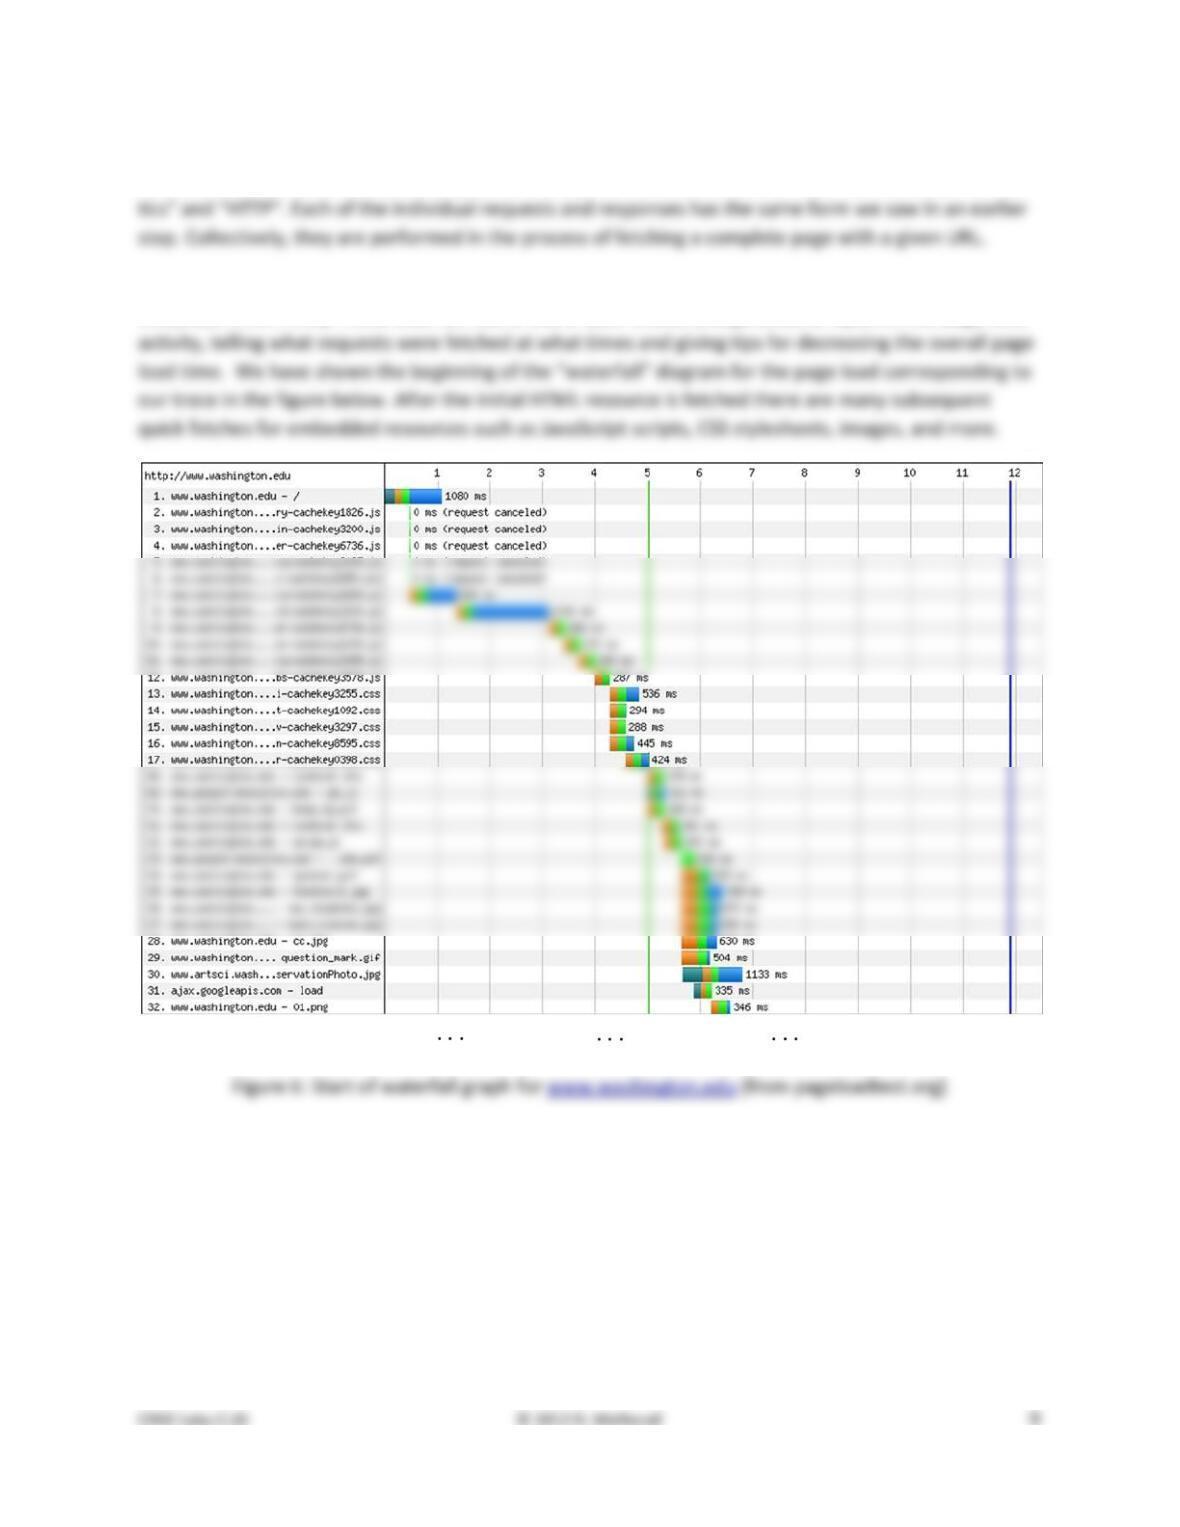
Now let’s examine the third fetch at the end of the trace. This fetch was for a more complex web page
that will likely have embedded resources. So the browser will download the initial HTML plus all of the
embedded resources needed to render the page, plus other resources that are requested during the ex-
ecution of page scripts. As we’ll see, a single page can involve many GETs!
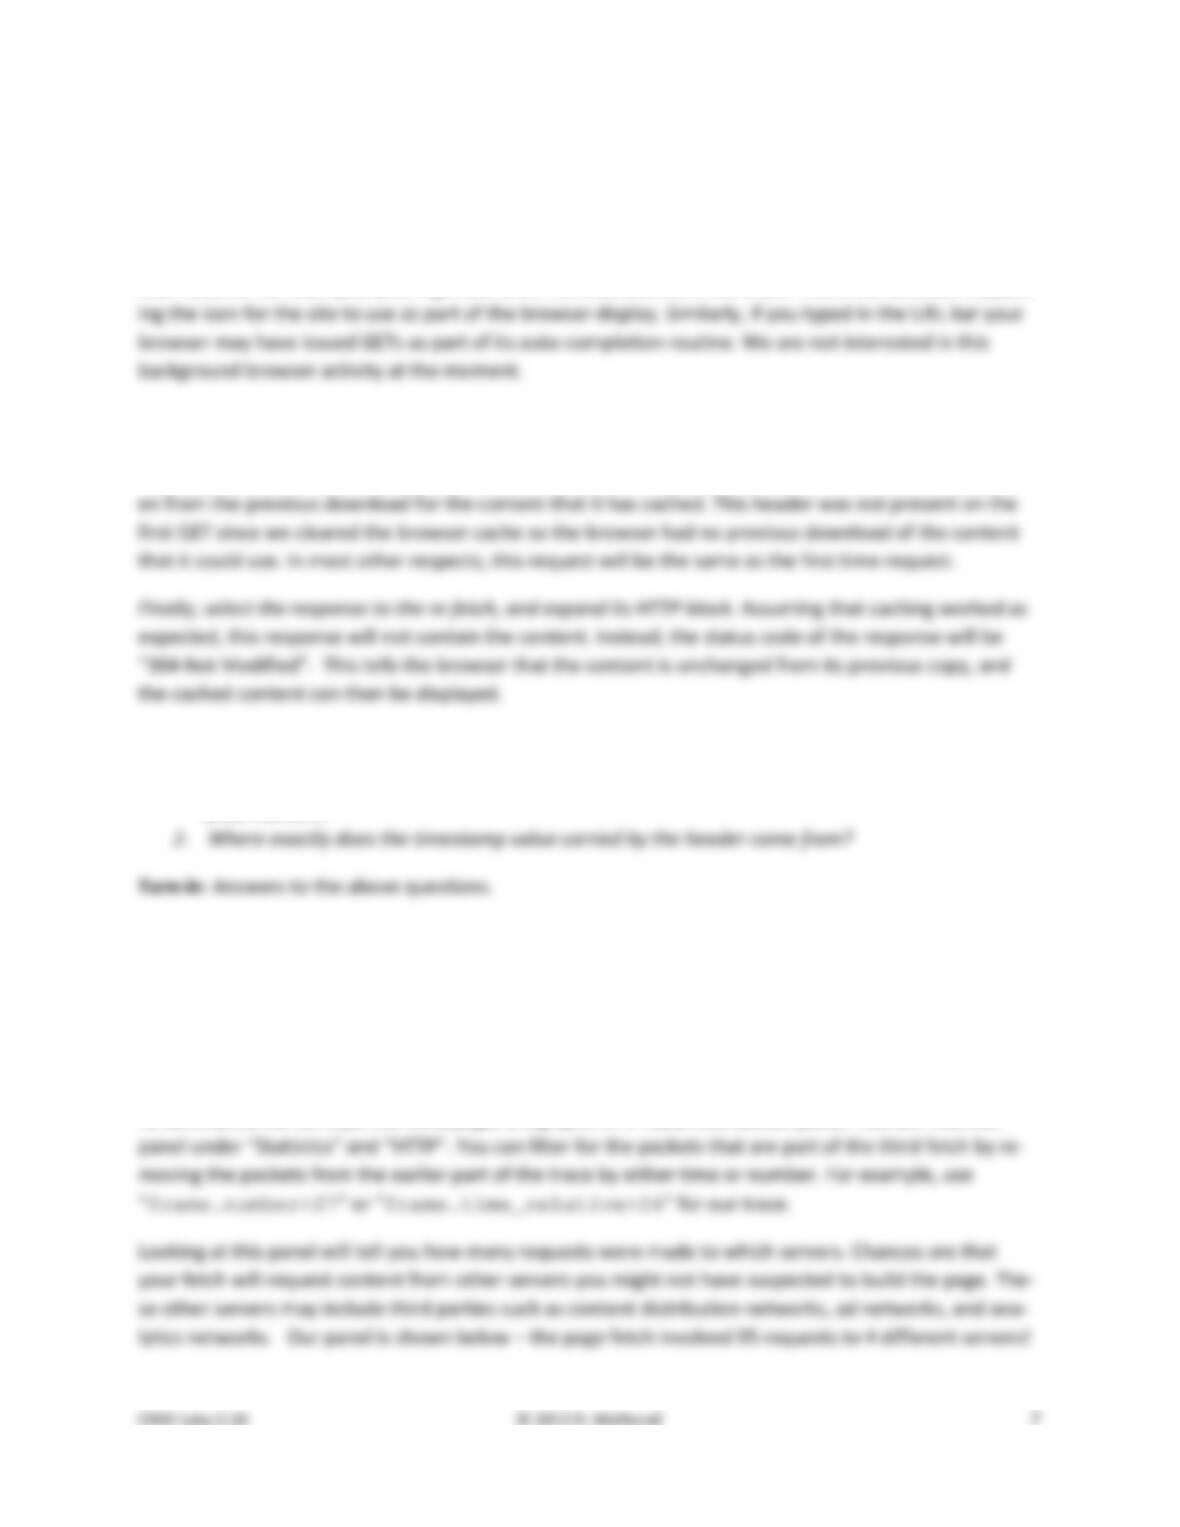
To summarize the GETs for the third page, bring up a HTTP Load Distribution panel. You will find this
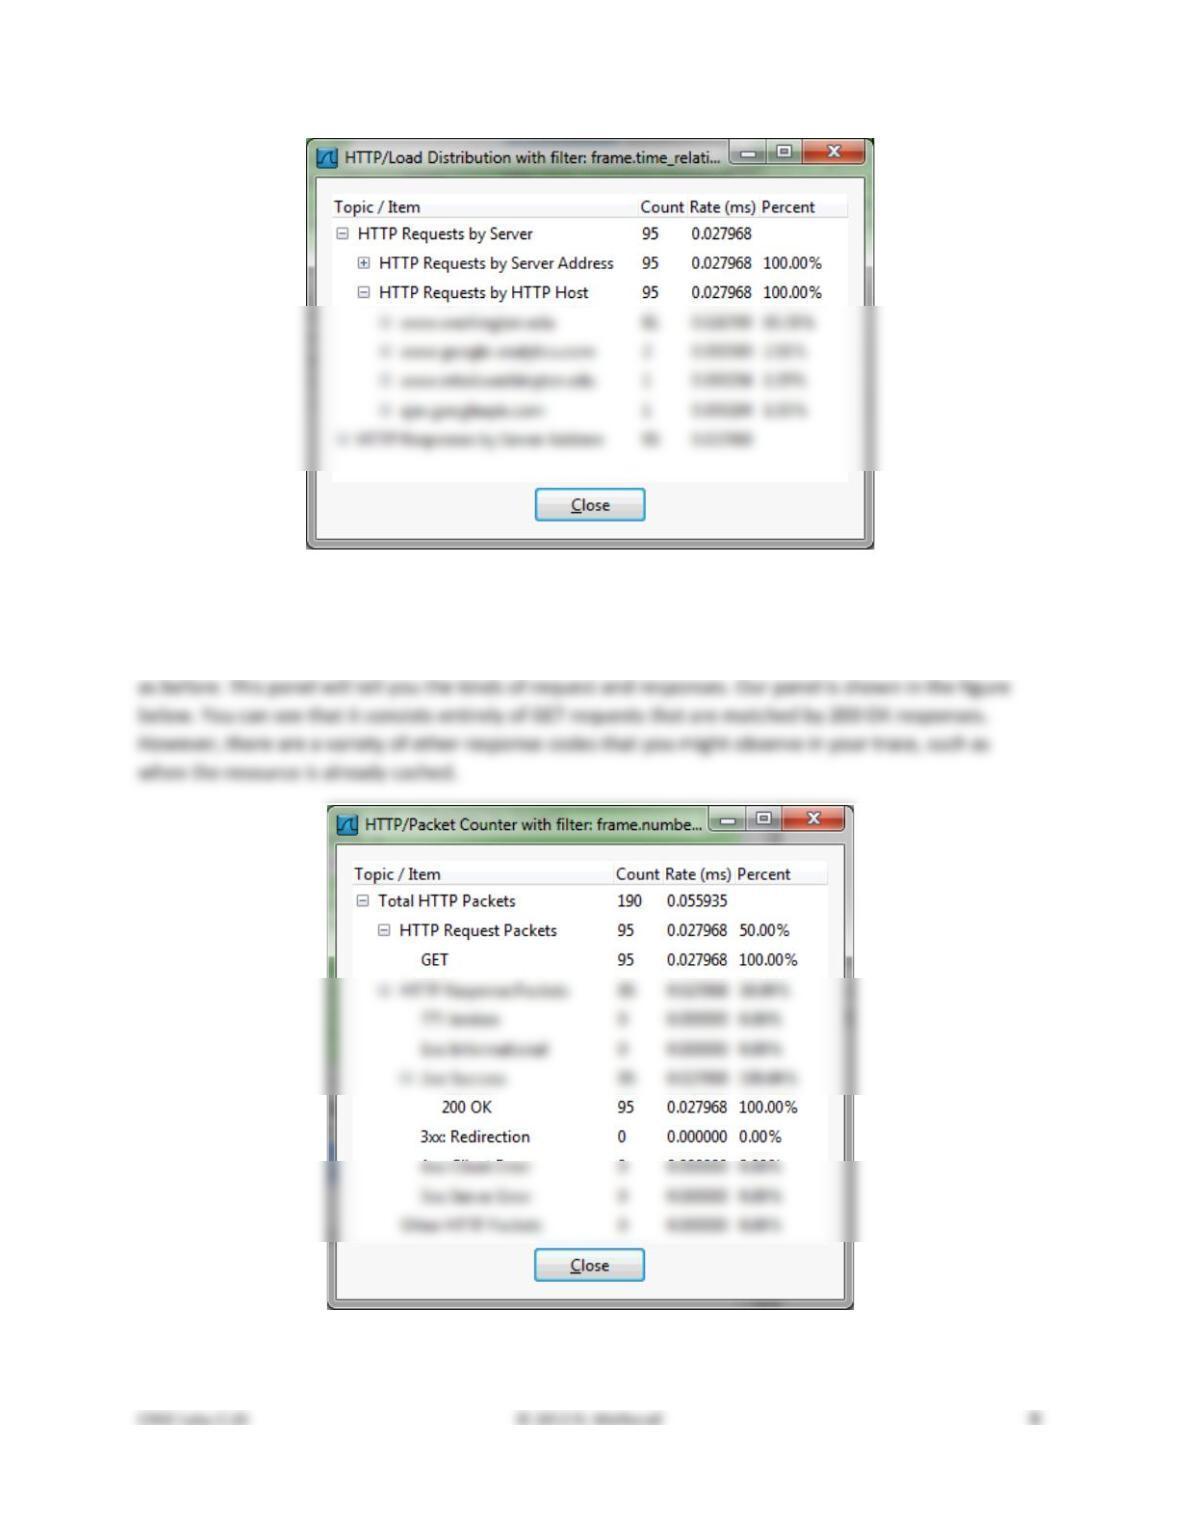
Figure 4: HTTP Load Distribution panel
For a different kind of summary of the GETs, bring up a HTTP Packet Counter panel. You will also find this
panel under “Statistics” and “HTTP”, and you should filter for the packets that are part of the third fetch
Figure 5: HTTP Packet Counter panel
You might be curious to know what content is being downloaded by all these requests. As well as seeing
the URLs in the Info column, you can get a summary of the URLs in a HTTP Request panel under “Statis-
For a more detailed look at the overall page load process, use a site such as Google’s PageSpeed or
webpagetest.org. These sites will test a URL of your choice and generate a report of the page load
There is no turn–in for this step.
Explore Your Network
We encourage you to explore HTTP on your own once you have finished this lab. Some suggestions:
• Look at how an HTTP POST works. We focused on the GET method above. POST is used to up-
load information to the server. You can study a POST by finding a simple web page with a form
and tracing the form submission. However, do not study login forms as you want to observe an
HTTP POST and not an encrypted HTTPS POST that is more typical when security is needed.
• Look at how HTTP GETs map to TCP connections once you have also done the TCP lab. With
HTTP 1.1, the browser can make one TCP connection to a server and send multiple requests. Of-
Solutions – HTTP
The solutions below are based on our capture and use of tools. Your answers will differ in the details if
they are based on your own capture and use of tools in a different network setting. Nonetheless, we ex-
pect our solutions to help you understand whether your answers are correct.
Step 1: Manual GET with Telnet
Answers to the questions:
1. HTTP 1.1, according to the start of the response. While other versions are possible, this is the
version of HTTP spoken by the vast majority of servers.
3. The response includes a Content–Type header that gives the MIME type of the content. This
Step 3: Inspect the Trace
Answers to the questions:
1. Each header line consists of the name of the header field and its value separated by a colon.
Step 4: Content Caching
Answers to the questions:
1. The header is called “If–Modified–Since”, i.e., it asks the server to send the content if it has been
modified since a given time.
2. The timestamp value comes from the “Last–Modified” header of the most recent download of