Chapter 9
The Case for International Diversification
1. The domestic and foreign assets have annualized standard deviations of return of
d = 15% and
f = 18%, respectively, with a correlation of
= 0.5. The variance (
þ) of the portfolio invested
80% in the domestic asset and 20% in the foreign asset is
2. a. For each portfolio, expected return is calculated using Equation 9.1, and portfolio standard
deviation is calculated using Equation 9.2. Expected returns and standard deviations for the
portfolios are listed in the following table.
Invested in
Asset 1
Invested in
Asset 2
Portfolio Expected
Return
Portfolio
Risk
100%
0%
10.00%
10.00%
b. The plot of the portfolios on a risk–return graph is provided here:
Chapter 9 The Case for International Diversification 49
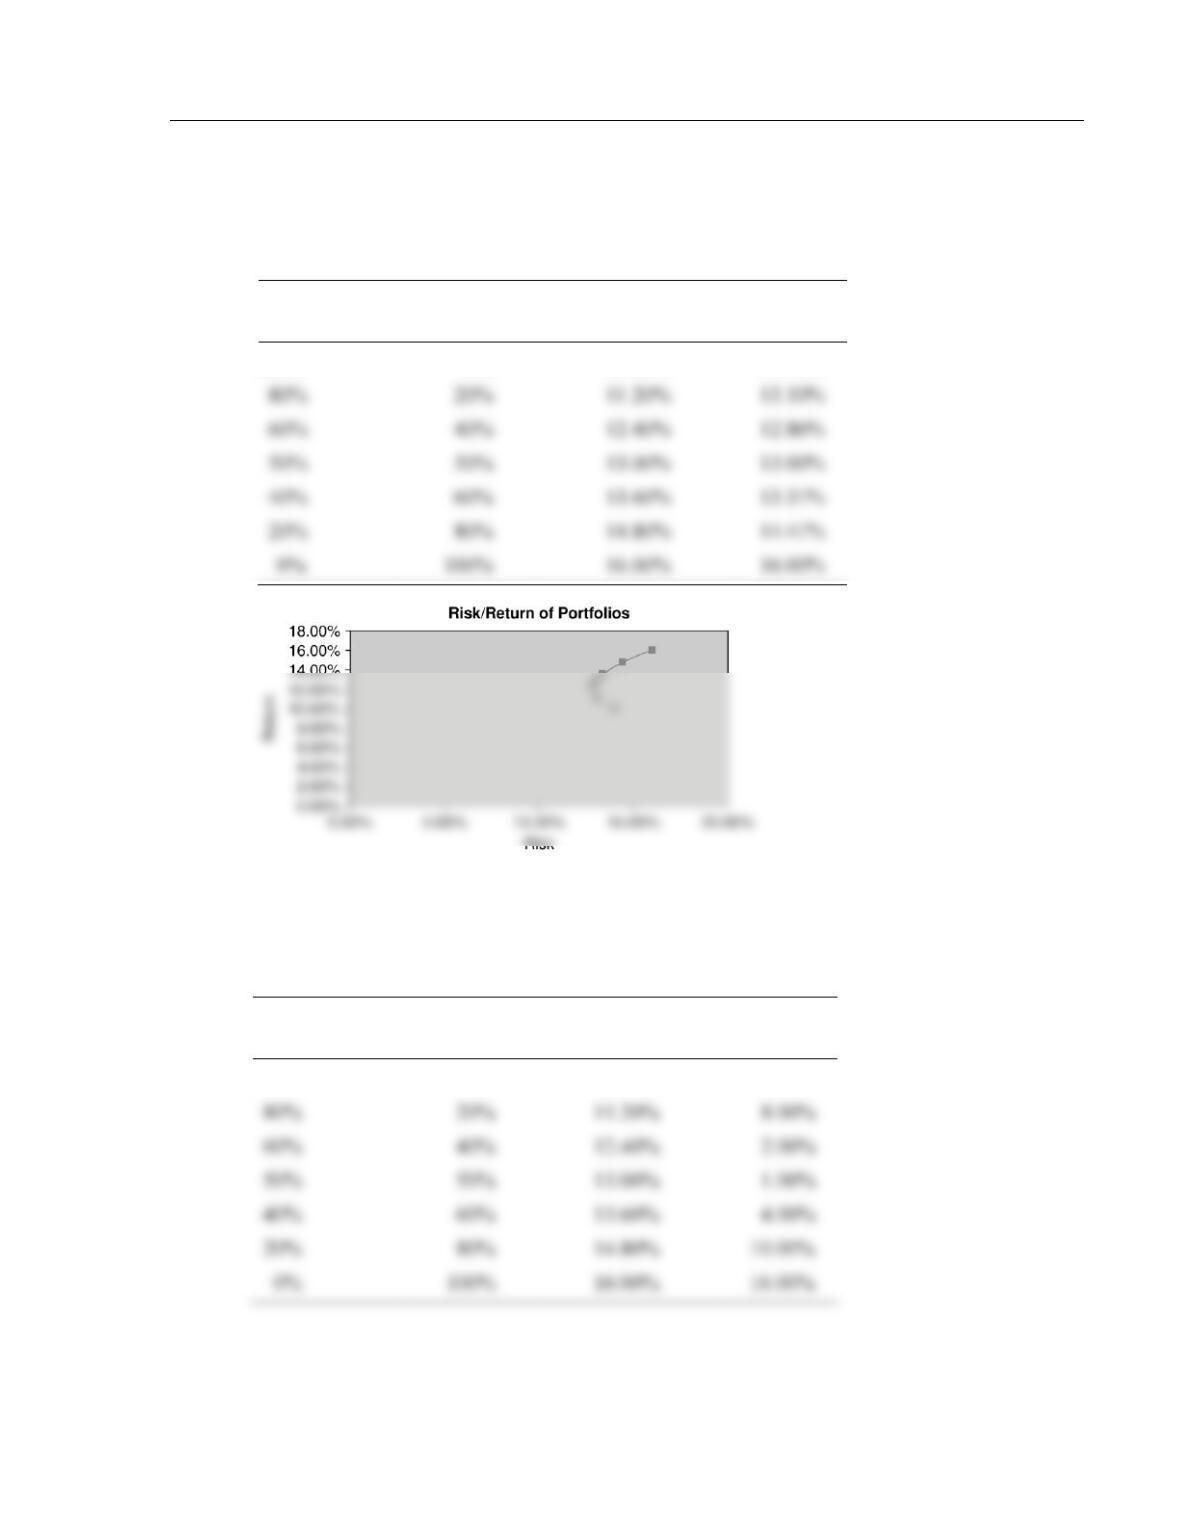
3. a. For each portfolio, expected return is calculated using Equation 9.1, and portfolio standard
deviation is calculated using Equation 9.2. Expected returns and standard deviations for the
portfolios are listed in the following table.
When
0.5:=
Invested in
Asset 1
Invested in
Asset 2
Portfolio Expected
Return
Portfolio
Risk
100%
0%
10.00%
14.00%
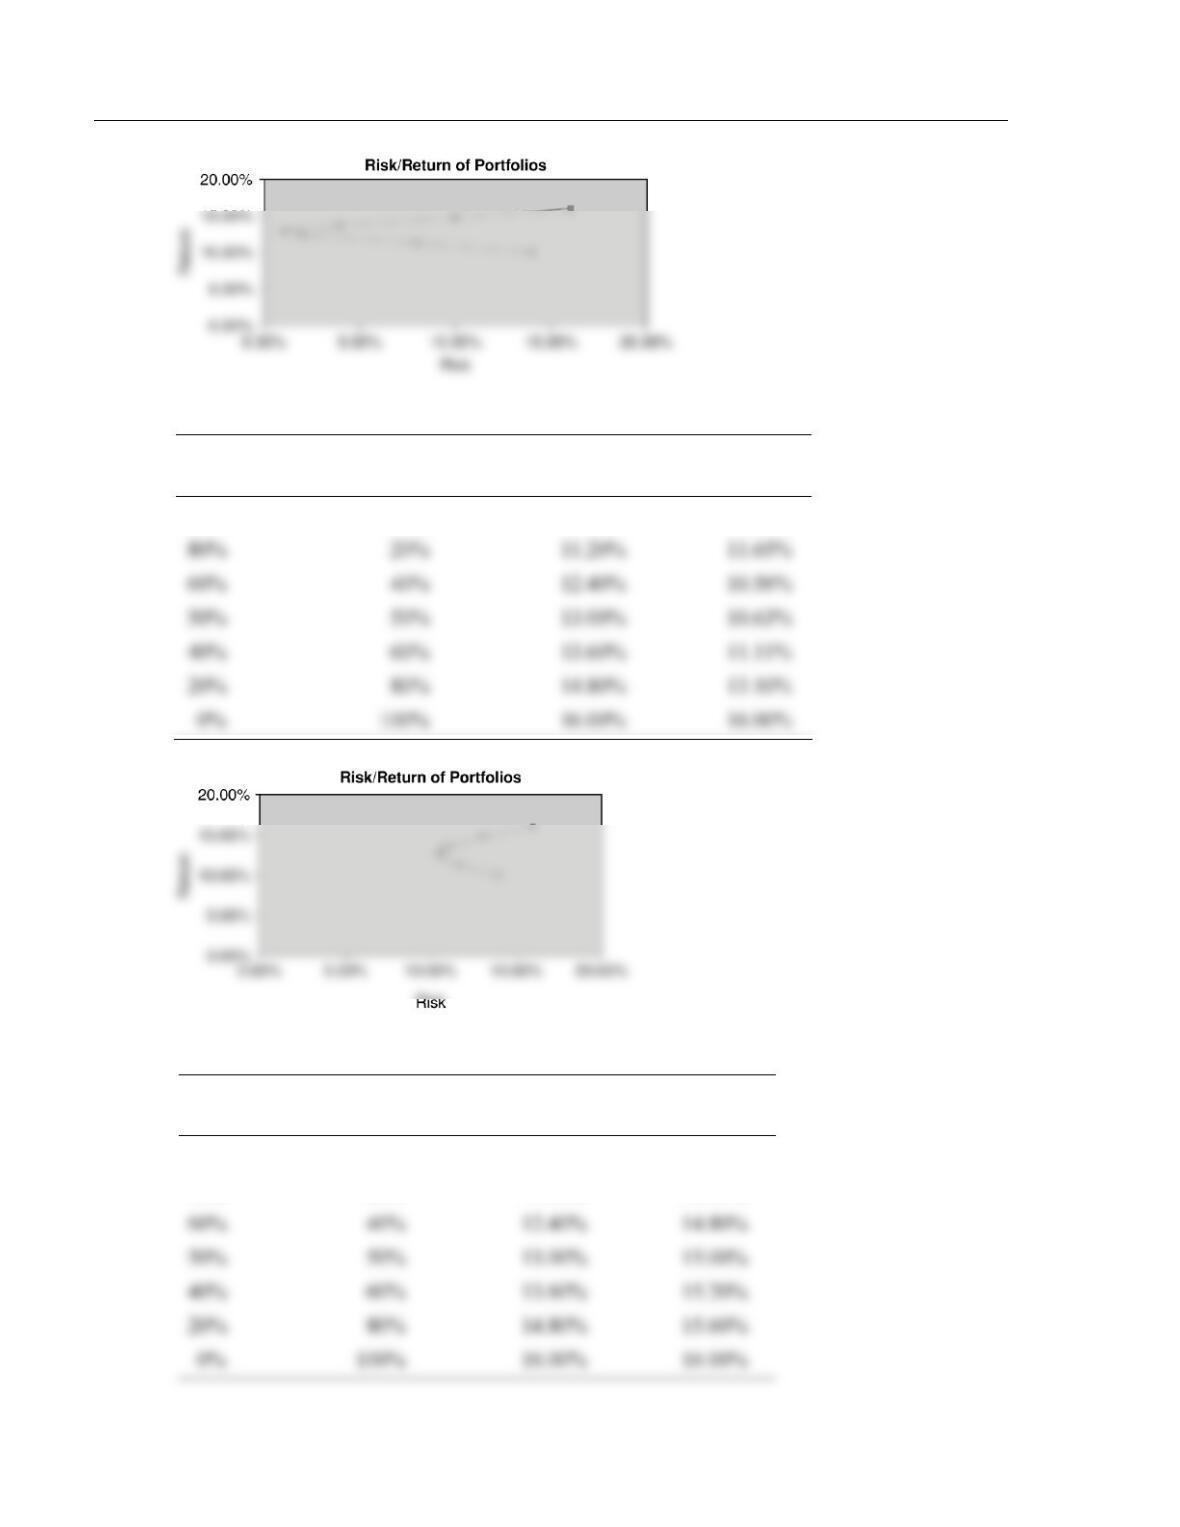
b. For each portfolio, expected return is calculated using Equation 9.1, and portfolio standard
deviation is calculated using Equation 9.2. Expected returns and standard deviations for the
portfolios are listed in the following tables for various correlations.
When
1.0:
=−
Invested in
Asset 1
Invested in
Asset 2
Portfolio Expected
Return
Portfolio
Risk
100%
0%
10.00%
14.00%
50 Solnik/McLeavey • Global Investments, Sixth Edition
When
0:=
Invested in
Asset 1
Invested in
Asset 2
Portfolio Expected
Return
Portfolio
Risk
100%
0%
10.00%
14.00%
When
1.0:=
Invested in
Asset 1
Invested in
Asset 2
Portfolio Expected
Return
Portfolio
Risk
100%
0%
10.00%
14.00%
80%
20%
11.20%
14.40%
60%
40%
12.40%
14.80%
50%
50%
13.00%
15.00%
40%
60%
13.60%
15.20%
Chapter 9 The Case for International Diversification 51
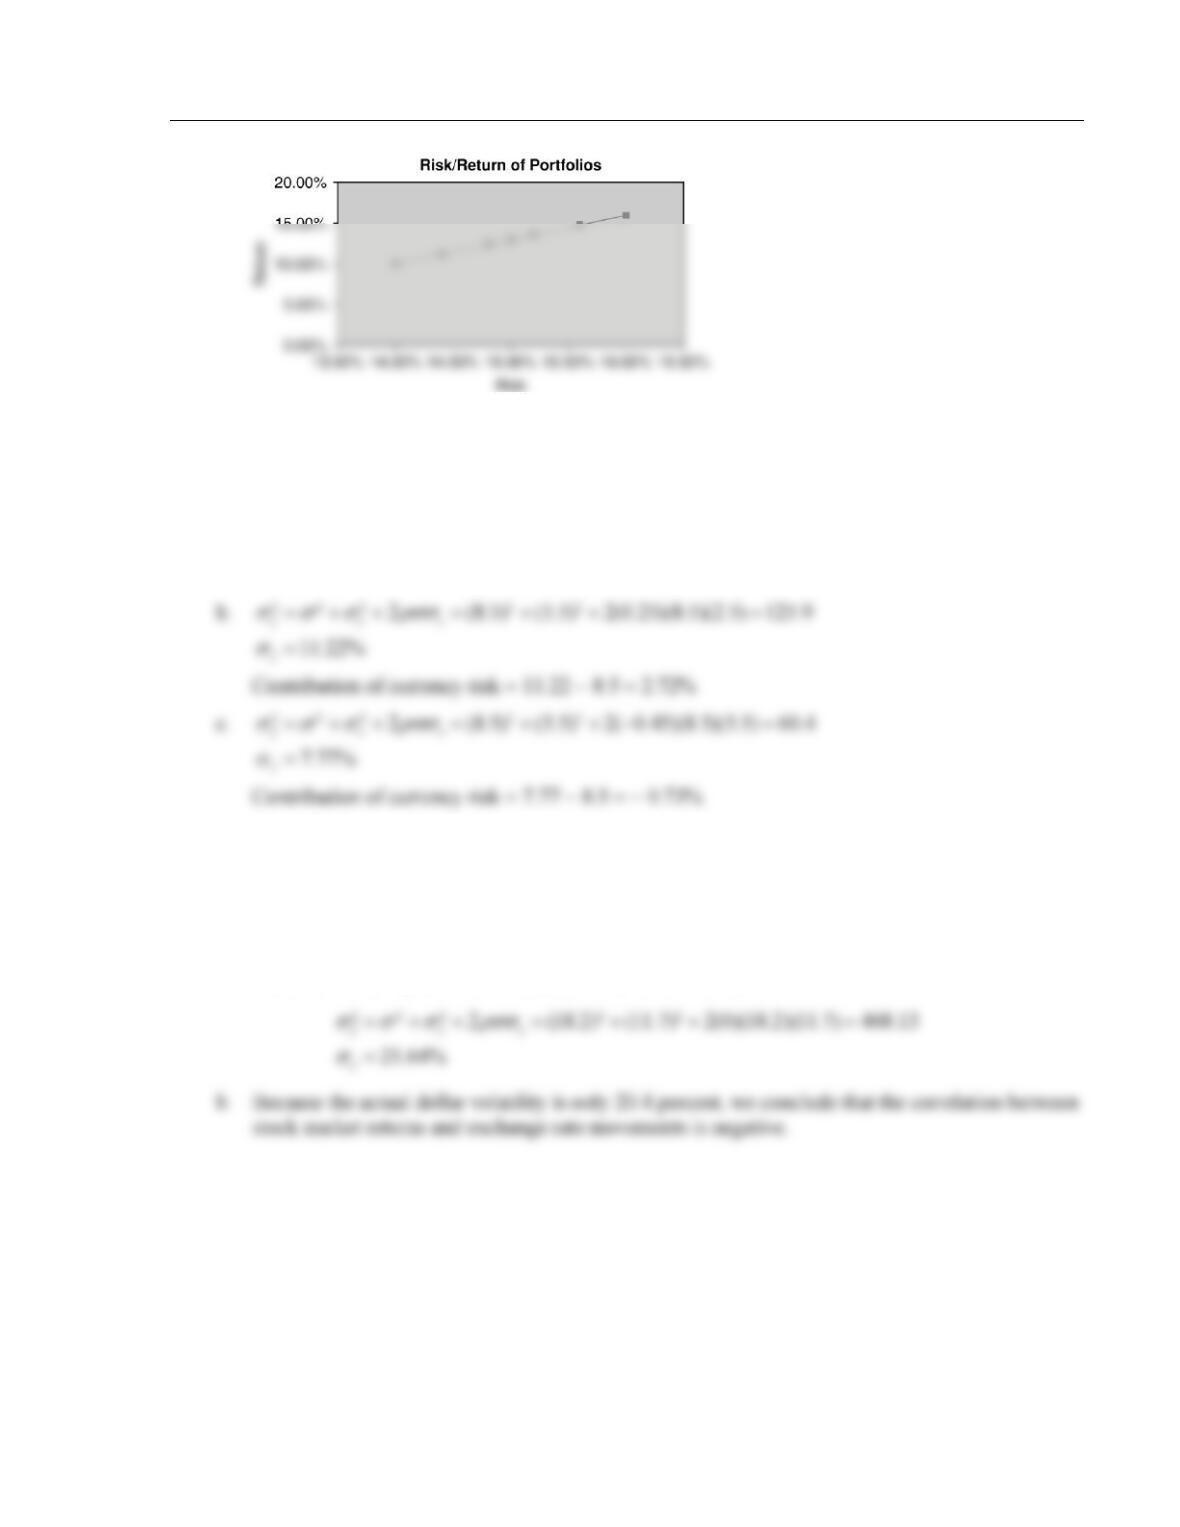
c. The graphs for Parts (a) and (b) illustrate that, holding all else constant, lower correlations
translate into lower levels of portfolio risk, without sacrificing expected return.
4. a.
2 2 2 2 2
2 (8.5) (5.5) 2(0)(8.5)(5.5) 102.5
10.12%
= + + = + + =
=
f s s
f
Contribution of currency risk = 10.12 – 8.5 = 1.62%
d. When the correlation between the asset return, in local currency, and the exchange rate movement
is low enough, currency risk may actually reduce the asset risk measured in dollars. However, in
cases in which the correlation is zero or positive, asset risk in dollars is higher than asset risk in
local currency because of currency risk.
5. a. If the correlation between stock market returns and exchange rate movements were equal to zero,
the dollar volatility of the German stock market would be

52 Solnik/McLeavey • Global Investments, Sixth Edition
6. a. If the correlation between bond market returns and exchange rate movements were equal to zero,
the dollar volatility of the German bond market would be
7. The best diversification vehicle is an asset whose value gets significantly higher when the rest of the
portfolio’s value is low, and thereby partially offsets the loss of other assets. The best vehicle is an
8. a. The markets that are highly correlated (currency-hedged) with Germany are the European
countries and, in particular, the French market (0.87) and the Swiss market (0.77). Both
Switzerland and France are countries bordering Germany, and their economies are highly
b. The markets that are highly correlated (currency-hedged) with the United States are the Canadian
market (0.73) and some European markets (e.g., 0.74 for the British market).
9. A review of the correlations in Exhibit 9.5 indicates that correlations of the U.S bond market with
foreign bond markets are well below 0.50, when measured in dollar terms. These low correlations
10. Exhibit 9.5 indicates that correlation of the U.S. equity market with global bond markets is quite low,
suggesting that adding bonds from foreign countries can reduce overall global portfolio risk. Thus,
from the viewpoint of a U.S. investor, Exhibit 9.5 provides strong justification for including global

Chapter 9 The Case for International Diversification 53
11. In general, over the long run, the performance of stock markets is closely tied to national economic
factors. For example, in the case of Japan, real average annual GDP growth was 4.51 percent from
1971 to 1980, and 4.15 percent from 1981 to 1990 (see Exhibit 9.11). These real GDP growth rates
dominated growth rates for the United States, Europe, and the Organization for Economic
12. Currency fluctuations have an impact on the total return and volatility of foreign currency–denominated
investments. However, there are at least four reasons why currency risk is not a barrier to international
investment:
• Market and currency risks are not additive. This is because the correlation between currency and
13. There is no doubt that financial markets are becoming increasingly interconnected worldwide. Some
of the reasons for this are as follows:
• Free trade. Because of the World Trade Organization (WTO) and as a result of regional
agreements such as NAFTA, ASEAN, and the EU, national economies are opening up to free
14. Correlation breakdown is a reference to the finding that during periods of crisis, when market
volatility is high, correlations across markets increase dramatically. This phenomenon has been
documented during major market events, such as the October 1987 crash and the Asian markets
crisis of 1997.

54 Solnik/McLeavey • Global Investments, Sixth Edition
15. There are a number of barriers to international investment, including the following:
• Familiarity with foreign markets. Many investors are not familiar with business customs overseas
and are therefore inclined to invest in domestic companies.
16. In the past, pure country return correlations were much lower than pure industry return correlations.
Exhibit 9.14 shows that country correlations were lower than industry correlations between 1993 and
1999. Thus, for this period, the two-step procedure of first determining country allocations and then
industry allocations within each country was justified. However, Exhibit 9.14 also shows that since
17. The distribution of returns in emerging markets is not symmetric. This calls into question the
applicability of the standard deviation as a measure of risk, because the standard deviation is
appropriate only if returns are normal. Emerging markets do have a higher standard deviation than
developed markets, because they are more volatile. But their return distribution also have fat tails,
meaning that there is a significant probability of a large shock, positive or negative. Emerging

Chapter 9 The Case for International Diversification 55

56 Solnik/McLeavey • Global Investments, Sixth Edition
18. Although it is true that local risks in emerging markets are high because of volatility, liquidity, and
political risk, correlations between emerging markets and developed markets are low. The low
correlations mean that some of the higher risk in emerging markets can be diversified away in a
global portfolio. Thus, the contribution of emerging markets to the total risk of a global portfolio is
19. a. Arguments in favor of adding international securities include the following:
i. Benefits gained from broader diversification, including economic, political and/or
geographic sources
ii. Expected higher returns at the same or lower (if properly diversified) level of portfolio risk
At the same time, there are a number of potential problems associated with moving away from a
domestic-securities-only orientation:
i. Possible higher costs, including those for custody, transactions, and management fees
ii. Possible reduced liquidity, especially when transacting in size

Chapter 9 The Case for International Diversification 57
b. A policy decision to include international securities in an investment portfolio is a necessary first
step to actualization. However, certain other policy-level decisions must be made prior to
implementation. That set of decisions would include the following:
i. What portion of the portfolio shall be invested internationally, and in what equity and fixed-
income proportions?
20. a. The consultant is alluding to the behavior of cross-country equity return correlations during
different market phases, as reported in various research studies. Specifically, the consultant is
referring to the fact that correlations in down markets tend to be significantly higher than