Chapter 09 – The Capital Asset Pricing Model
CHAPTER 9: THE CAPITAL ASSET PRICING MODEL
PROBLEM SETS
1. E(rP) = rf + P [E(rM ) – rf ]
2. If the security’s correlation coefficient with the market portfolio doubles (with all other
variables such as variances unchanged), then beta, and therefore the risk premium, will
also double. The current risk premium is: 14 – 6 = 8%
3. a. False. = 0 implies E(r) = rf , not zero.
b. False. Investors require a risk premium only for bearing systematic
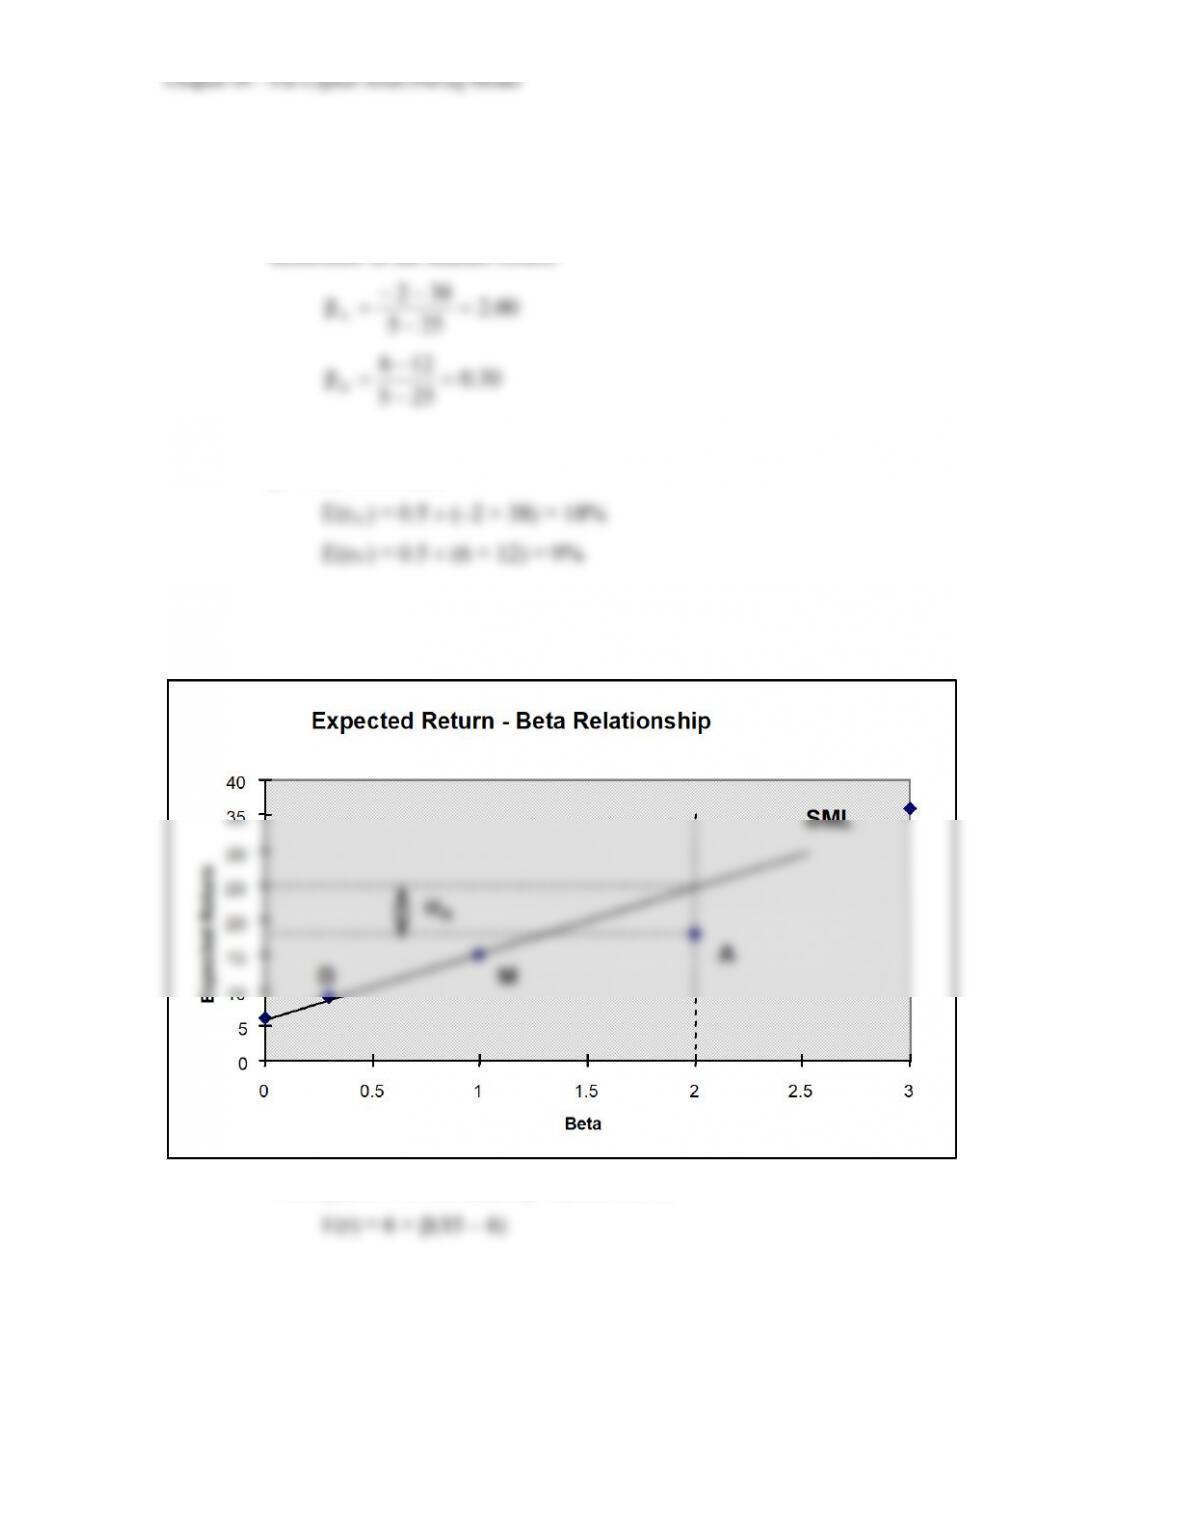
4. The appropriate discount rate for the project is:
rf + [E(rM ) – rf ] = 8 + [1.8 (16 – 8)] = 22.4%
9-2
5. a. Call the aggressive stock A and the defensive stock D. Beta is the sensitivity of the
stock’s return to the market return, i.e., the change in the stock return per unit
change in the market return. Therefore, we compute each stock’s beta by
calculating the difference in its return across the two scenarios divided by the
difference in the market return:
00.2
255
382
A=
−
−−
=
30.0
255
126
D=
−
−
=
b. With the two scenarios equally likely, the expected return is an average of the two
possible outcomes:
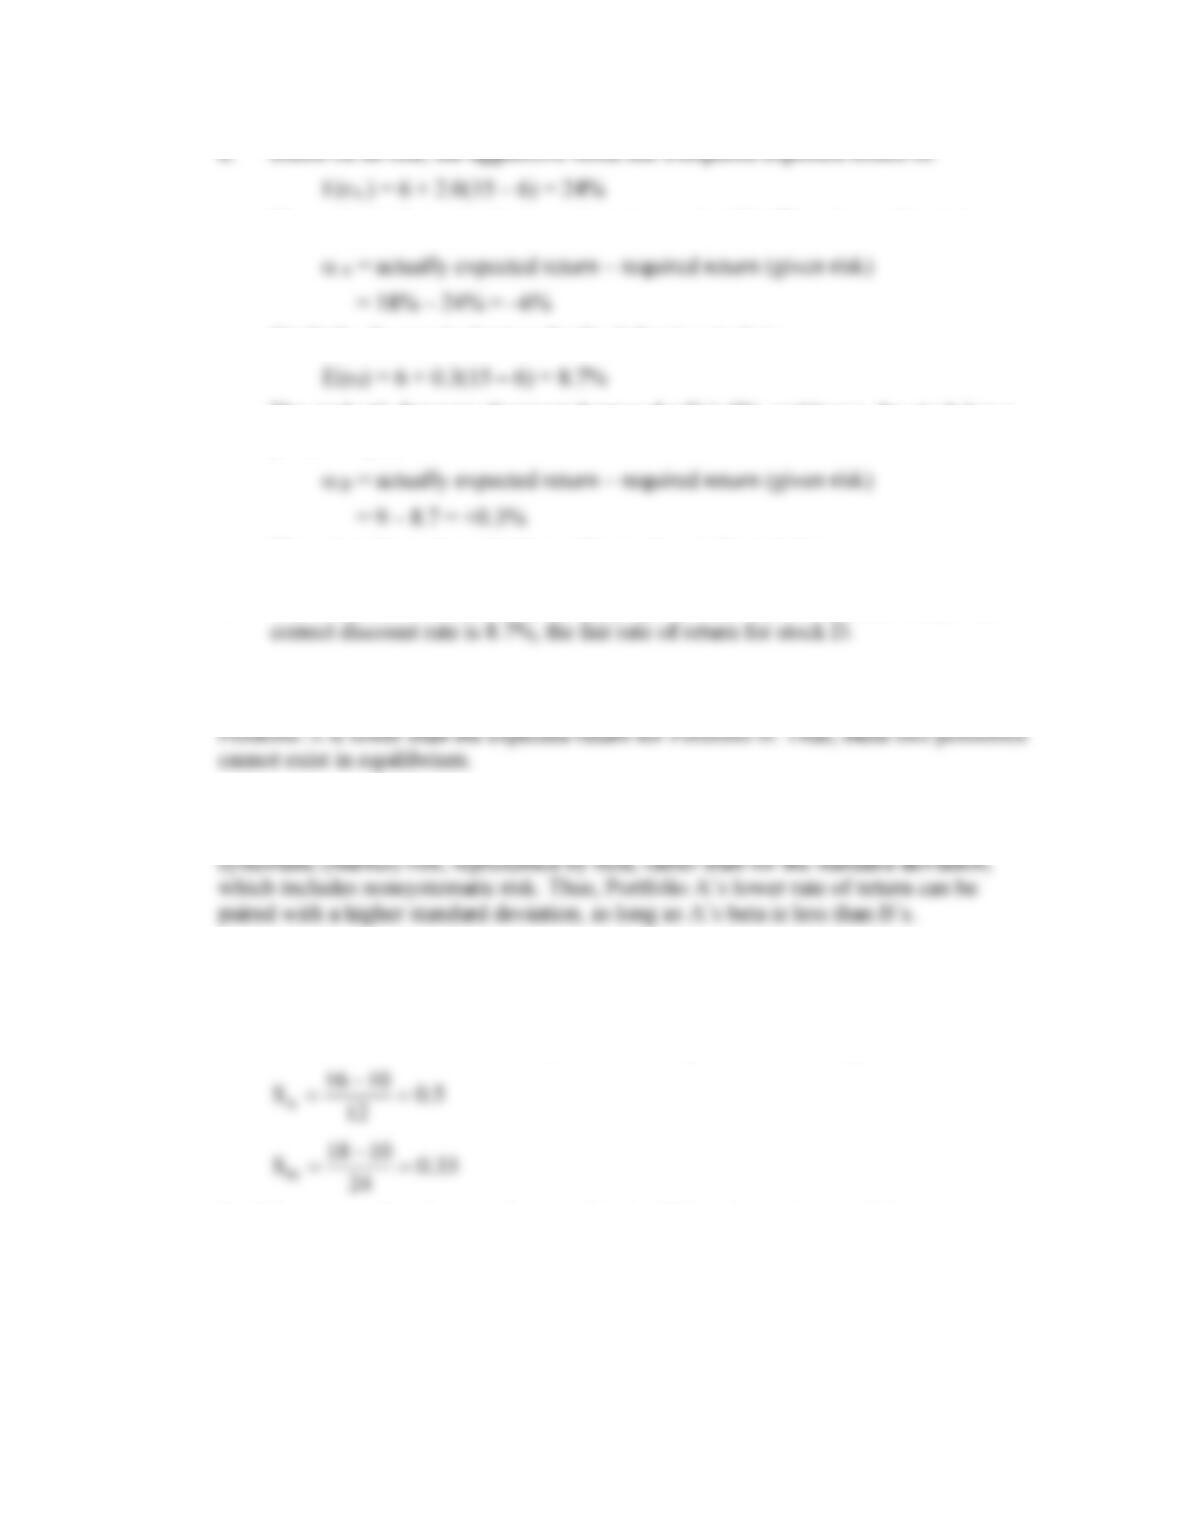
c. The SML is determined by the market expected return of [0.5(25 + 5)] = 15%,
with a beta of 1, and the T-bill return of 6% with a beta of zero. See the following
graph.
The equation for the security market line is:
Chapter 09 – The Capital Asset Pricing Model
9-3
d. Based on its risk, the aggressive stock has a required expected return of:
The analyst’s forecast of expected return is only 18%. Thus the stock’s alpha is:
Similarly, the required return for the defensive stock is:
The analyst’s forecast of expected return for D is 9%, and hence, the stock has a
positive alpha:
The points for each stock plot on the graph as indicated above.
e. The hurdle rate is determined by the project beta (0.3), not the firm’s beta. The
6. Not possible. Portfolio A has a higher beta than Portfolio B, but the expected return for
7. Possible. If the CAPM is valid, the expected rate of return compensates only for
8. Not possible. The reward-to-variability ratio for Portfolio A is better than that of the
market. This scenario is impossible according to the CAPM because the CAPM predicts
that the market is the most efficient portfolio. Using the numbers supplied:
5.0
12
1016
SA=
−
=
33.0
24
1018
SM=
−
=
Portfolio A provides a better risk-reward tradeoff than the market portfolio.
9. Not possible. Portfolio A clearly dominates the market portfolio. Portfolio A has both a
lower standard deviation and a higher expected return.
Chapter 09 – The Capital Asset Pricing Model
10. Not possible. The SML for this scenario is: E(r) = 10 + (18 – 10)
Portfolios with beta equal to 1.5 have an expected return equal to:
11. Not possible. The SML is the same as in Problem 10. Here, Portfolio A’s required return
12. Possible. The CML is the same as in Problem 8. Portfolio A plots below the CML, as
13. Since the stock’s beta is equal to 1.2, its expected rate of return is:
6 + [1.2 (16 – 6)] = 18%
0
011
P
PPD
)r(E −+
=
53$P
50
50P6
18.0 1
1=
+
=−
14. The series of $1,000 payments is a perpetuity. If beta is 0.5, the cash flow should be
discounted at the rate:
6 + [0.5 (16 – 6)] = 11%
9-5
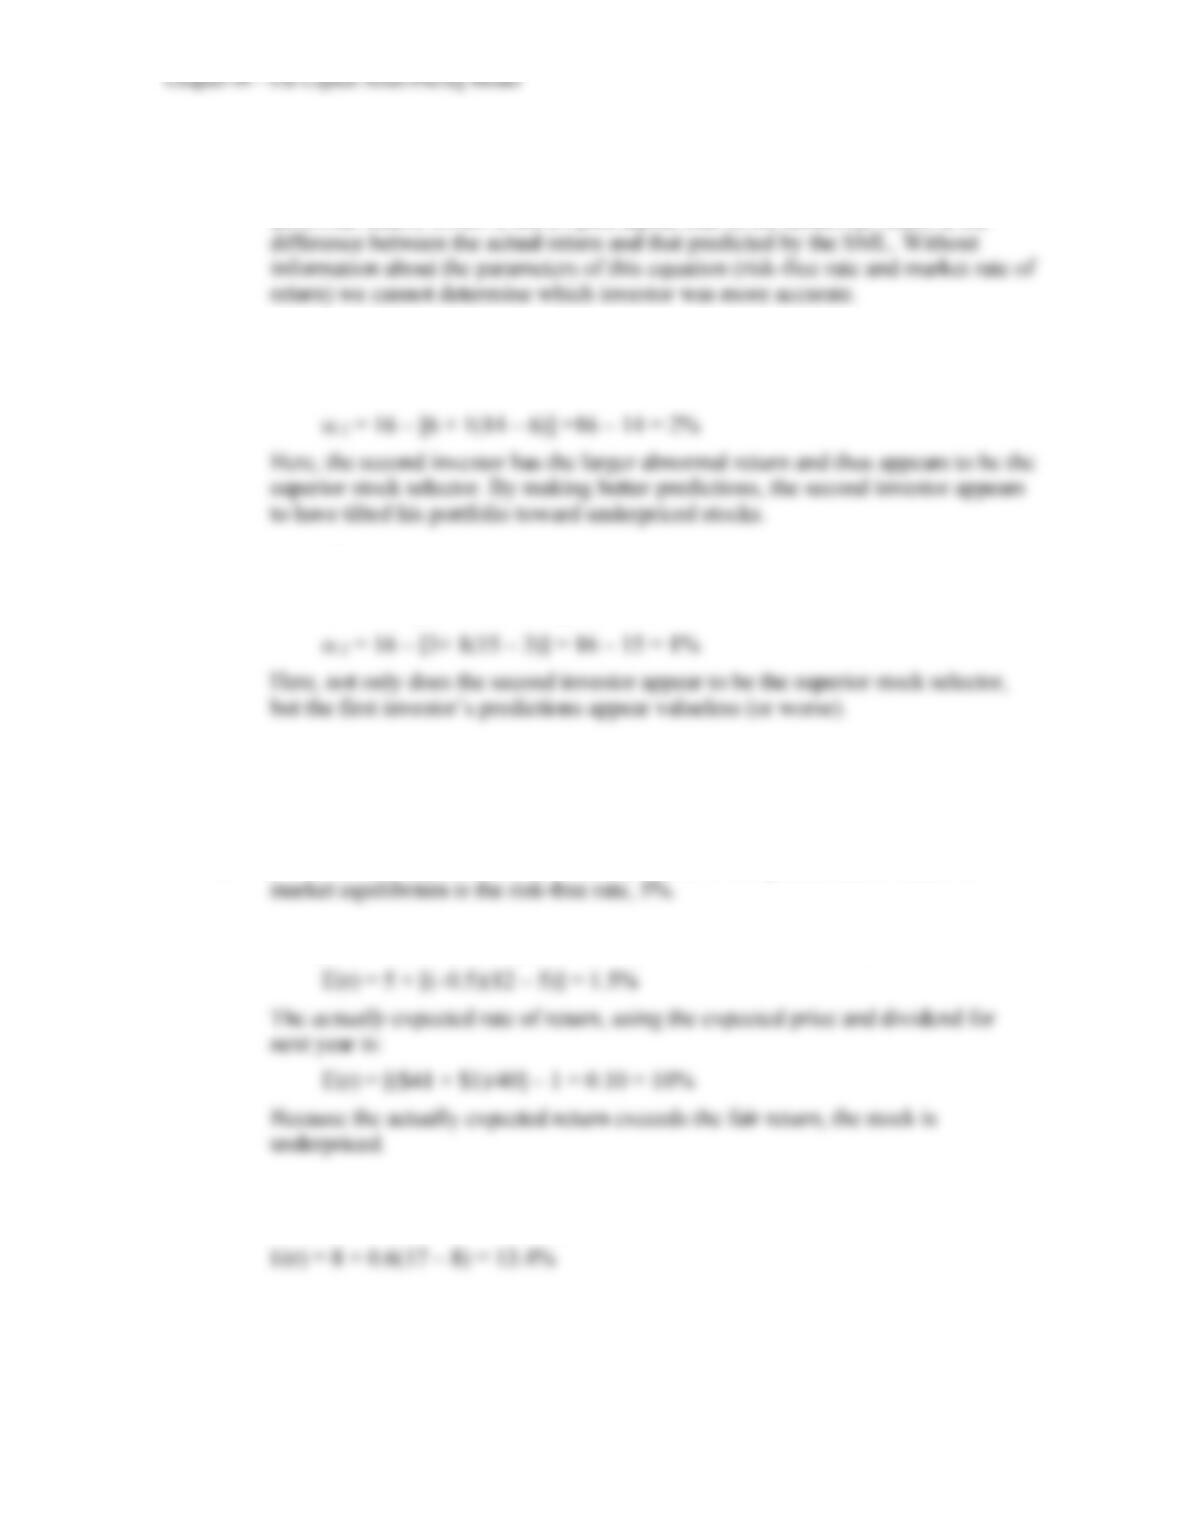
16. r1 = 19%; r2 = 16%; 1 = 1.5; 2 = 1
a. To determine which investor was a better selector of individual stocks we look at
abnormal return, which is the ex-post alpha; that is, the abnormal return is the
b. If rf = 6% and rM = 14%, then (using the notation alpha for the abnormal return):
1 = 19 – [6 + 1.5(14 – 6)] = 19 – 18 = 1%
c. If rf = 3% and rM = 15%, then:
1 =19 – [3 + 1.5(15 – 3)] = 19 – 21 = –2%
17. a. Since the market portfolio, by definition, has a beta of 1, its expected rate of return
is 12%.
b. = 0 means no systematic risk. Hence, the stock’s expected rate of return in
c. Using the SML, the fair expected rate of return for a stock with = –0.5 is:
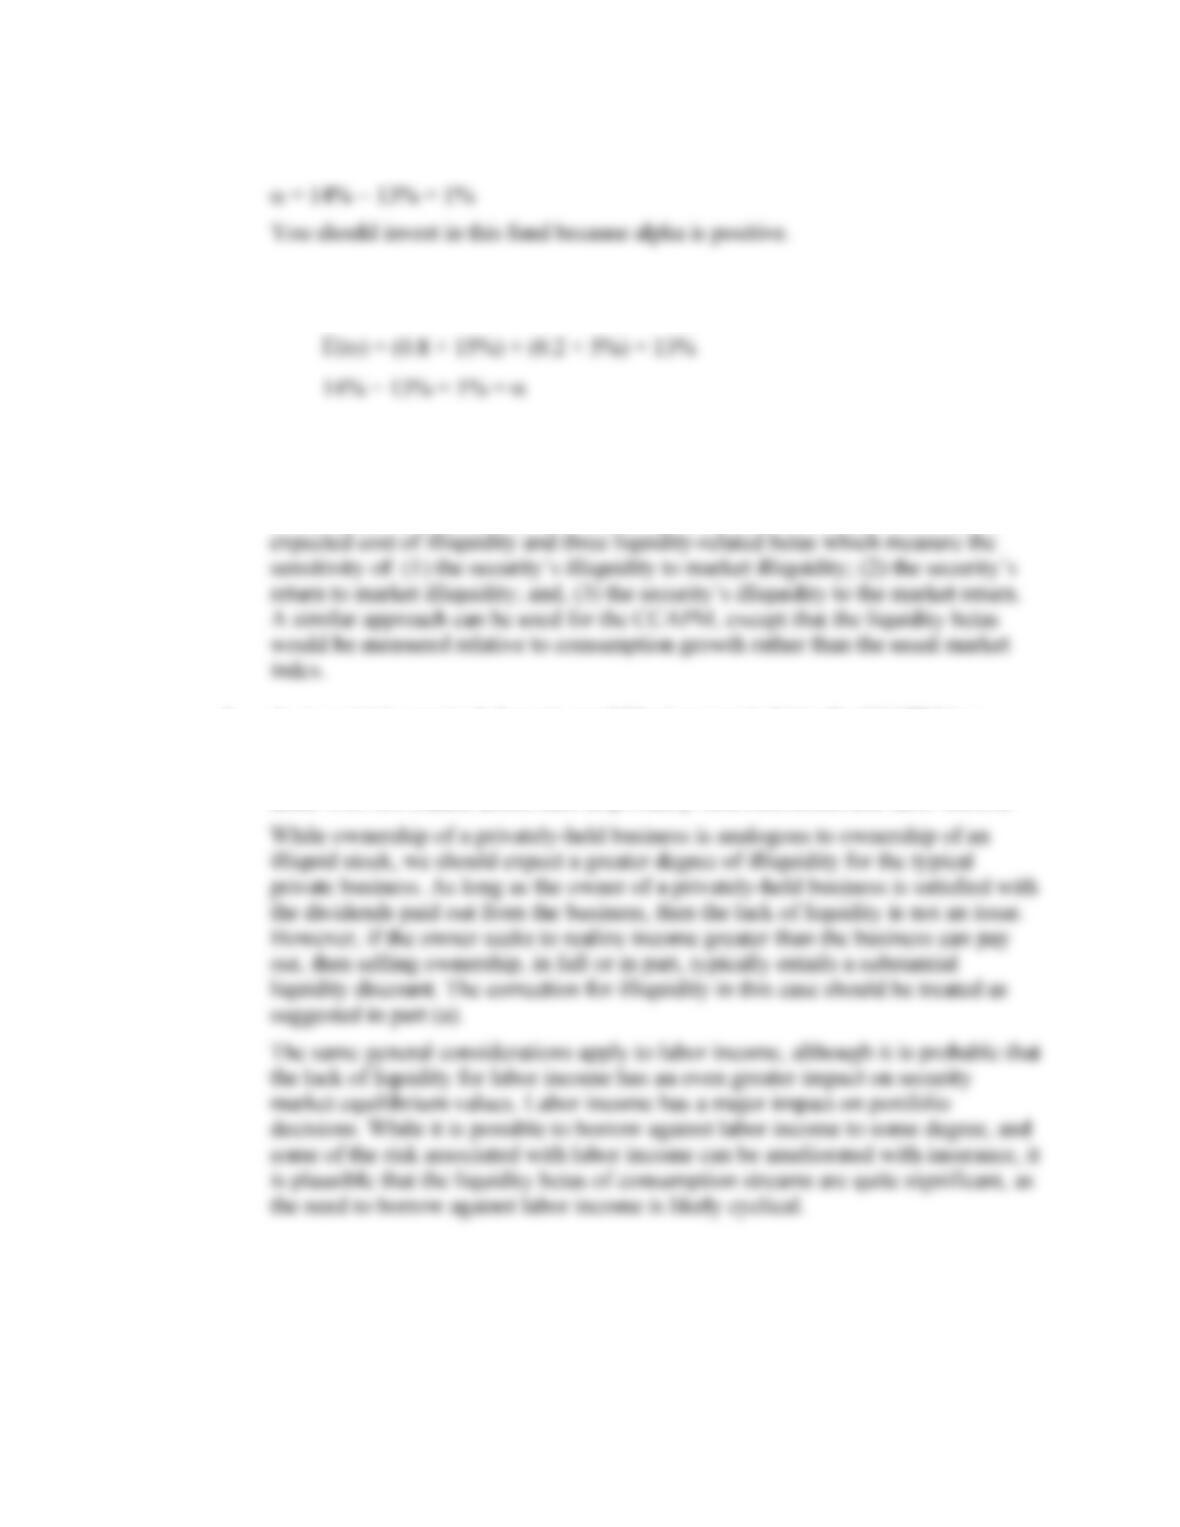
18. In the zero-beta CAPM the zero-beta portfolio replaces the risk-free rate, and thus:
Chapter 09 – The Capital Asset Pricing Model
9-6
19. a. E(rP) = rf + P [E(rM ) – rf ] = 5% + 0.8 (15% − 5%) = 13%
b. The passive portfolio with the same beta as the fund should be invested 80% in the
market-index portfolio and 20% in the money market account. For this portfolio:
20. a. We would incorporate liquidity into the CCAPM in a manner analogous to the way
in which liquidity is incorporated into the conventional CAPM. In the latter case,
in addition to the market risk premium, expected return is also dependent on the
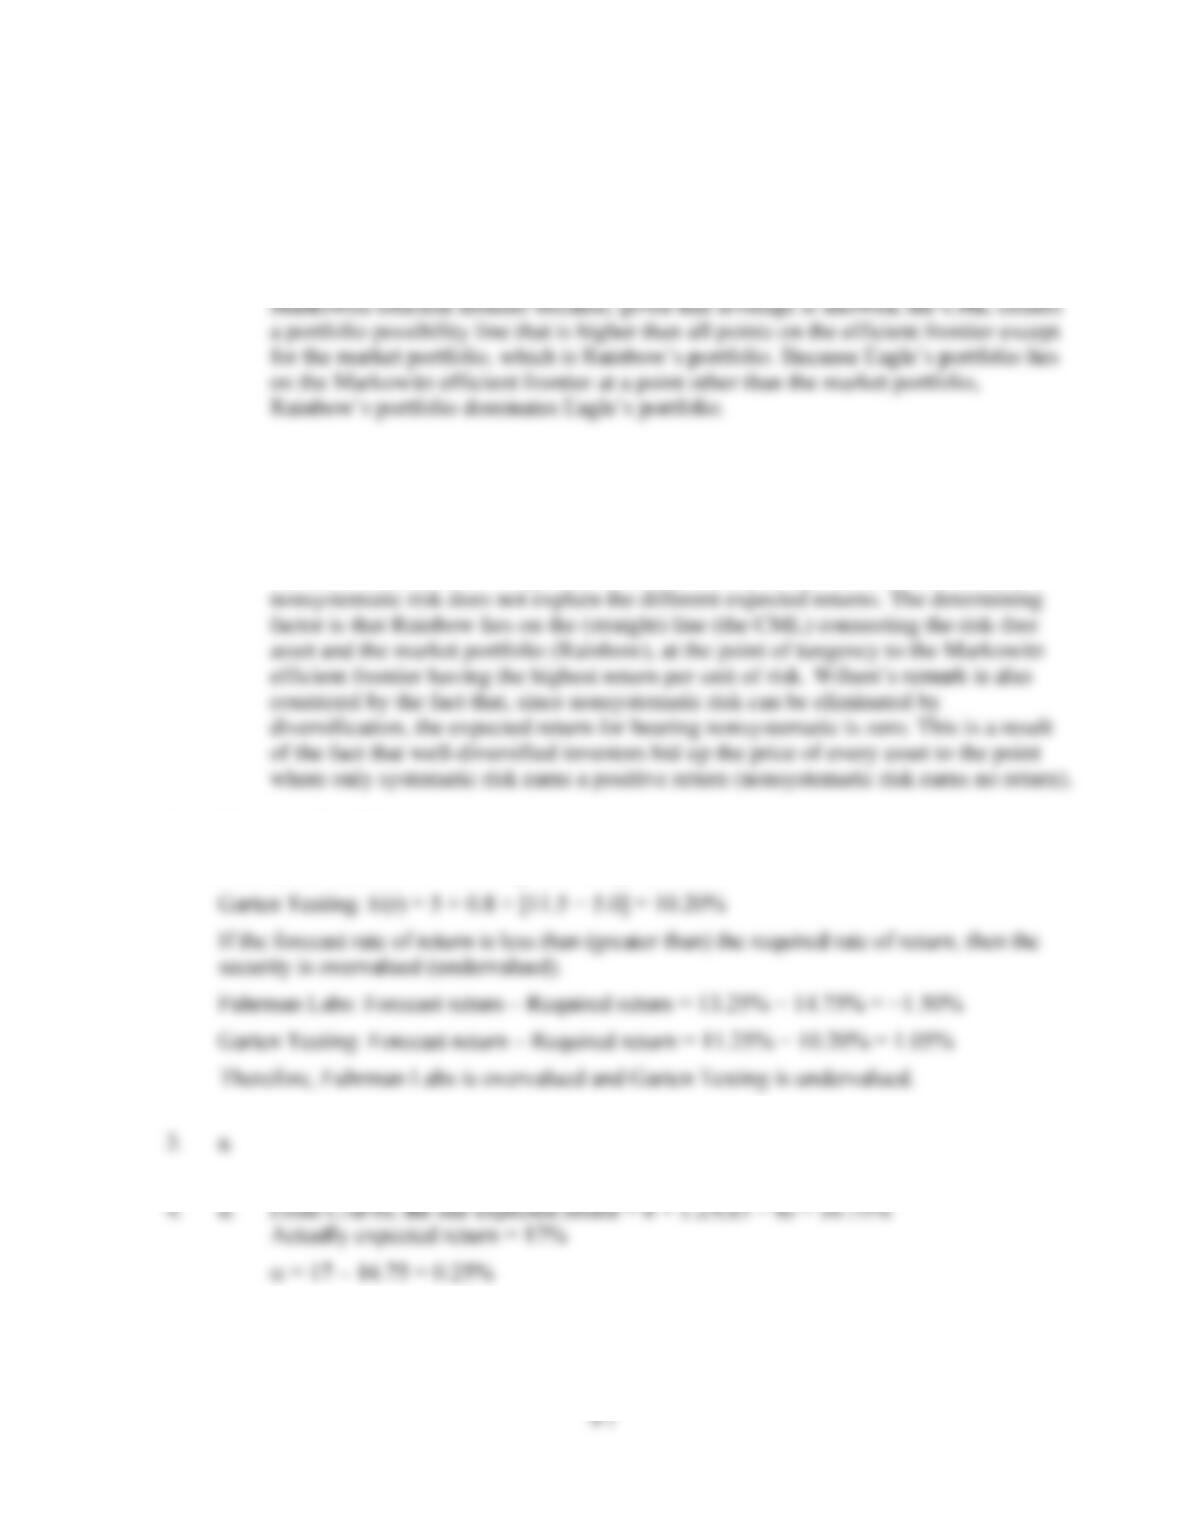
b. As in part (a), non-traded assets would be incorporated into the CCAPM in a
fashion similar to that described above, and, as in part (a), we would replace the
market portfolio with consumption growth. However, the issue of liquidity is more
acute with non traded-assets such as privately-held businesses and labor income.
Chapter 09 – The Capital Asset Pricing Model
CFA PROBLEMS
1. a. Agree; Regan’s conclusion is correct. By definition, the market portfolio lies on the
capital market line (CML). Under the assumptions of capital market theory, all
portfolios on the CML dominate, in a risk-return sense, portfolios that lie on the
b. Nonsystematic risk is the unique risk of individual stocks in a portfolio that is
diversified away by holding a well-diversified portfolio. Total risk is composed of
systematic (market) risk and nonsystematic (firm-specific) risk.
Disagree; Wilson’s remark is incorrect. Because both portfolios lie on the Markowitz
efficient frontier, neither Eagle nor Rainbow has any nonsystematic risk. Therefore,
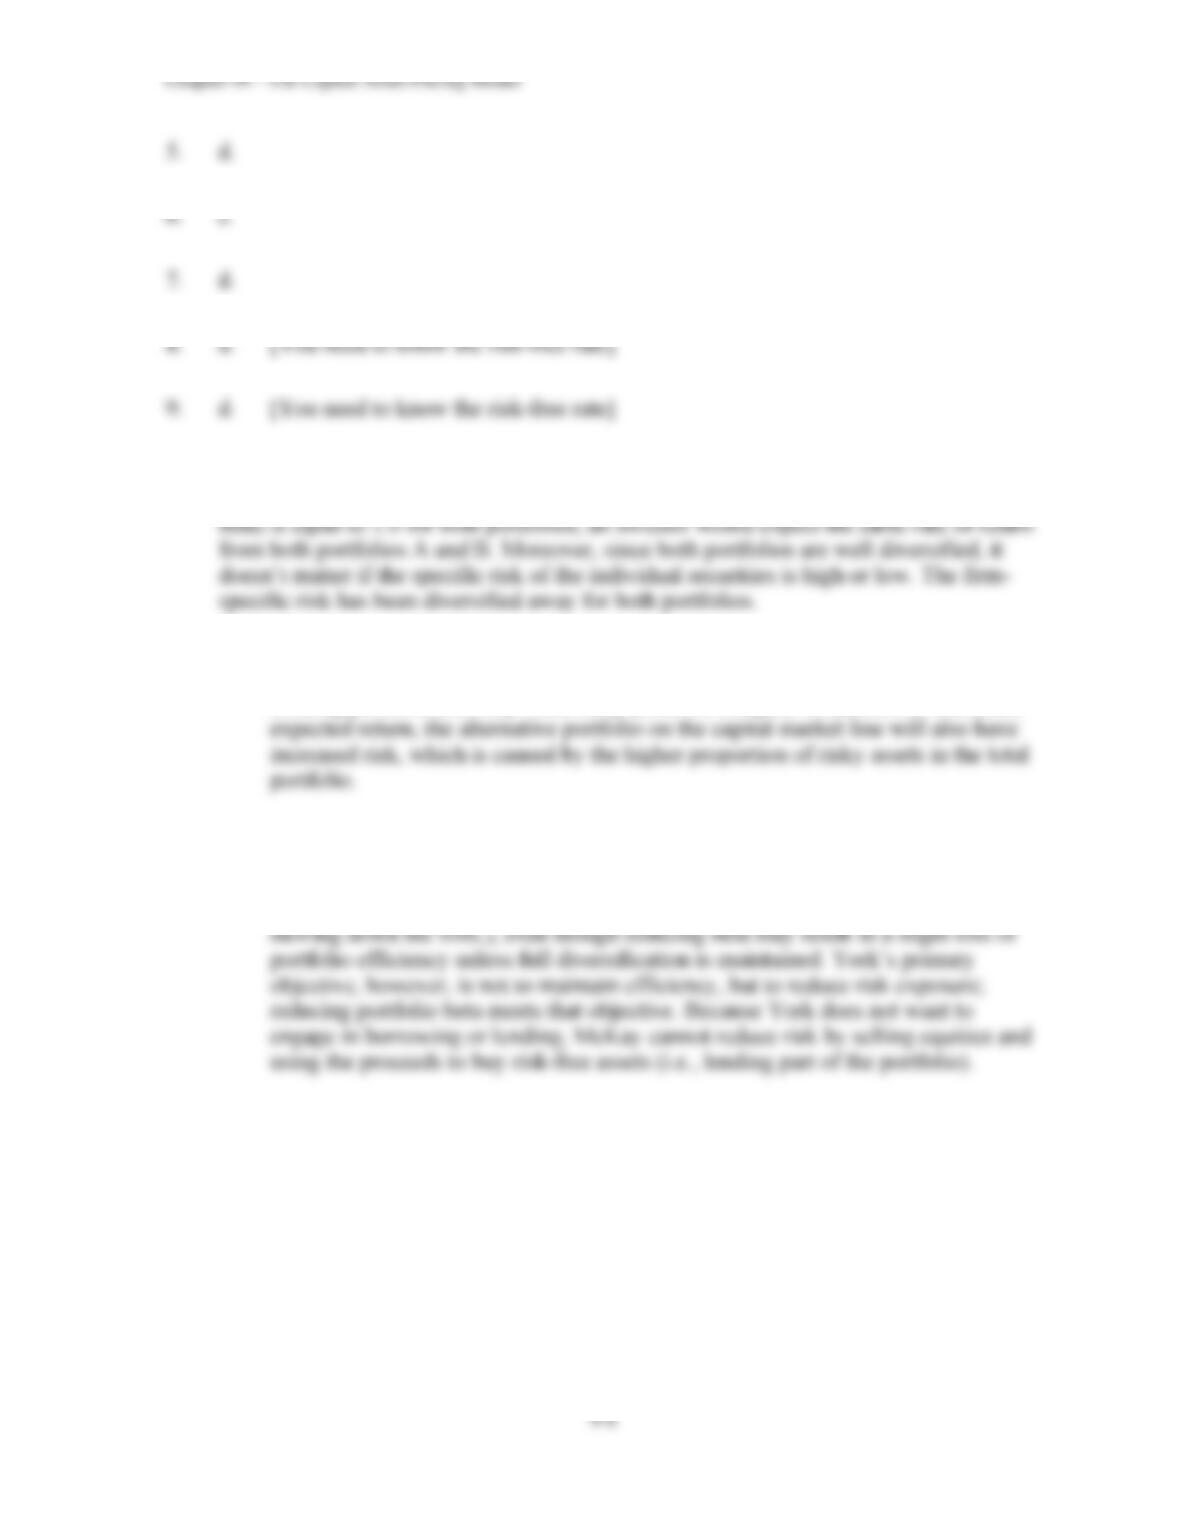
2. E(r) = rf + β × [E(r M ) − rf ]
Fuhrman Labs: E(r) = 5 + 1.5 × [11.5 − 5.0] = 14.75%
9-8
10. Under the CAPM, the only risk that investors are compensated for bearing is the risk
that cannot be diversified away (systematic risk). Because systematic risk (measured by
11. a. McKay should borrow funds and invest those funds proportionately in Murray’s
existing portfolio (i.e., buy more risky assets on margin). In addition to increased
b. McKay should substitute low beta stocks for high beta stocks in order to reduce
the overall beta of York’s portfolio. By reducing the overall portfolio beta, McKay
will reduce the systematic risk of the portfolio, and therefore reduce its volatility
relative to the market. The security market line (SML) suggests such action (i.e.,
9-9
12. a.
Expected Return
Alpha
Stock X
5% + 0.8(14% − 5%) = 12.2%
14.0% − 12.2% = 1.8%
Stock Y
5% + 1.5(14% − 5%) = 18.5%
17.0% − 18.5% = −1.5%
b. i. Kay should recommend Stock X because of its positive alpha, compared to
Stock Y, which has a negative alpha. In graphical terms, the expected return/risk
profile for Stock X plots above the security market line (SML), while the profile
for Stock Y plots below the SML. Also, depending on the individual risk
preferences of Kay’s clients, the lower beta for Stock X may have a beneficial
effect on overall portfolio risk.
ii. Kay should recommend Stock Y because it has higher forecasted return and
lower standard deviation than Stock X. The respective Sharpe ratios for Stocks X
and Y and the market index are:
Stock X: (14% − 5%)/36% = 0.25