
Chapter 09 – Behavioral Finance and Technical Analysis
CHAPTER NINE
BEHAVIORAL FINANCE AND TECHNICAL ANALYSIS
CHAPTER OVERVIEW
The chapter describes the developing area of behavioral finance and describes some types of
behavior that may lead to price movements being predictable. Technical analysis (TA) may be
useful in an environment that features some of the behavior patterns presented in behavioral
finance, although most of the tests of technical analysis have not demonstrated that TA has
value. The origin, with the Dow Theory, of technical analysis is presented and charting is
explained. Various other types of technical indicators are presented.
LEARNING OBJECTIVES
After studying this chapter, the student should be cognizant of typical analytical errors related to
behavioralism or psychology. The student should also understand some of the basic technical
indicators presented in this chapter. The student should also understand the theoretical problems
of technical analysis in competitive markets that approach efficiency.
CHAPTER OUTLINE
1. The Behavioral Critique
PPT 9-2 through PPT 9-14
The area of behavioral finance is relatively new but has been growing in popularity. The
behavioralists offer explanations of asset pricing that may perhaps explain some of the observed
anomalies in efficient markets, although other explanations are possible. The purpose of
behavioral finance is to improve decision making under uncertainty by considering information
processing errors that can lead investors to misestimate true probabilities of possible events or
rates or return. Various commonly posited examples are explained in the PPT.
Chapter 09 – Behavioral Finance and Technical Analysis
Using historical data as the main basis for a forecast is tantamount to using the data as a technical
trading rule. Like many technical rules it will work for a time, until it stops working, because the
underlying economic fundamentals change. Anchoring bias, or conservatism, as the text calls it,
is a similar phenomenon. The PPT refers to framing errors. This term refers to a person’s
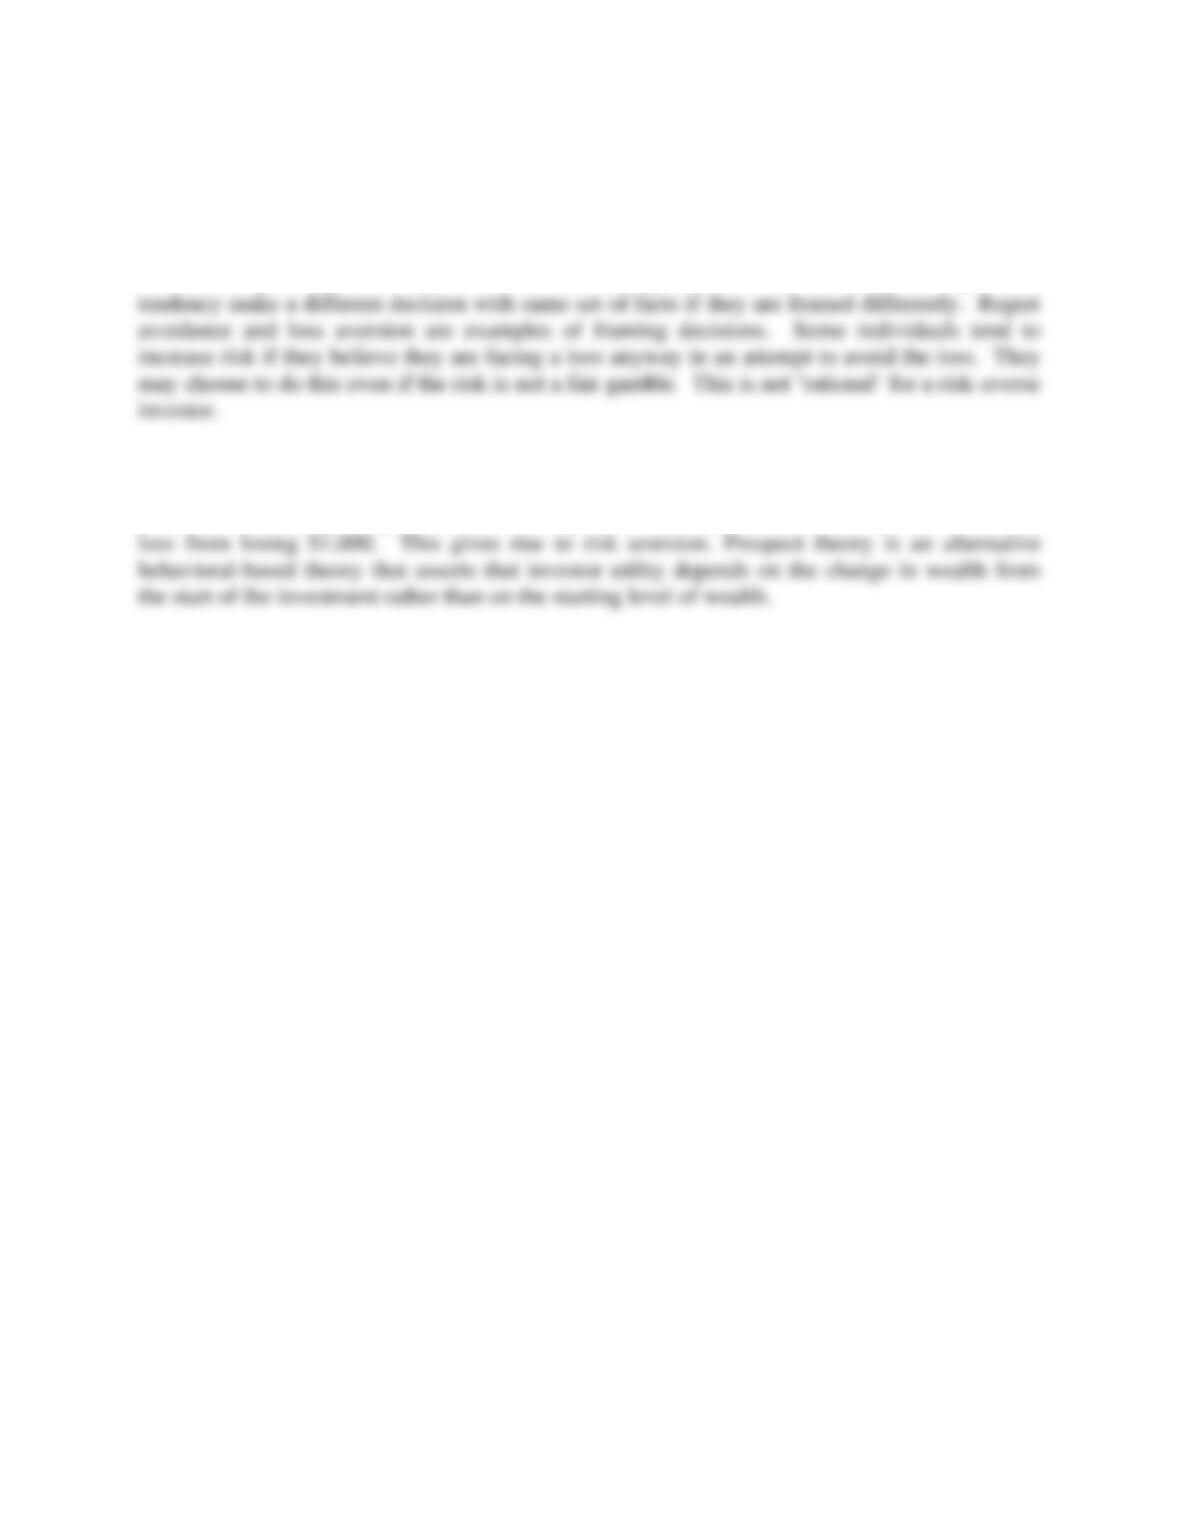
Standard utility (satisfaction) theory versus prospect theory
In standard utility theory of investments, investors desire more wealth and less risk. Wealth
provides diminishing marginal utility; thus a gain of $1,000 provides less utility than the utility
Chapter 09 – Behavioral Finance and Technical Analysis
Prospect theory is an example of loss aversion. To the right of zero, the investor acts like a
typical risk-averse investor with diminishing marginal utility as the increase in wealth becomes
larger. To the left of zero, in Panel B, an investor is “in the domain of losses” and their behavior
Chapter 09 – Behavioral Finance and Technical Analysis
• A typical response to behavioralism is that, in competitive markets, if some are letting
behavioral biases affect prices, why don’t other, better-trained investors engage in
profitable arbitrage? The growth in hedge funds might be reflective of this. There are
some restrictions to arbitrage activity which are covered in the PPT. One of them is
illustrated below:
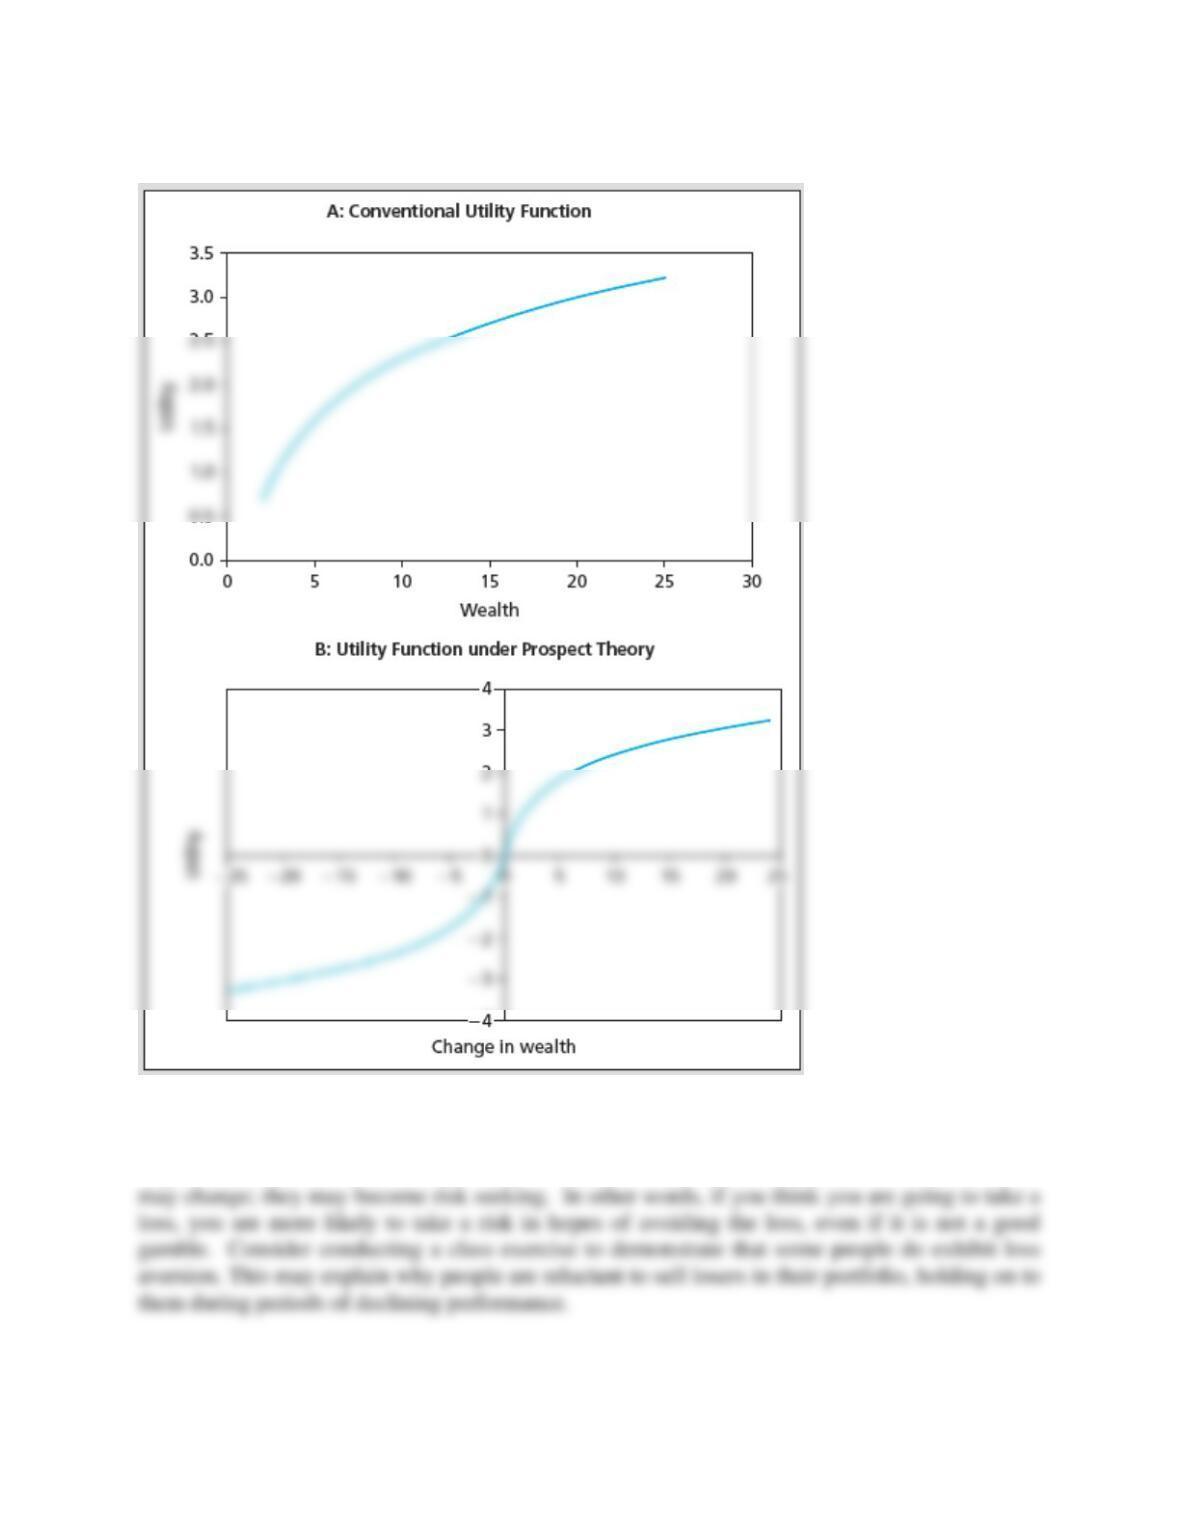
60:40 split of profits from merger between RD and Shell
Stock price ratio RD/Shell should = 60/40 = 1.5
If RD/Shell > 1.5, then short RD and buy Shell
If you had done this in 1993, you would have LOST money until 1999.
In 1907 Royal Dutch Petroleum merged with Shell Transport, although their stock continued
to trade separately. Under the merger agreement RD receives 60% of the profits of the joint
company and ST receives 40%. Hence the ratio of the share price of RD/ST should be 60/40
or 1.5. The price has deviated from this parity level for extended periods of time. There is
similar evidence in equity carve outs and perhaps in closed-end fund discounts and
premiums, although both of these may have other explanations. Remember Keynes’ quote,
“Markets can remain irrational longer than you can remain solvent.” What if prices don’t
conform to your models in the near term? This can be disastrous if you are levered.
2. Technical Analysis and Behavioral Finance
PPT 9-15 through PPT 9-31
Technical analysis (TA) uses price and/or volume data to attempt to find undervalued securities.
Technicians believe that there are predictable patterns in stock prices and that these patterns can
be exploited to secure abnormal profits. Technical analysts believe that market prices conform
to new data only slowly; giving rise to price trends, and that prices are affected by predictable
rises above the moving average, it is an indication that the stock will continue to increase in price
and a buy signal is said to occur. A sell signal occurs when the stock price falls below the
moving average. Some of the more popular charting methods used are defined.
Several sentiment indicators are displayed in the PPT.
The Trin statistic measures the number and trading volume on stocks that are advancing and
declining. If the Trin statistic exceeds one, a bearish signal occurs. For many indicators, both
bullish and bearish views are possible for the same relative measure of a statistic. Using the