Chapter 6
Equity: Concepts and Techniques
1. The book value represents mostly the historical value of the firm. Most assets and liabilities are
2. General provisions (“hidden reserves”) appear as a liability, although they are in fact equity reserves.
These provisions are “hidden” as a liability to allow the firm to use them in the future to smoothen
3. Some of the reasons why German earnings are understated compared with U.S. earnings are as
follows:
4. a. Without expensing the options, the firm’s pretax earnings per share are $2,000,000/500,000 =
$4 per share.
5. a. Consolidated earnings are as follows:
b. The P/E ratios are as follows:
Company A Company B
Nonconsolidated 200/10 = 20 450/30 = 15
Chapter 6 Equity: Concepts and Techniques 29
6. Under the assumption that the total worldwide revenue of all firms in this industry was $250 billion,
the market shares of the top five corporations are the following:
AOL Time Warner: $38 billion/$250 billion = 15.2%
Walt Disney: 25/250 = 10.0%
a. The three-firm concentration ratio is the combined market share of the largest three firms in the
industry = 15.2 + 10 + 10 = 35.2%.
The five-firm concentration ratio is the combined market share of the largest five firms in the
industry = 15.2 + 10 + 10 + 9.2 + 5.2 = 49.6%.
0.102 + 0.102 + 0.0922 + 0.0522 + 0.01262 + . . . + 0.01262 = 0.054 + 40 0.01262 = 0.0603.
d. The combined market share of the 10 other firms is 100 − 49.6 = 50.4%. Assuming that each of
them has the same share, the share of each is 50.4/10 = 5.04%. So, the Herfindahl index for the
industry, which is the sum of the squared market shares of all the firms in the industry, is 0.1522 +
0.102 + 0.102 + 0.0922 + 0.0522 + 0.05042 + . . . + 0.05042 = 0.054 + 10 0.05042 = 0.0794.
e. There is greater competition in the scenario in Part (c) than in Part (d). The Herfindahl index in
7. a. Though News Corporation is based in Australia, it is really a global conglomerate, and a majority
of its businesses are outside of Australia. About 77 percent of its revenues are in the United
b. Due to differences in accounting standards and practices among countries, the analyst would be
concerned if he were comparing ratios of News Corporation, computed as per Australian GAAP,
30 Solnik/McLeavey • Global Investments, Sixth Edition
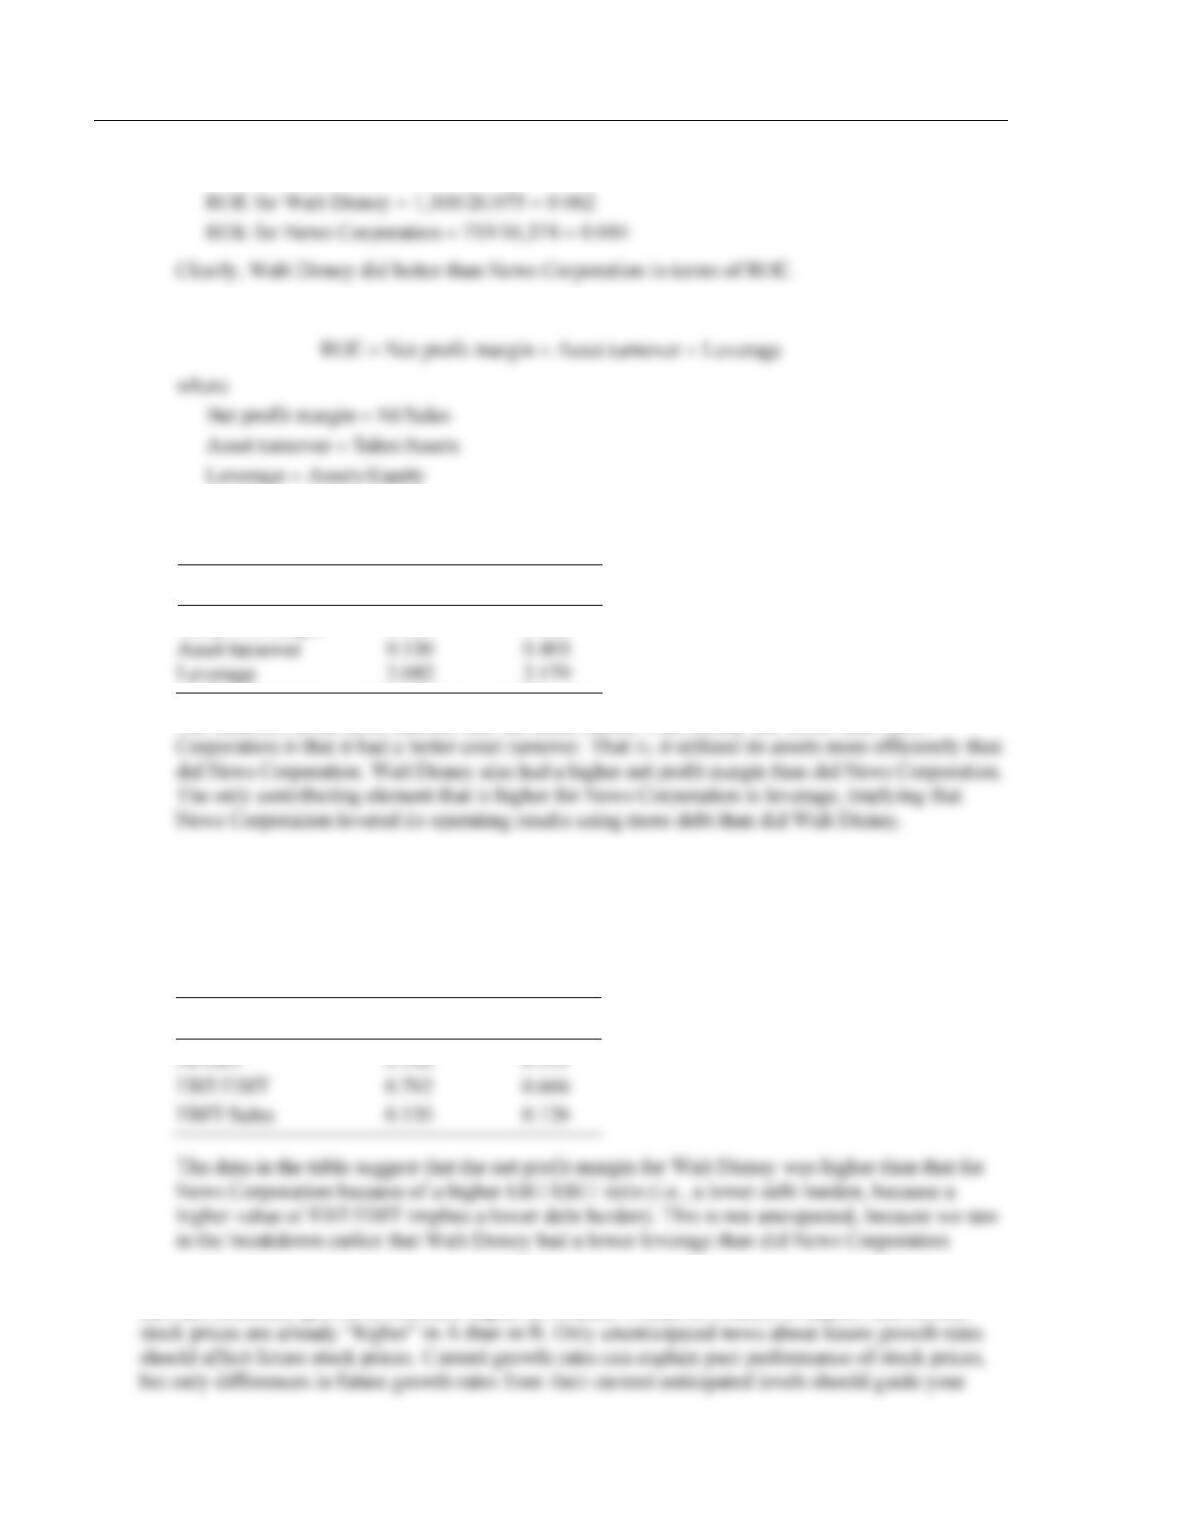
8. a. ROE = NI/Equity. So,
b. One version of the DuPont model breaks down ROE into three contributing elements, as follows:
The three contributing elements for both the companies are computed based on the data given in
the problem, and are given in the following table:
Walt Disney
News Corp.
Net profit margin
0.056
0.050
Asset turnover
0.536
0.403
The numbers in the table indicate that the main reason Walt Disney did better than News
To analyze why the net profit margin for Walt Disney is a little higher than that for News
Corporation, the net profit margin is broken down as follows:
Net profit margin = NI/EBT EBT/EBIT EBIT/Sales.
The breakdown of net profit margin is given in the following table:
Walt Disney
News Corp.
9. In an efficient market, all available information is already incorporated in current stock prices. The
fact that economic growth is currently higher in Country A than in Country B implies that current
Chapter 6 Equity: Concepts and Techniques 31
from those implicit in current stock prices.
10. The intrinsic value is given by:
11. a. Intrinsic P/E ratio
−
= = +
−
0
1
P1 (ROE )
1.
E ROE
br
r r b
In this case, b = 0, because the company pays out all its earnings. So, P0/E1 = 1/r = 1/0.13 = 7.69.
b. Again, P0/E1 = 1/r = 1/0.13 = 7.69.
12. a. Franchise factor = 1/r – 1/ROE = 1/0.10 – 1/0.12 = 1.67.
b. Growth factor = g/(r − g) = (b ROE)/(r – b ROE) = (0.70 0.12)/(0.10 – 0.70 0.12) = 5.25.
13. The P/E is equal to
01
1
P / E (1 )r l I
=+−
32 Solnik/McLeavey • Global Investments, Sixth Edition
14. For both Company B and Company U,
= 0.60, or 1 −
= 0.40. Also,
= 0.08 for both.
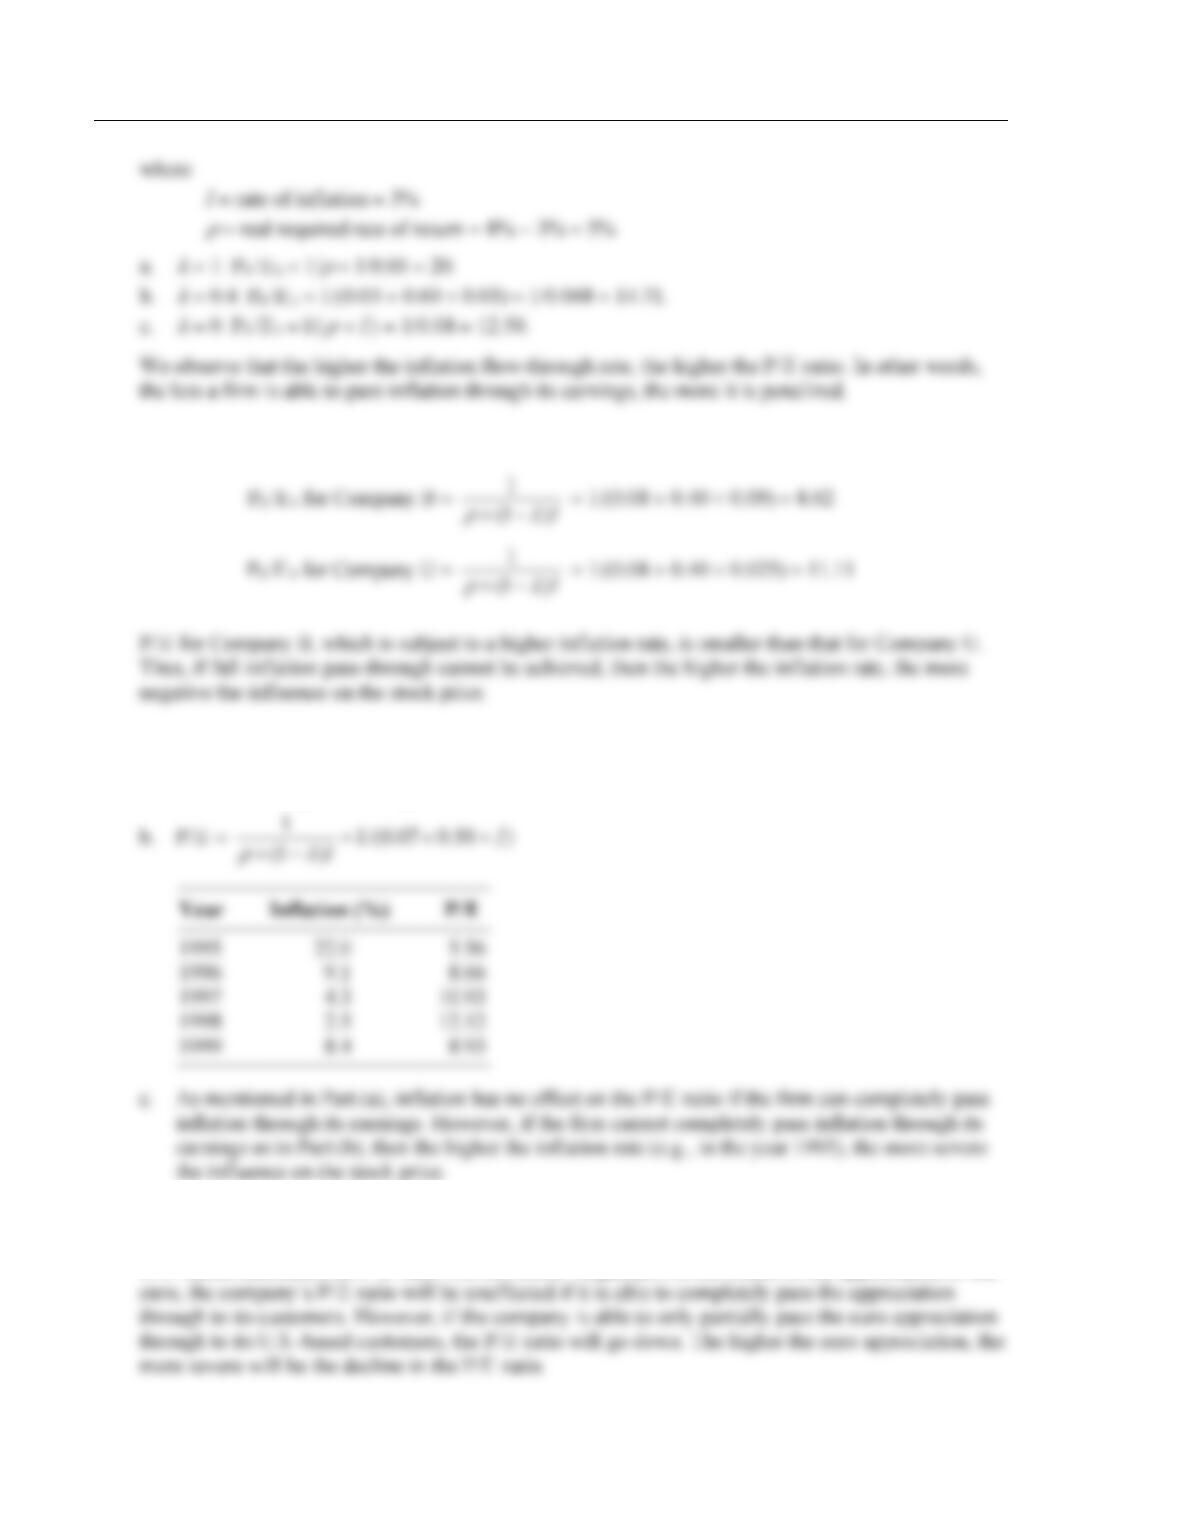
15. a. If the company can completely pass inflation through its earnings, P/E = 1/
= 1/0.07 = 14.29 in
each of the years. Inflation has no effect on the P/E ratio, because the firm can completely pass
inflation through its earnings.
16. Due to the appreciation of the euro relative to the dollar, the French goods will become more expensive
in terms of the dollar. If the French company is able to completely pass through this increase to its
U.S.-based customers, its P/E ratio will not suffer. Regardless of the extent of the appreciation of the
Chapter 6 Equity: Concepts and Techniques 33
17. a. Because the portfolio is equally invested in the two stocks, the factor exposures of the portfolio
would be equally weighted averages of the factor exposures of the two stocks. So, the factor
exposures of the portfolio would be as follows:
Portfolio
Confidence
0.4
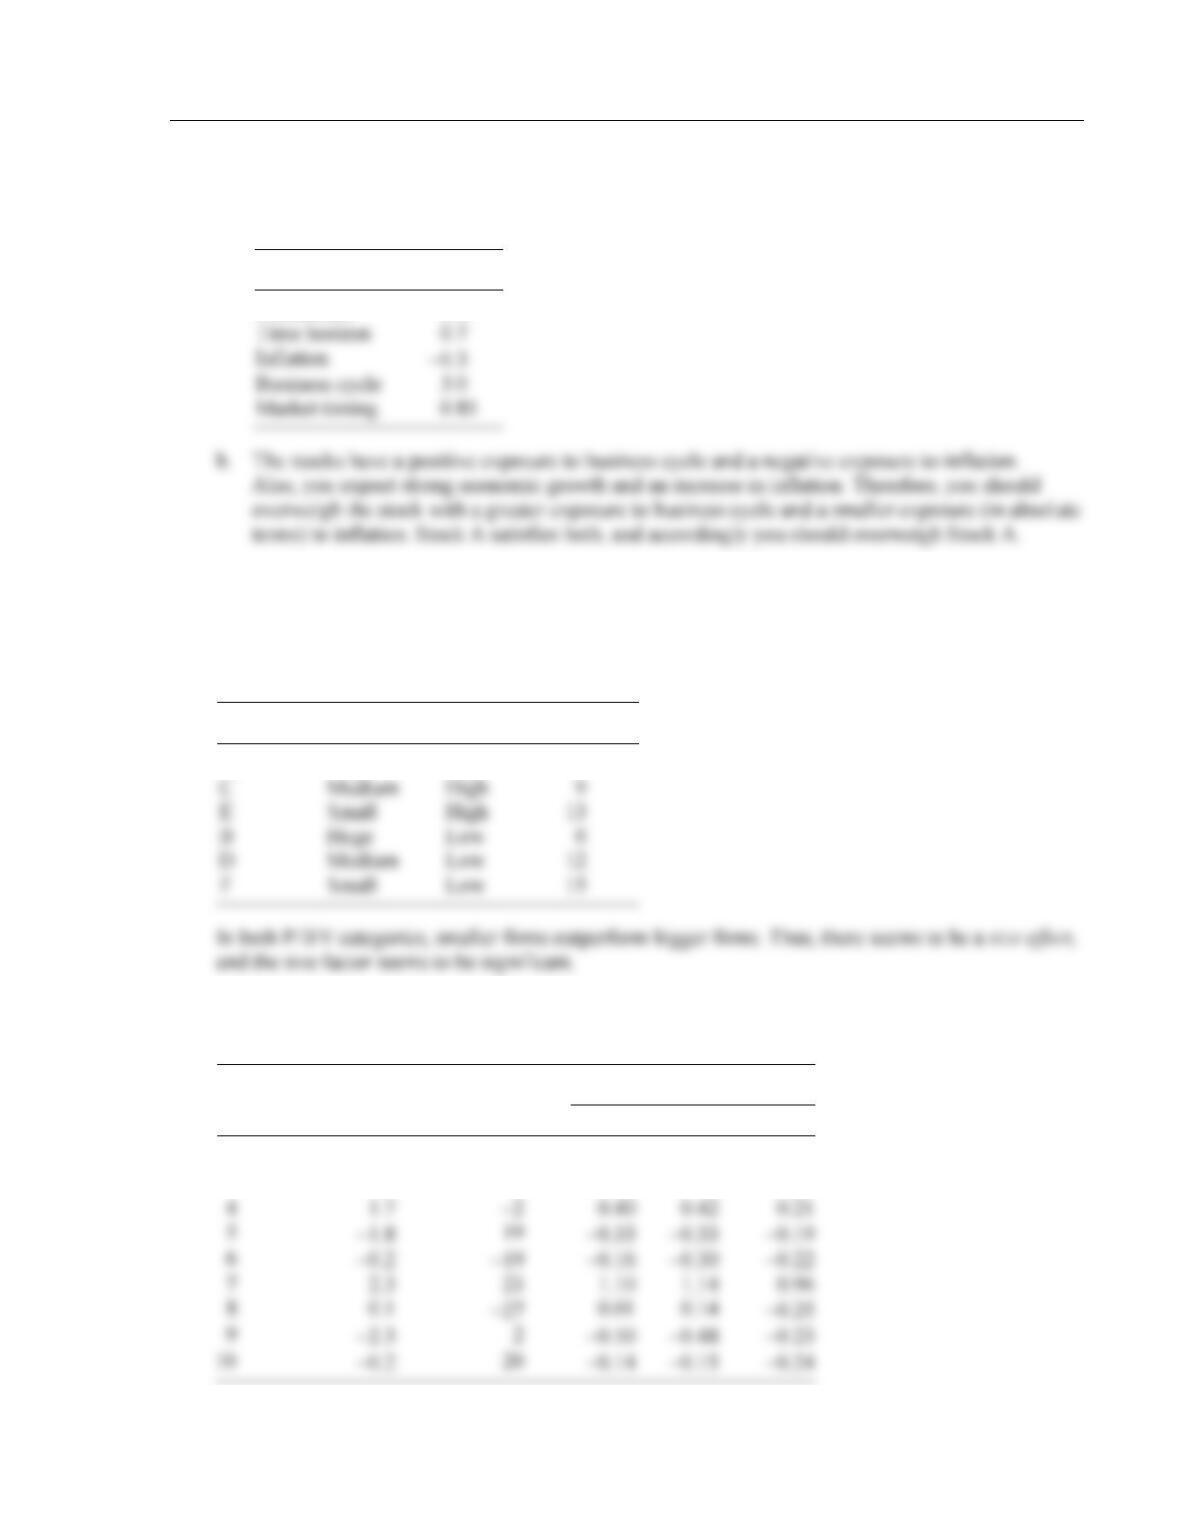
18. It is clear by looking at the table that in each of the three size categories, the low price-to-book value
stock (P/BV) outperforms the high P/BV stock. Thus, there seems to be a value effect, as the value
firms seem to outperform the growth firms. That is, the value factor seems to be significant.
To clearly see the size effect, we rearrange the stocks in the two P/BV categories, as follows:
Stock
Size
P/BV
Return (%))
A
Huge
High
4
Small
High
Huge
Low
6
19. We first compute the changes in the two factors and the returns on each stock. The following table
has the numbers. Because we are computing the changes, we lose one observation.
Period
Change in
Interest Rate
Change in
Approval
Return on Stock
A
B
C
2
−2.1
5
−0.12
−0.49
−0.45
3
0.3
−1
−0.22
0.39
0.39
0.40
5
−1.8
−0.33
−0.33
−0.19
6
−0.16
1.10
8
−0.25
9
−0.50
Business cycle
3.0
34 Solnik/McLeavey • Global Investments, Sixth Edition
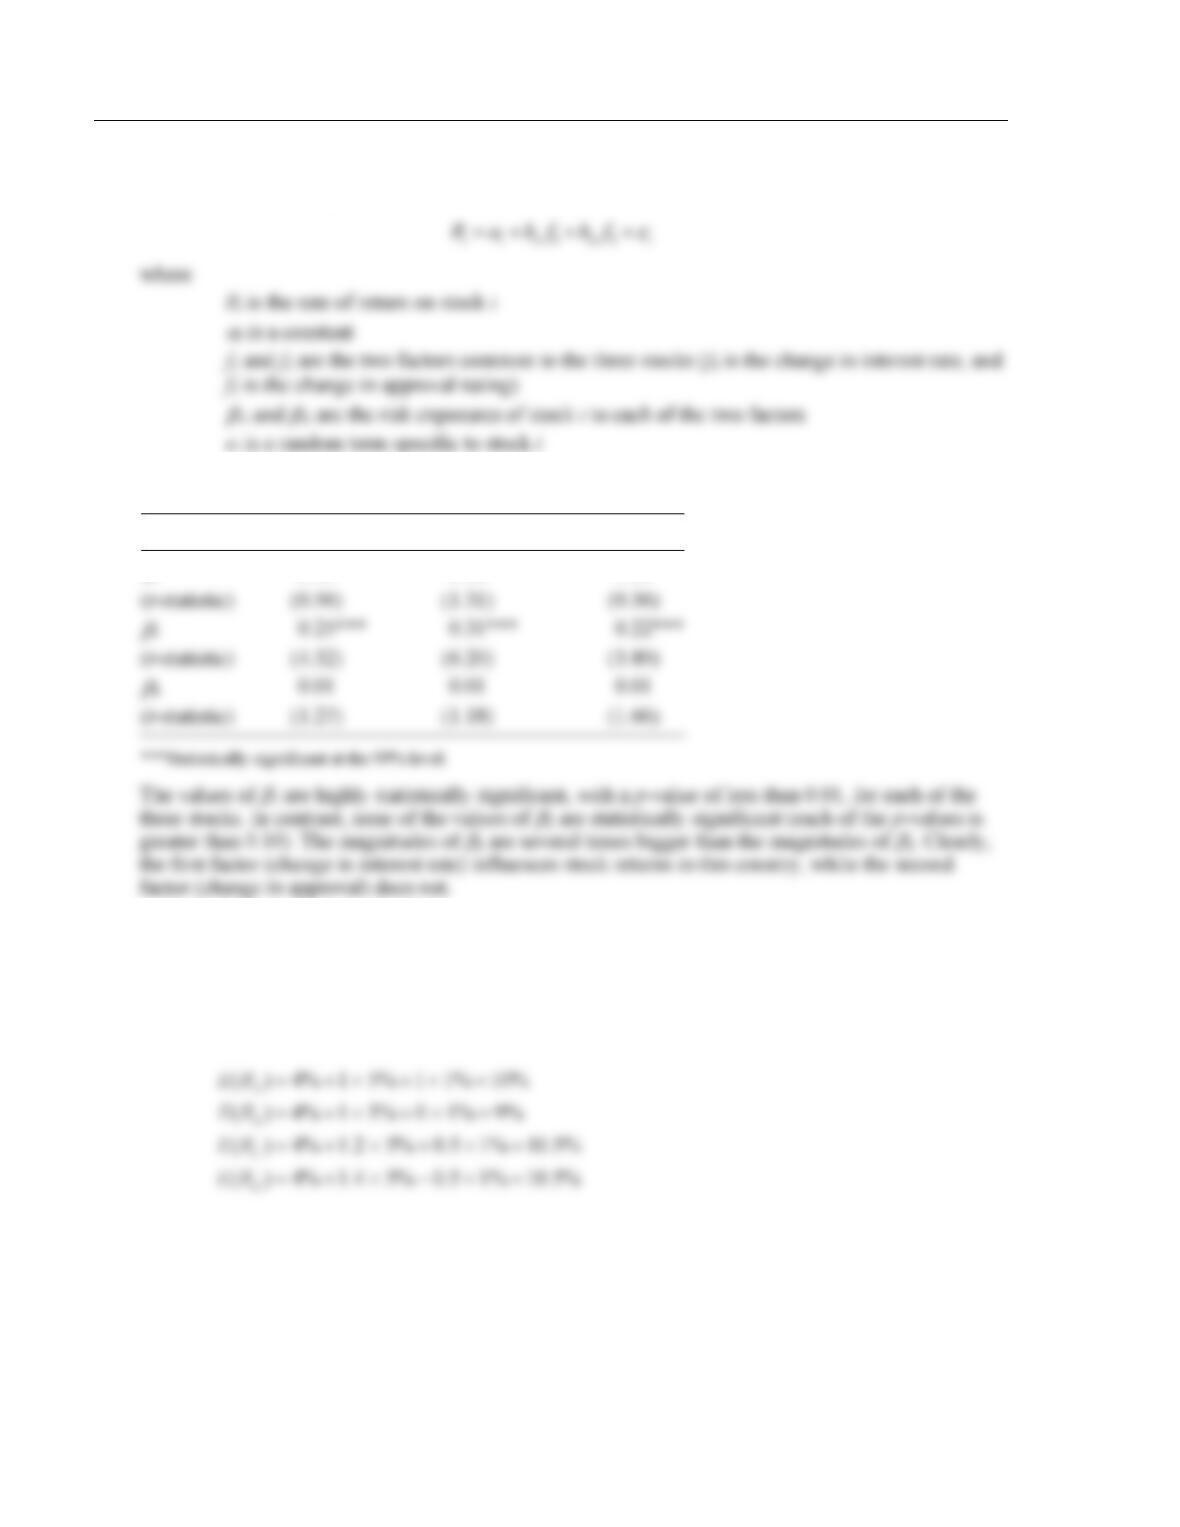
We now estimate the following factor model for each of the three stocks, using the respective nine
observations from the preceding table.
The results of the estimation are as follows:
Stock A
Stock B
Stock C
0.05
0.10
0.03
0.25***
0.31***
0.01
0.01
0.01
20. a.
SFr
4%, 5%, and 1%.
fw
R RP RP= = =
12
So ( ) 4% 5% 1%
i
ER
= + +
Accordingly,
Chapter 6 Equity: Concepts and Techniques 35
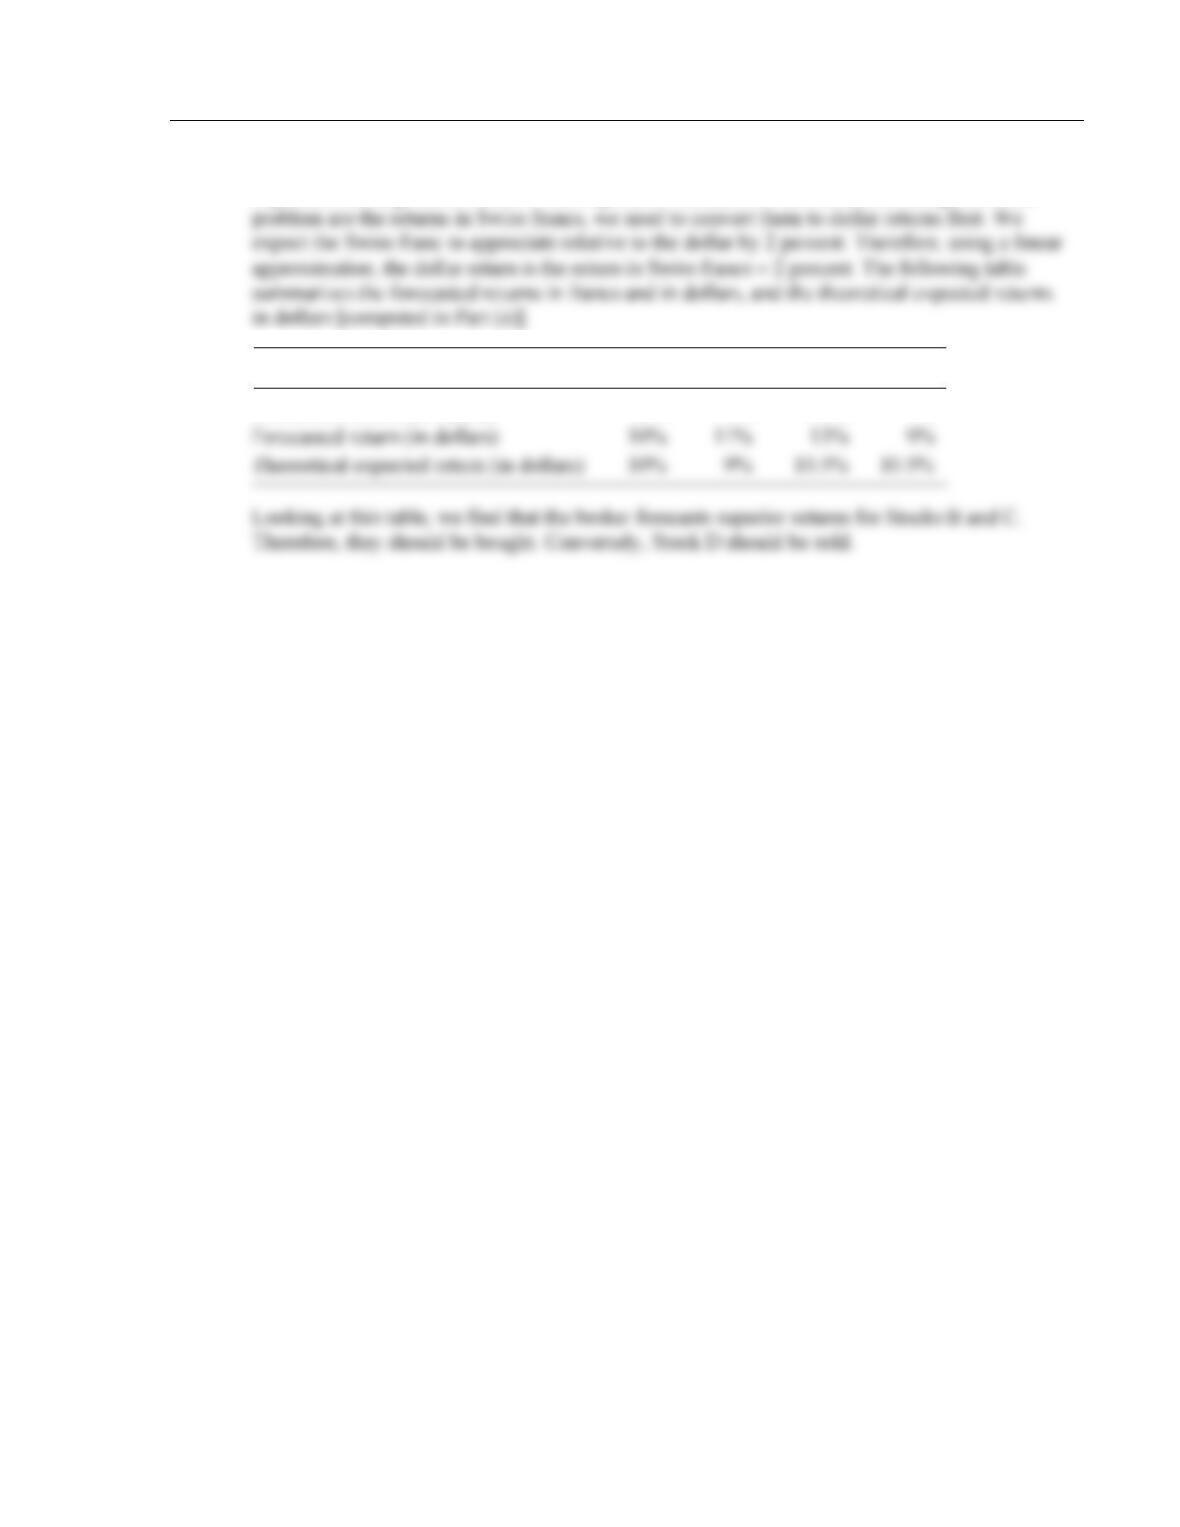
b. Stocks that should be purchased are those with a forecasted return, higher than their theoretical
expected return, given the stock’s risk exposures. Because the forecasted returns given in the
Stock A
Stock B
Stock C
Stock A
Forecasted return (in francs)
8%
9%
11%
7%