Chapter 05 – Learning About Return and Risk from the Historical Record
5-1
CHAPTER 5: LEARNING ABOUT RETURN AND RISK
FROM THE HISTORICAL RECORD
PROBLEM SETS
1. The Fisher equation predicts that the nominal rate will equal the equilibrium real rate
plus the expected inflation rate. Hence, if the inflation rate increases from 3% to 5%
2. If we assume that the distribution of returns remains reasonably stable over the entire
history, then a longer sample period (i.e., a larger sample) increases the precision of the
estimate of the expected rate of return; this is a consequence of the fact that the standard
3. The true statements are (c) and (e). The explanations follow.
Statement (c): Let
= the annual standard deviation of the risky investments and
1
=
2
Chapter 05 – Learning About Return and Risk from the Historical Record
Statement (e): The first investment alternative is more attractive to investors with lower
4. For the money market fund, your holding period return for the next year depends on the
level of 30-day interest rates each month when the fund rolls over maturing securities.
The one-year savings deposit offers a 7.5% holding period return for the year. If you
5. a. If businesses reduce their capital spending, then they are likely to decrease their
b. Increased household saving will shift the supply of funds curve to the right and
c. Open market purchases of U.S. Treasury securities by the Federal Reserve Board
5-3
6. a. The “Inflation–Plus” CD is the safer investment because it guarantees the purchasing
b. The expected return depends on the expected rate of inflation over the next year. If the
expected rate of inflation is less than 3.5% then the conventional CD offers a higher
c. If you expect the rate of inflation to be 3% over the next year, then the conventional
CD offers you an expected real rate of return of 2%, which is 0.5% higher than the real
d. No. We cannot assume that the entire difference between the risk-free nominal rate (on
conventional CDs) of 5% and the real risk-free rate (on inflation-protected CDs) of
7. E(r) = [0.35 44.5%] + [0.30 14.0%] + [0.35 (–16.5%)] = 14%
8. Probability distribution of price and one-year holding period return for a 30-year U.S.
Treasury bond (which will have 29 years to maturity at year’s end):
Economy
Probability
YTM
Price
Capital
Gain
Coupon
Interest
HPR
Boom
0.20
11.0%
$74.05
−$25.95
$8.00
−17.95%
Normal Growth
0.50
8.0%
$100.00
$0.00
$8.00
8.00%
Recession
0.30
7.0%
$112.28
$12.28
$8.00
20.28%
Chapter 05 – Learning About Return and Risk from the Historical Record
5-4
10. (a) With probability 0.9544, the value of a normally distributed variable will fall
11. From Table 5.3, the average risk premium for large-capitalization U.S. stocks for the
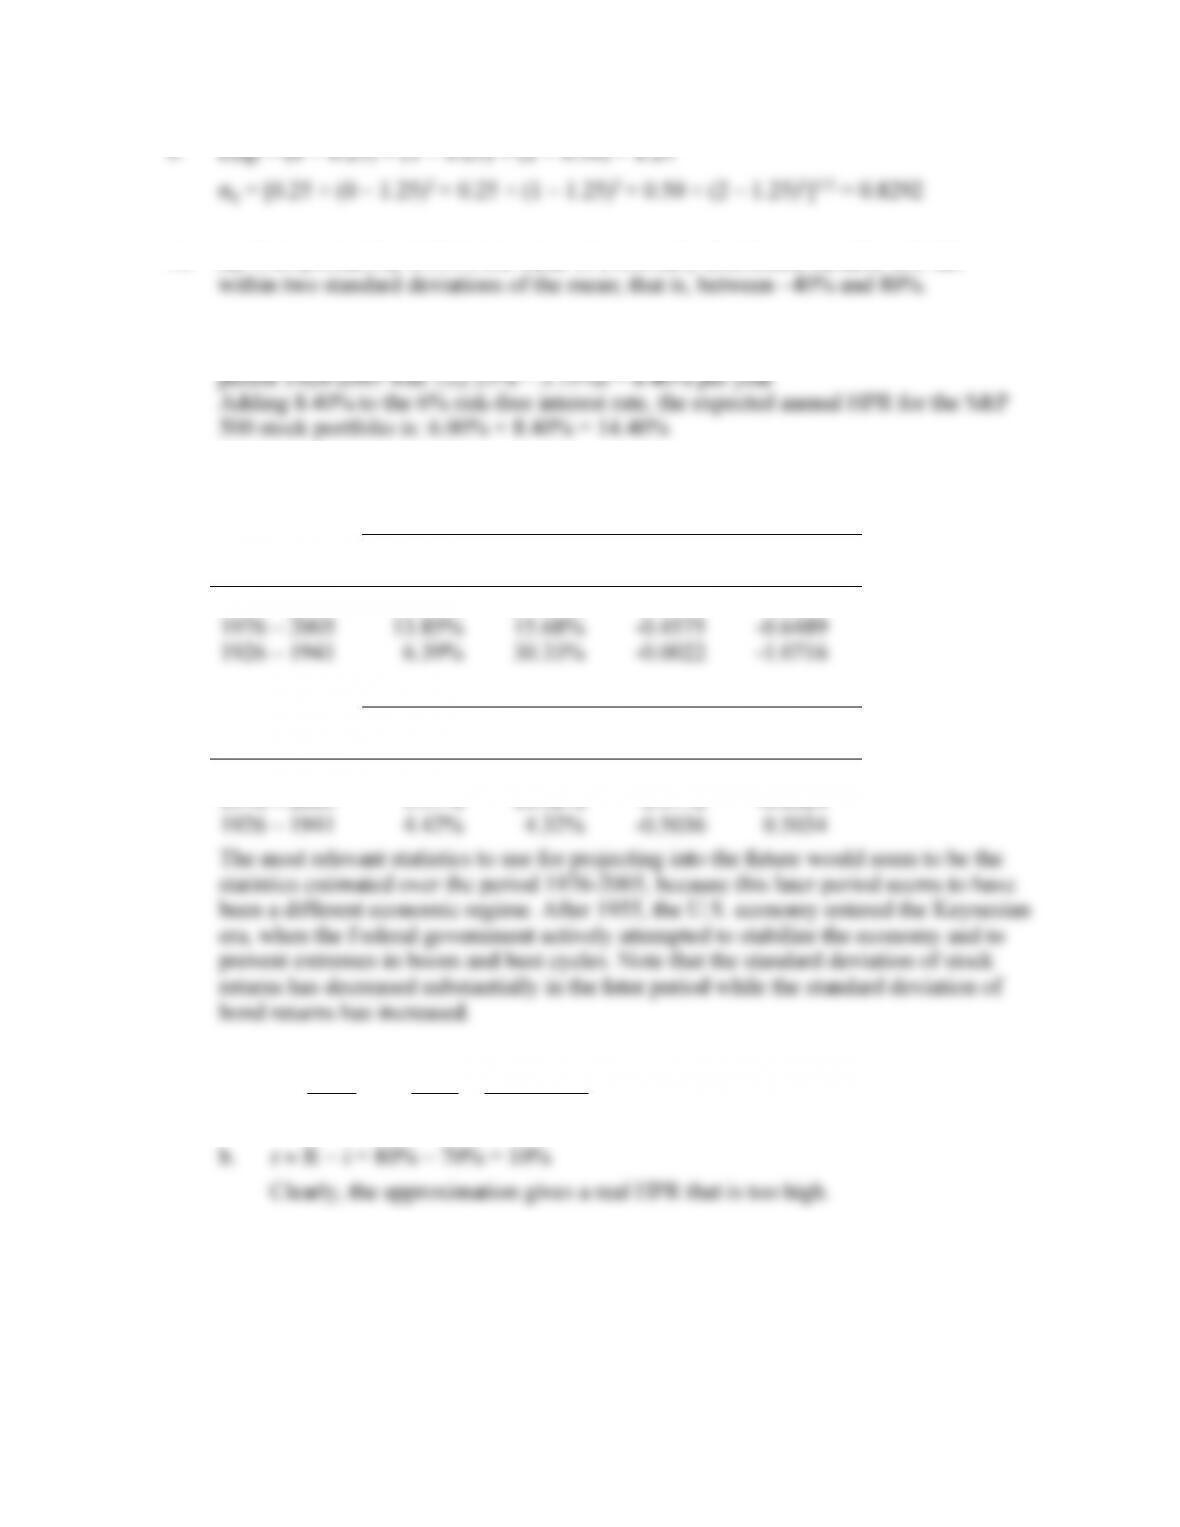
12. The average rates of return and standard deviations are quite different in the sub periods:
STOCKS
Mean
Standard
Deviation
Skewness
Kurtosis
1926 – 2005
12.15%
20.26%
-0.3605
-0.0673
1976 – 2005
13.85%
15.68%
-0.4575
-0.6489
1926 – 1941
6.39%
30.33%
-0.0022
-1.0716
BONDS
Mean
Standard
Deviation
Skewness
Kurtosis
1926 – 2005
5.68%
8.09%
0.9903
1.6314
1976 – 2005
9.57%
10.32%
0.3772
-0.0329
1926 – 1941
4.42%
4.32%
-0.5036
0.5034
13. a
%88.50588.0
70.1
70.080.0
i1
iR
1
i1
R1
r==
−
=
+
−
=−
+
+
=
Chapter 05 – Learning About Return and Risk from the Historical Record
14. From Table 5.2, the average real rate on T-bills has been: 0.72%
a. T-bills: 0.72% real rate + 3% inflation = 3.72%
15. Real interest rates are expected to rise. The investment activity will shift the demand
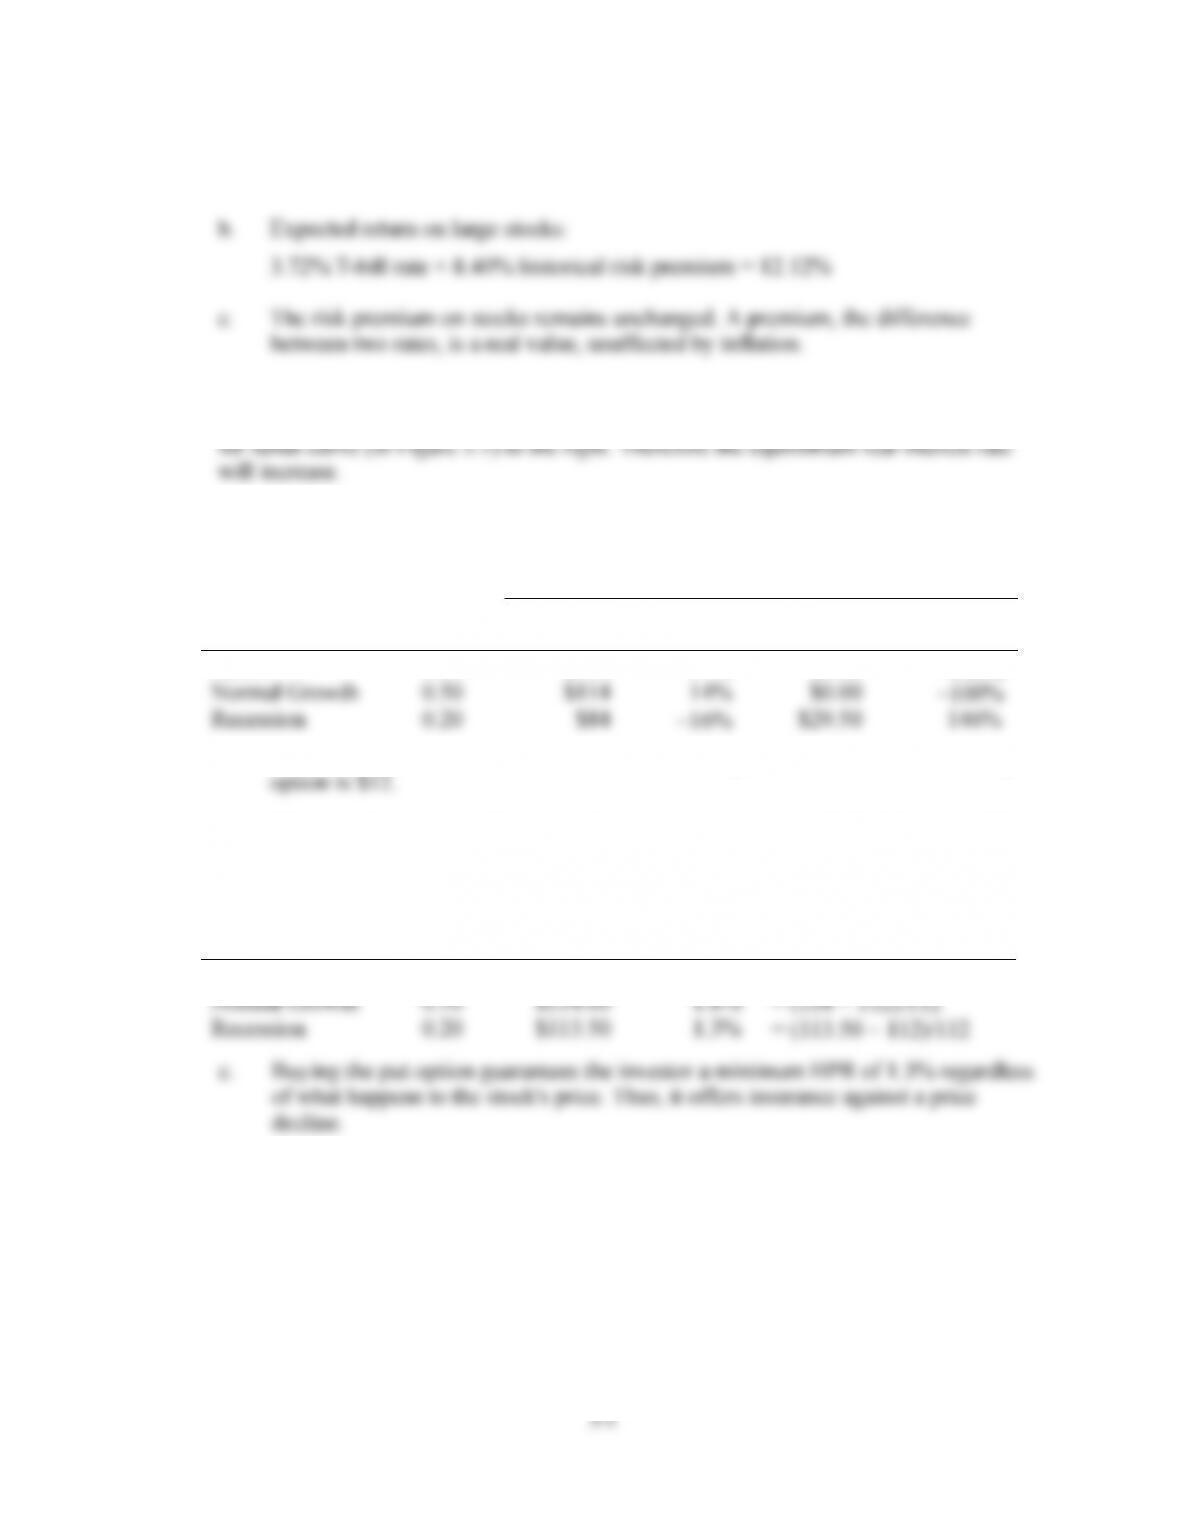
16. a. Probability Distribution of the HPR on the Stock Market and Put:
STOCK
PUT
State of the
Economy
Probability
Ending Price
+ Dividend
HPR
Ending Value
HPR
Boom
0.30
$134
34%
$0.00
−100%
Normal Growth
0.50
$114
14%
$0.00
−100%
Recession
0.20
$84
−16%
$29.50
146%
Remember that the cost of the index fund is $100 per share, and the cost of the put
b. The cost of one share of the index fund plus a put option is $112. The probability
distribution of the HPR on the portfolio is:
State of the
Economy
Probability
Ending Price
+ Put +
$4 Dividend
HPR
Boom
0.30
$134.00
19.6%
= (134 − 112)/112
Normal Growth
0.50
$114.00
1.8%
= (114 − 112)/112
Recession
0.20
$113.50
1.3%
= (113.50 − 112)/112
c. Buying the put option guarantees the investor a minimum HPR of 1.3% regardless
of what happens to the stock’s price. Thus, it offers insurance against a price
decline.