Forward rates and spot rates are related because forward rates can be derived from spot rates.
12. You are a financial consultant. At various times you have heard comments on interest
rates from one of your clients. How would you respond to each comment?
(a) Respond to: “The yield curve is upward-sloping today. This suggests that the market
consensus is that interest rates are expected to increase in the future.”
This is not necessarily true because investors demand a greater return as the maturity increases.
The maturity premium results from the fact that more uncertainty exists for longer term maturity.
(b) Respond to: “I can’t make any sense out of today’s term structure. For short-term
yields (up to three years) the spot rates increase with maturity; for maturities greater than
three years but less than eight years, the spot rates decline with maturity; and for
maturities greater than eight years the spot rates are virtually the same for each maturity.
There is simply no theory that explains a term structure with this shape.”
There are various theories that can account for any slope that the yield curve might take. First,
there is the pure expectations theory where the forward rates exclusively represent the expected
future rates. Since these rates can either increase or decrease for any time period, the yield curve
can be sloped upward or downward for that time period.
Second, there is the liquidity preference theory which asserts that investors do not like
uncertainty and so much be offered a higher rate of return for longer term maturities. Thus, the
©2013 Pearson Education
113
The market segmentation theory also recognizes that investors have preferred habitats dictated
by the nature of their liabilities. This theory also proposes that the major reason for the shape of
the yield curve lies in asset-liability management constraints (either regulatory or self-imposed)
and/or creditors (borrowers) restricting their lending (financing) to specific maturity sectors.
However, the market segmentation theory differs from the preferred habitat theory in that it
assumes that neither investors nor borrowers are willing to shift from one maturity sector to
another to take advantage of opportunities arising from differences between expectations and
forward rates. Thus for the segmentation theory, the shape of the yield curve is determined by
supply of and demand for securities within each maturity sector.
(c) Respond to: “When I want to determine the market’s consensus of future interest rates,
I calculate the forward rates.”
A future (expected) interest rate that can be computed from either the spot rates or the yield
curve is called a forward rate.
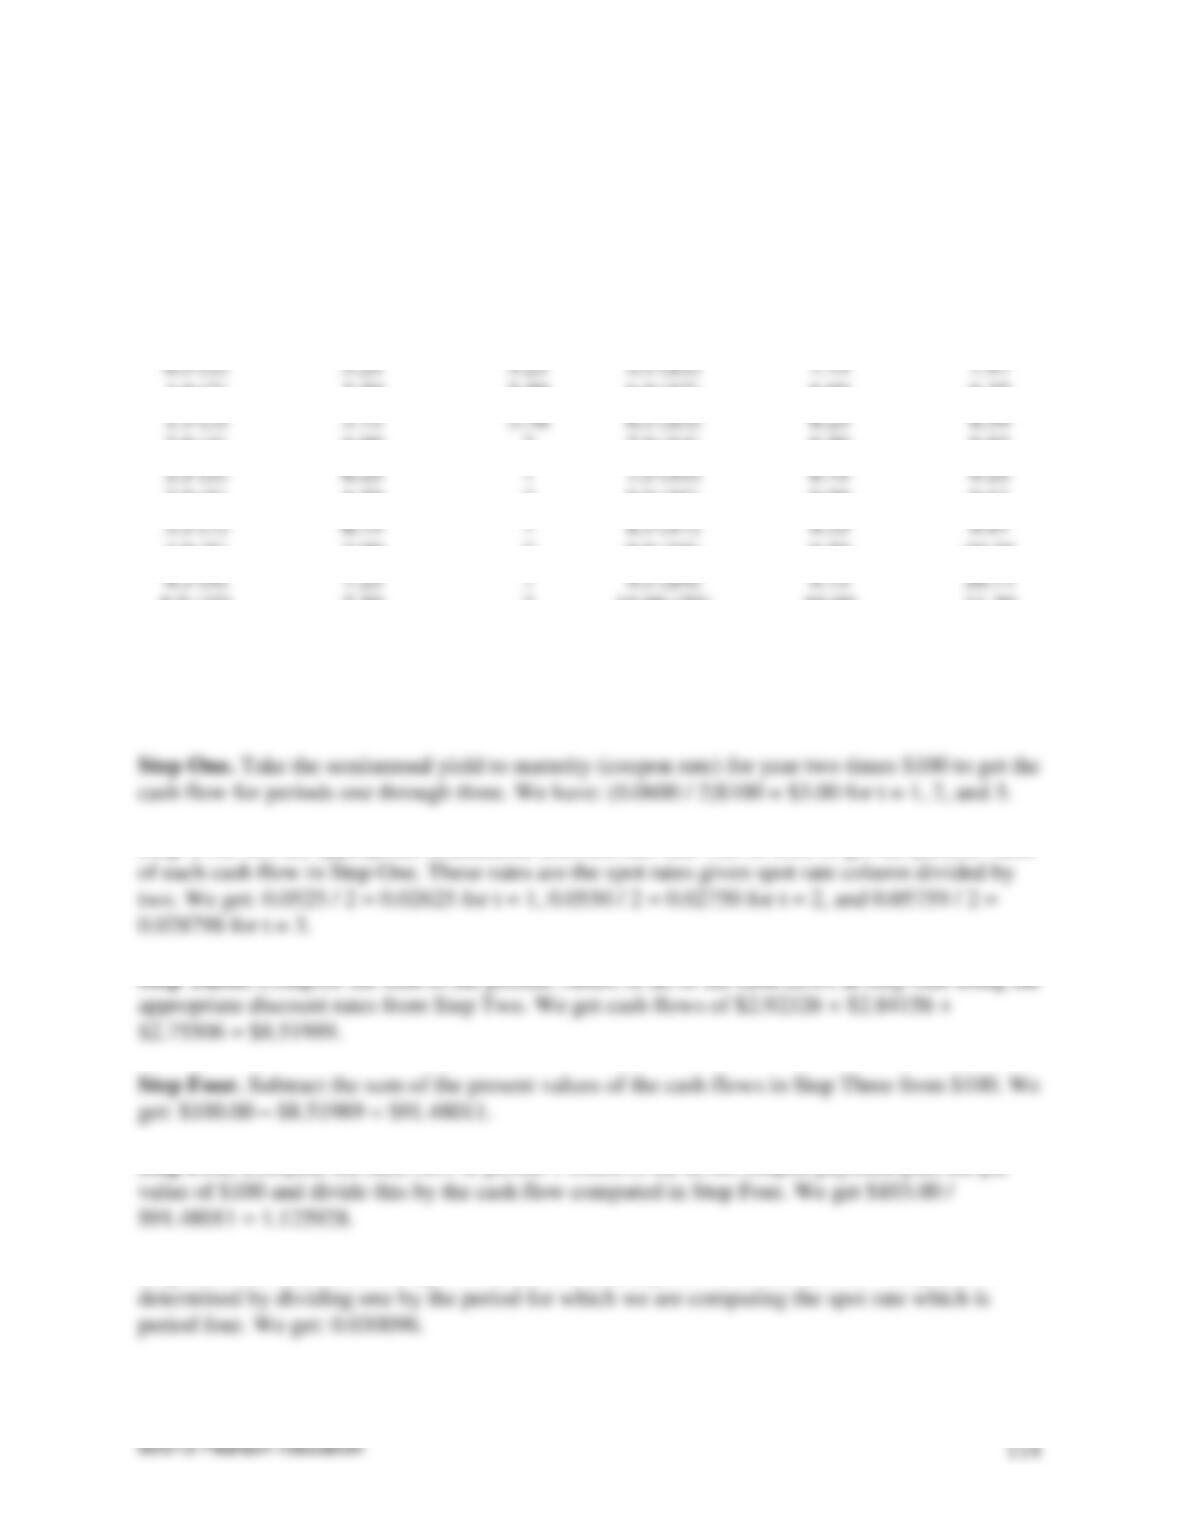
13. You observe the yields of the following Treasury securities at below (all yields are
shown on a bond-equivalent basis). All the securities maturing from 1.5 years on are selling
at par. The 0.5 and 1.0-year securities are zero-coupon instruments.
Year
(Period)
Yield to Maturity
(%)
Spot Rate
(%)
Year
(Period)
Yield to Maturity
(%)
Spot Rate
%
0.5 (1)
5.25
5.25
5.5 (11)
7.75
7.97
1.0 (2)
5.50
5.50
6.0 (12)
8.00
8.27
1.5 (3)
5.75
5.76
6.5 (13)
8.25
8.59
2.0 (4)
6.00
?
7.0 (14)
8.50
8.92
2.5 (5)
6.25
?
7.5 (15)
8.75
9.25
3.0 (6)
6.50
?
8.0 (16)
9.00
9.61
3.5 (7)
6.75
?
8.5 (17)
9.25
9.97
4.0 (8)
7.00
?
9.0 (18)
9.50
10.36
4.5 (9)
7.25
?
9.5 (19)
9.75
10.77
5.0 (10)
7.50
?
10.00 (20)
10.00
11.20
(a) Calculate the missing spot rates.
First, we compute the spot rate for year 2 by following the seven-step procedure given below.
Step Two. Get the appropriate semiannual discount rate that will be used to get the present value
Step Five. Compute the cash flow in period 4 which is the $3.00 coupon payment plus the par
Step Six. Take the value in Step Five to the one-fourth power and subtract one. The power is
©2013 Pearson Education
115
Step Seven. Convert the value in Step Six to the bond-equivalent rate by multiplying by two and
then converting to percentage form (by multiplying by 100). We get: 0.030096(2)(100) =
6.01917% or about 6.02%, which is the theoretical two-year spot rate.
We now compute the spot rate for year 2.5 in a like manner noting that we are now working with
one more period and using the spot rate just computed when discounting cash flows for period
four.
In Step One, we compute the cash flows for periods one through four using the semiannual
coupon rate of 6.25% / 2 = 3.125% or 0.03125 for year 2.5. We get $3.125 for each cash flow. In
We now compute the spot rate for period 3.0.
Similarly, we can compute the theoretical spot rates for the remaining four periods which are
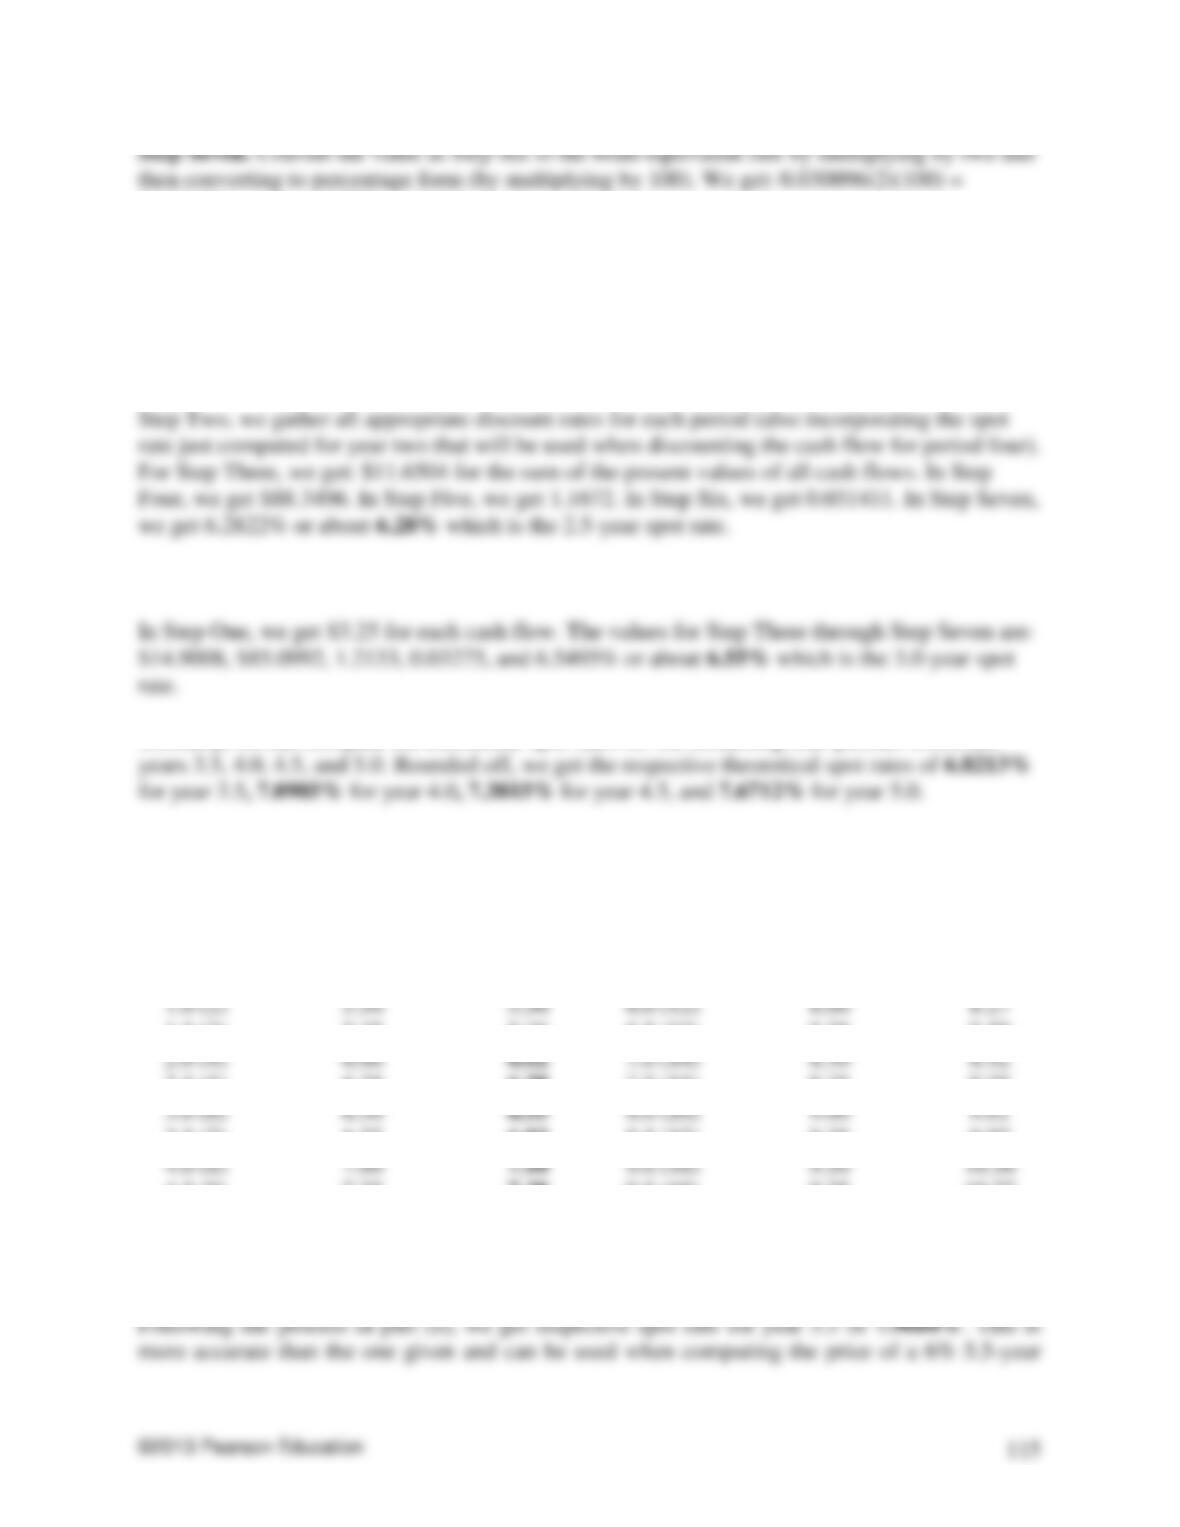
Below we fill in the missing spot rates in underlined, bold-face print (rounded-off to the nearest
0.01%). We have:
Year
(Period)
Yield to Maturity
(%)
Spot Rate
(%)
Year
(Period)
Yield to Maturity
(%)
Spot Rate
%
0.5 (1)
5.25
5.25
5.5 (11)
7.75
7.97
1.0 (2)
5.50
5.50
6.0 (12)
8.00
8.27
1.5 (3)
5.75
5.76
6.5 (13)
8.25
8.59
2.0 (4)
6.00
6.02
7.0 (14)
8.50
8.92
2.5 (5)
6.25
6.28
7.5 (15)
8.75
9.25
3.0 (6)
6.50
6.55
8.0 (16)
9.00
9.61
3.5 (7)
6.75
6.82
8.5 (17)
9.25
9.97
4.0 (8)
7.00
7.10
9.0 (18)
9.50
10.36
4.5 (9)
7.25
7.38
9.5 (19)
9.75
10.77
5.0 (10)
7.50
7.67
10.00 (20)
10.00
11.20
(b) What should the price of a 6% 5.5-year Treasury security be?
Treasury security because we have to discount the cash flows for period eleven by the
appropriate discount rate (which are the theoretical spot rate for this period). With the eleven
(c) What is the six-month forward rate starting in the seventh year?
The six-month forward rate for period fourteen can be computed by knowing the spot rates for
will satisfy the following equation:
( )
15
15
11
z
+−

14. You observe the following Treasury yields (all yields are shown on a bond equivalent
basis):
Year (Period)
Yield to Maturity (%)
Spot Rate (%)
0.5 (1)
10.00
10.00
1.0 (2)
9.75
9.75
1.5 (3)
9.50
9.48
2.0 (4)
9.25
9.22
2.5 (5)
9.00
8.95
3.0 (6)
8.75
?
3.5 (7)
8.50
?
4.0 (8)
8.25
8.14
4.5 (9)
8.00
7.86
5.0 (10)
7.75
7.58
5.5 (11)
7.50
7.30
6.0 (12)
7.25
7.02
6.5 (13)
7.00
6.74
7.0 (14)
6.75
6.46
7.5 (15)
6.50
6.18
8.0 (16)
6.25
5.90
8.5 (17)
6.00
5.62
9.0 (18)
5.75
5.35
9.5 (19)
5.50
5.07
10.0 (20)
5.25
4.80
All the securities maturing from 1.5 years on are selling at par. The 0.5 and 1.0-year
securities are zero-coupon instruments. Answer the following questions.
(a) Calculate the missing spot rates.

©2013 Pearson Education
118
Step Five. Compute the cash flow in period 6 which is the $4.375 coupon payment plus the par
value of $100 and divide this by the cash flow computed in Step Four. We get $104.375/
$80.8799 = 1.2905.
Step Six. Take the value in Step Five to the one-sixth power and subtract one. The one-sixth
8.6841% or about 8.68%, which is the theoretical 3-year spot rate.
8.4117%. Thus, the theoretical 10-year spot rate is about 8.41%.
(b) What should the price of a 6% four-year Treasury security be?
The price of a 6% four-year Treasure security is the present value of its cash flows. Per $100 par
value, each cash flow is the semiannual coupon payment of $100(0.06 / 2) = $3.00. There will be
15. What Treasury issues can be used to construct the theoretical spot rate curve?
A default-free theoretical spot rate curve can be constructed from the yield on Treasury securities.
The Treasury issues that are candidates for inclusion are (i) on-the-run Treasury issues, (ii) on-the-
16. What are the problems with using only on-the-run Treasury issues to construct the
theoretical spot rate curve?
©2013 Pearson Education
119
some of the maturities points, which may result in misleading yields for those maturity points
when estimated using the linear interpolation method. Second, the yields for the on-the-run
issues may be misleading because most offer the favorable financing opportunity in the repo
market.
17. When all Treasury issues are used to construct the theoretical spot rate curve, what
methodology is used to construct the curve?
The extrapolation method can be used to form the on-the-run or par coupon curve from on-the-
run observed Treasury yields (for each on-the-run coupon issue, the estimated yield necessary to
yield at higher maturity yield at lower maturity
number of semiannual period between the two maturity points
−
.
Then, the yield for all intermediate semiannual maturity points is found by adding to the yield at
the lower maturity the amount computed here.
To overcome these problems, we convert the par yield curve into the theoretical spot rate curve
using bootstrapping. To explain the process of estimating the theoretical spot rate curve from
observed yields on Treasury securities, consider a six-month Treasury bill where its annualized
yield is the six-month spot rate and a one-year Treasury where its annualized yield is the one
Answer the below questions.
(a) What are the limitations of using Treasury strips to construct the theoretical spot rate
curve?
There are three problems with using the observed rates on strips. First, the liquidity of the strips

©2013 Pearson Education
120
market is not as great as that of the Treasury coupon market. Thus, the observed rates on strips
reflect a premium for liquidity. Second, the tax treatment of strips is different from that of
Treasury coupon securities. Specifically, the accrued interest on strips is taxed even though no
cash is received by the investor. Finally, there are maturity sectors in which non-U.S. investors
find it advantageous to trade off yield for tax advantages associated with a strip.
(b) When Treasury strips are used to construct the curve, why are only coupon strips used?
By using only coupon strips, the biases would be consistent in terms of liquidity, tax treatment,
and international demand factors. Also, simply using observed Treasury coupon strips is easier
18. What actions force a Treasury’s bond price to be valued in the market at the present
value of the cash flows discounted at the Treasury spot rates?
The price of a Treasury security should be equal to the present value of its cash flow where each
cash flow is discounted at the theoretical spot rates. If this does not occur then an arbitrage
19. Explain the role that forward rates play in making investment decisions.
Although a forward rate may never be realized in practice, it is still important for investors
20.“Forward rates are poor predictors of the actual future rates that are realized.
Consequently, they are of little value to an investor.” Explain why you agree or disagree with
this statement.
To see the importance of knowing the market’s consensus for future interest rates, consider the
©2013 Pearson Education
121
Alternative 1 is to buy a one-year instrument. Alternative 2 is to buy a six-month instrument and
then reinvest its value by purchasing another six-month instrument. With alternative 1, the
investor will realize the one-year spot rate and that rate is known with certainty. In contrast, with
alternative 2, the investor will realize the six-month spot rate, but the six-month rate six months
from now is unknown. Therefore, for alternative 2, the rate that will be earned over one year is
not known with certainty. The forward rate is the rate that will make the two alternatives equal.
This rate is referred to as the market’s expected future six-month spot rate six months from now.
By knowing this rate, an investor can make a decision as to what (s)he thinks about future spot
rates. For example, suppose the investor expects that six months from now, the six-month rate
will be lower than the forward rate. If so, then the investor will choose alternative 1. Thus,
knowing the forward rate does have practical value for an investor even if the forward rate is
hindsight is not accurate.
21. Bart Simpson is considering two alternative investments. The first alternative is to
invest in an instrument that matures in two years. The second alternative is to invest in an
instrument that matures in one year and at the end of one year, reinvest the proceeds in
a one-year instrument. He believes that one-year interest rates one year from now will be
higher than they are today and therefore is leaning in favor of the second alternative. What
would you recommend to Bart Simpson?
22. Answer the below questions.
(a) What is the common hypothesis about the behavior of short-term forward rates shared
by the various forms of the expectations theory?
There are several forms of the expectations theory: pure expectations theory, liquidity theory,
and preferred habitat theory. Expectations theories share a hypothesis about the behavior of
©2013 Pearson Education
122
systematic factors other than expected future short-term rates affect forward rates; the liquidity
theory and the preferred habitat theory assert that there are other factors. Accordingly, the last
two forms of the expectations theory are sometimes referred to as biased expectations theories.
(b) What is price risk and reinvestment risk and how do these two risks affect the pure
expectations theory?
There are two risks that cause uncertainty about the return over some investment horizon: price
risk and reinvestment risk. Let’s begin by describe price risk.
Price risk is the uncertainty about the price of the bond at the end of the investment horizon. For
example, an investor who plans to invest for four years might consider the following three
The second risk has to do with the uncertainty about the rate at which the proceeds from a bond
can be reinvested until the expected maturity date: that is, reinvestment risk. For example, an
(c) Give three interpretations of the pure expectations theory.
There are several interpretations of the pure expectations theory that have been put forth by
economists. These interpretations are not exact equivalents nor are they consistent with each

©2013 Pearson Education
123
years because the investor expects the return from all three bonds to be the same over five years.
A major criticism of this very broad interpretation of the theory is that, because of price risk
associated with investing in bonds with a maturity greater than the investment horizon, the
expected returns from these three very different bond investments could differ in significant
ways.
A second interpretation, referred to as the local expectations theory, a form of pure expectations
theory, suggests that the returns on bonds of different maturities will be the same over a
short-term investment horizon. For example, if an investor has a six-month investment horizon,
buying a 5-year, 10-year, or 20-year bond will produce the same six-month return. It has been
demonstrated that the local expectations formulation, which is narrow in scope, is the only one of
the interpretations of the pure expectations theory that can be sustained in equilibrium.
A third interpretation of the pure expectations theory suggests that the return that an investor will
realize by rolling over short-term bonds to some investment horizon will be the same as holding
a zero-coupon bond with a maturity that is the same as that investment horizon. (Because a
zero-coupon bond has no reinvestment risk, future interest rates over the investment horizon do
not affect the return.) This variant is called the return-to-maturity expectations interpretation. For
example, let’s assume that an investor has a five–year investment horizon. By buying a five-year
zero-coupon bond and holding it to maturity, the investor’s return is the difference between the
maturity value and the price of the bond, all divided by the price of the bond. According to
return-to-maturity expectations, the same return will be realized by buying a six-month
instrument and rolling it over for five years. Most people have grave problems with the validity
of this theory simply due to the unknown nature of future interest rates when assets are rolled
over.
23. Answer the below questions.
(a) What are the two biased expectations theories about the term structure of interest
rates?
The two biased expectations theories are the liquidity theory and the preferred habitat theory.
(b) What are the underlying hypotheses of these two theories?
The liquidity theory states that investors will hold longer-term maturities if they are offered a
long-term rate higher than the average of expected future rates by a risk premium that is
©2013 Pearson Education
124
theory differs from the preferred habitat theory in that it assumes that neither investors nor
borrowers are willing to shift from one maturity sector to another to take advantage of
opportunities arising from differences between expectations and forward rates.
24. Answer the below questions.
(a) “Empirical evidence suggests that with respect to bond risk premiums that influence the
shape of the Treasury yield curve, there is a linear relationship between Treasury average
returns and duration.” Explain whether you agree or disagree with this statement. If you
disagree, explain the type of relationship that has been observed.
Based on empirical evidence, one would disagree with the statement because it has been shown
that there is a nonlinear relation between Treasury average returns (as represented by bond risk
premium) and duration (which is a measure of the price sensitivity of a bond to changes in
(b) What is meant by the “convexity bias” influence on the shape of the Treasury yield
curve?
Empirical evidence suggests that the three main influences on the shape of the Treasury yield
curve are (1) the market’s expectations of future rate changes, (2) bond risk premiums, and
(3) convexity bias. The convexity bias influence, according to Ilmanen, is the least well known

©2013 Pearson Education
125
returns. This influence on the shape of the Treasury yield curve is what is referred to as the
convexity bias.
25. Answer the below questions.
a. What is meant by the swap rate?
b. What is meant by the swap curve?
The relationship between the swap rate and maturity of a swap is called the swap rate yield
c. Explain whether you agree or disagree with the following statement: “A country’s swap
curve is a default-free yield curve.”
The swap rate yield curve, or simply swap curve or LIBOR curve, provides information about
interest rates in a country and is used as an interest rate benchmark. This swap curve is not
26. Why do market participants in some countries prefer to use the swap curve rather than
the government bond yield curve?
In many countries, market participants use the country’s swap curve as the benchmark interest
rates rather than the country’s government bond yield curve. In recent years the liquidity of the
First, there may be technical reasons why within a government bond market some of the interest
rates may not be representative of the true interest rate but instead be biased by some technical or

27. A client observes that a corporate bond that he is interested in purchasing with a triple
A rating has a benchmark spread that is positive when the benchmark is U.S. Treasuries
but negative when the benchmark is the LIBOR curve. The client asks you why. Provide an
28. You are given the cash inflow at the end of each year from the table for Bond A, B and
C. Calculate the 1-year, 2 year and 3 year spot rates by assuming any cash flow would be
compounded annually, and the prices of bond A, B and C are $100, $100 and $96 at the
beginning of year 1.
Bond/
Year 1
Year 2
Year 3
After year 3
A
105
0
0
0
B
6
106
0
0
C
4
4
104
0
Price of bond A (PA) gives the one-year spot rate directly:
With z1 =5% and PB = 100 , we can then estimate r2:
Thus, z2 = 6.0303%