
5-1
Operating and Financial Leverage
Author’s Overview
Though the student has probably covered break-even analysis in other courses, the material in
Chapter 5 offers an opportunity to more fully explore the financial effects of all forms of leverage on
the firm. The contrast between aggressive and conservative approaches should be emphasized,
particularly through the useful technique of computing degrees of leverage. This chapter also serves
as a good basis for much of the later discussion in the text on the cost of capital. The student begins
to appreciate the positive benefits of debt, but also realizes that unlimited use of debt increases the
financial risk of the firm and perhaps the cost of various other sources of financing.
Chapter Concepts
LO2. Break-even analysis allows the firm to determine the magnitude of operations necessary to
avoid loss.
LO4. Financial leverage shows how much debt the firm employs in its capital structure.
LO6. By increasing leverage, the firm increases its profit potential, but also its risk of failure.
5
5-2
Annotated Outline and Strategy
Perspective 5-1: The introduction emphasizes the airline industry as an industry that has both
high operational leverage and high financial leverage. The bankruptcy of most U.S. air carriers
should get across the point that leverage has its risk and that this chapter is very important for
anyone who intends to be a financial analyst or stock investor.
I. Leverage in a Business: The use of fixed charge obligations with the intent of magnifying
the potential return to the firm.
A. Fixed operating costs: Those operating costs, such as rent, depreciation, property
II. Operating Leverage: The extent to which fixed assets and associated fixed costs are utilized
in the business.
A. Break-even analysis: A numerical and graphical technique used to determine at what
point the firm will break even.
1. Break-even point: the unit sales where total revenue = total costs
2. Contribution margin per unit is sales price (per unit) minus variable costs per
PPT Break-Even Chart: Leveraged Firm (Figure 5-1)
Perspective 5-2: Establish factors related to break-even analysis by illustrating the operations of a
highly leveraged firm versus a conservative firm by using Figures 5-1 and 5-2 and Tables 5-2 and 5-
3.
PPT Volume-Cost-Profit Analysis: Leveraged Firm (Table 5-2)
BE = Fixed costs
Contribution margin =Fixed costs
Price – Variable cost per unit =FC
P – VC
5-3
B. A More Conservative Approach: A firm not willing to accept the additional risk of a
higher degree of operating leverage will only commit to a lower level of fixed costs,
and thus will operate further away from the break-even point. Profits will grow at a
slower rate, but if volume shrinks, there is more room to decline before hitting the
break-even point and beginning to show losses.
PPT Break-Even Chart: Conservative Firm (Figure 5-2)
PPT Volume-Cost-Profit Analysis: Conservative Firm (Table 5-3)
C. The Risk Factor: The risk factor in using financial leverage depends on the firm’s
operations relative to its break-even point and its operating leverage. How close to
D. Cash Break-Even Analysis
1. Deducting noncash fixed expenses such as depreciation in the break-even
analysis enables one to determine the break-even point on a cash basis.
2. Cash break-even point formula:
Cash BE = Fixed costs – (Noncash fixed costs)
Price – Variable cost per unit
3. Although cash break-even analysis provides additional insight, the emphasis
in the chapter is on the more traditional accounting data–related break-even
analysis.
E. Degree of Operating Leverage: A reflection of the extent fixed assets and fixed costs
are utilized in the business firm. The employment of operating leverage causes
operating profit to be more sensitive to changes in sales.
2. The amount of leverage employed depends on anticipated economic
3. The sensitivity of a firm’s operating profit to a change in sales as a result of
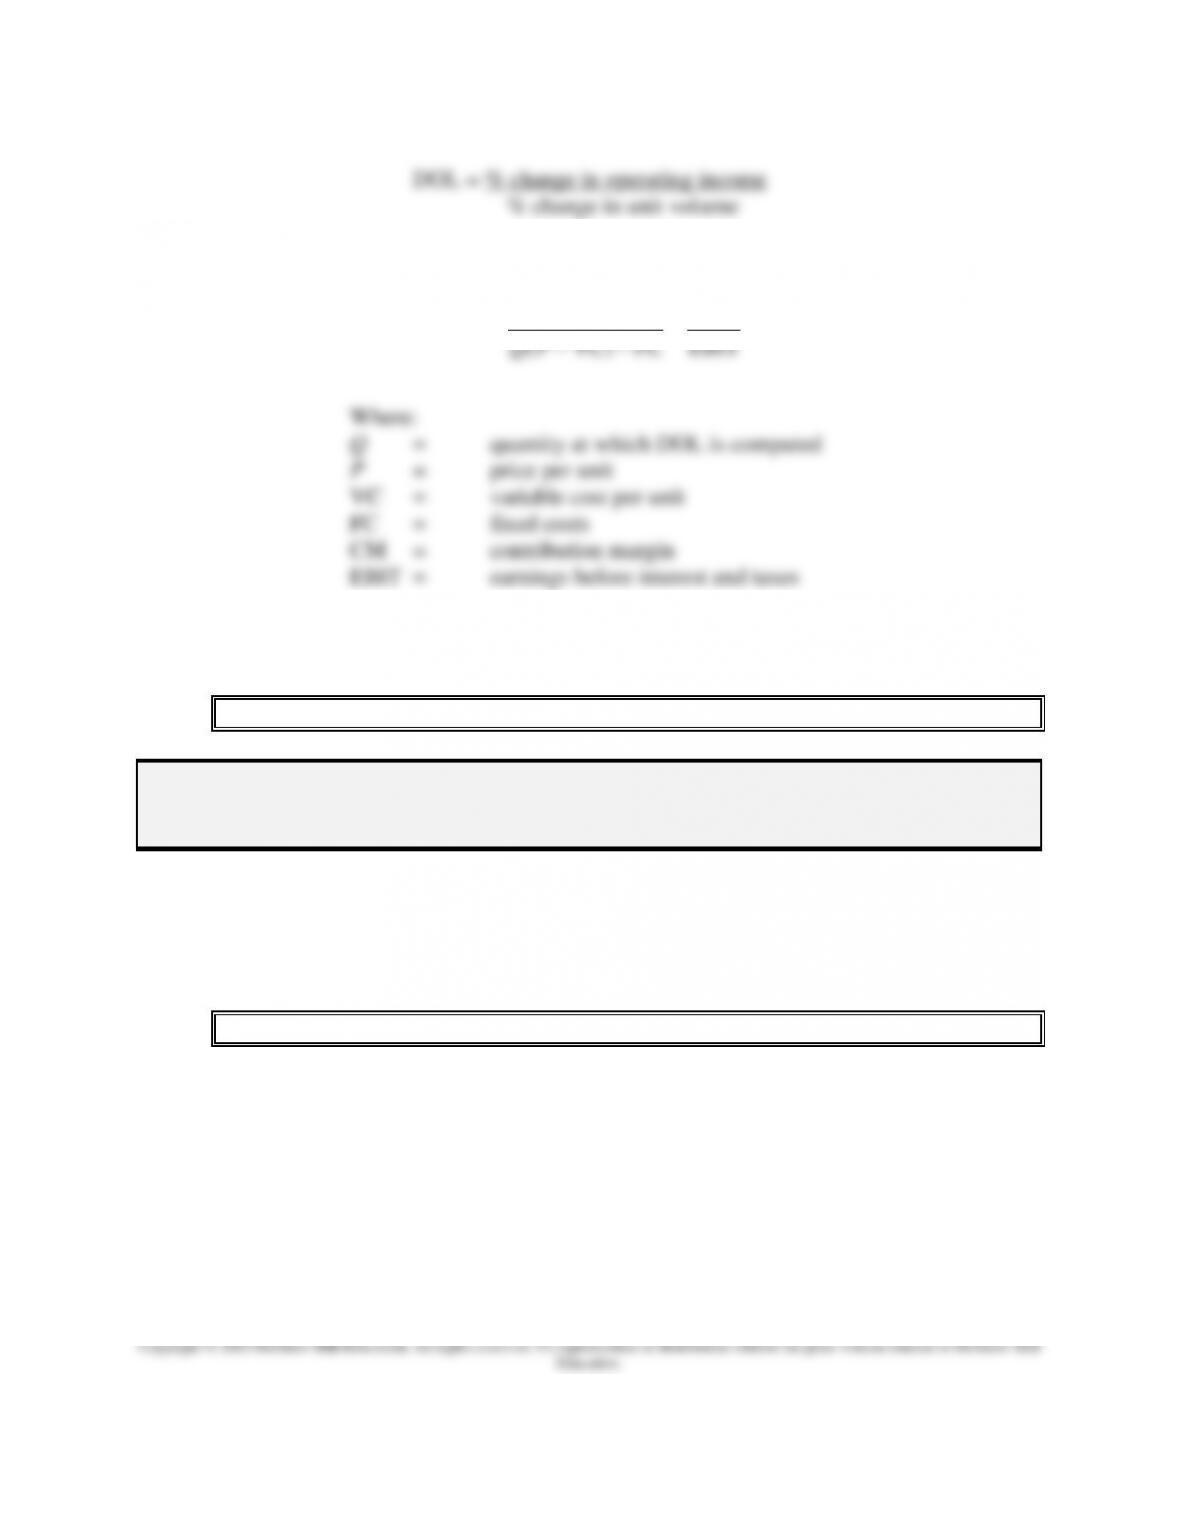
4. Degree of operating leverage (DOL) is defined as the ratio of percentage
change in operating income in response to percentage change in units sold.
5-4
5. The DOL may also be computed using the formula:
6. DOL and other measures of leverage always apply to the starting point for
the range used in the computation.
PPT Operating Income or Loss (Table 5-4)
Perspective 5-3: DOL can easily be computed from the summary data on the leveraged and
conservative firm. Summary data are presented in Table 5-4 and are drawn from Tables 5-2 and
Table 5-3.
F. Limitations of Analysis: The normal assumption in doing break-even analysis is that
a linear function exists for revenues and costs as volume changes. This is probably
reasonable over a relevant range. However, for more extreme levels of operations,
some nonlinearity may exist, resulting in revenue weakness and cost overruns.
PPT Nonlinear Break-Even Analysis (Figure 5-3)
III. Financial Leverage: A measure of the amount of debt used in the capital structure of the
firm. While operating leverage primarily pertains to the left-hand side of the balance sheet
(assets and associated costs), financial leverage deals with the right-hand side of the balance
sheet (liabilities and net worth).
A. Impact on Earnings:
1. Two firms may have the same operating income but greatly different net
( VC) CM
DOL = =
( VC) FC EBIT
QP
QP
−
−−
5-5
2. Financial leverage is beneficial only if the firm can employ the borrowed
funds to earn a higher rate of return than the interest rate on the borrowed
B. Degree of Financial Leverage: DFL is the ratio of the percentage change in earnings
per share in response to a percentage change in EBIT.
1. The DFL may also be computed utilizing the following formula:
2. The DFL is associated with a specific level of EBIT and changes as EBIT
changes.
Perspective 5-4: The impact of financial leverage can also be viewed in Figure 5-4.
PPT Impact of Financial Plan on Earnings per Share (Table 5-5)
PPT Financing Plans and Earnings per Share (Figure 5-4)
C. Limitations to Use of Financial Leverage:
1. As the firm becomes more highly leveraged and creditors take on more risk,
2. As the risk to the stockholders increases with leverage, their required rate of
EBITin change %
EPSin change %
= DFL
return increases and stock prices may decline.
IV. Combining Operating and Financial Leverage
A. Combining operating and financial leverage provides maximum magnification of
returns, but it also magnifies the risk.
B. The combined leverage effect can be illustrated through the income statement.
PPT Income Statement (Table 5-6)
Perspective 5-5: Operating income is the end result of operating leverage and the beginning factor
for financial leverage (in the form of earnings before interest and taxes). These relationships are
further enforced through Figure 5-5.
PPT Combining Operating and Financial Leverage (Figure 5-5)
PPT Operating and Financial Leverage (Table 5-7)
V. Degree of Combined Leverage
A. The degree of combined leverage (DCL) is a measure of the effect on net income as a
result of a change in sales. The DCL is computed similarly to DOL or DFL.
B. The DCL may also be computed as follows:
Perspective 5-6: Reinforce the interactive nature of the various forms of leverage. Many firms in
the Japanese economy use both high operating and financial leverages. Because of their high
salesin change %
EPSin change %
= DCL
DCL = Q(P– VC)
Q(P –VC) –FC –I=CM
EBT
Finance in Action: Give Shareholders a Slice of the Apple and Leverage Rises
The Apple Computer company example illustrates the rise of cash that resulted from a series of
blockbuster product sales (i.e., iPod and iPhone). Apple was able to grow its cash flow from
Other Chapter Supplements
Cases for Use with Foundations of Financial Management
Case 3, Glen Mount Furniture Company (financial leverage)
Case 4, Genuine Motor Products (combined leverage)