
Genuine Motor Products
Case 4
Combined Leverage
Purpose: The case illustrates the potential impact on a company when it goes from dependence on labor
intensive variable costs to fixed cost automation. The effects are further highlighted when the new
equipment is heavily financed by debt. The upside is emphasized through increased earnings per share,
while the downside is related to a higher break-even level (an expanded definition of cash flow break-
even is introduced and very carefully explained). Not only are earnings per share and break-even
covered, but so are all the various measures of degree of leverage. In addition to numerous calculations,
the student is called upon to make judgmental decisions as an aggressive industrial engineer comes into
conflict with a conservative chief financial officer.
Relation to Text: The case should follow Chapter 5.
Complexity: The case is moderately complex. It should require 1 – 1½ hours.
Solutions
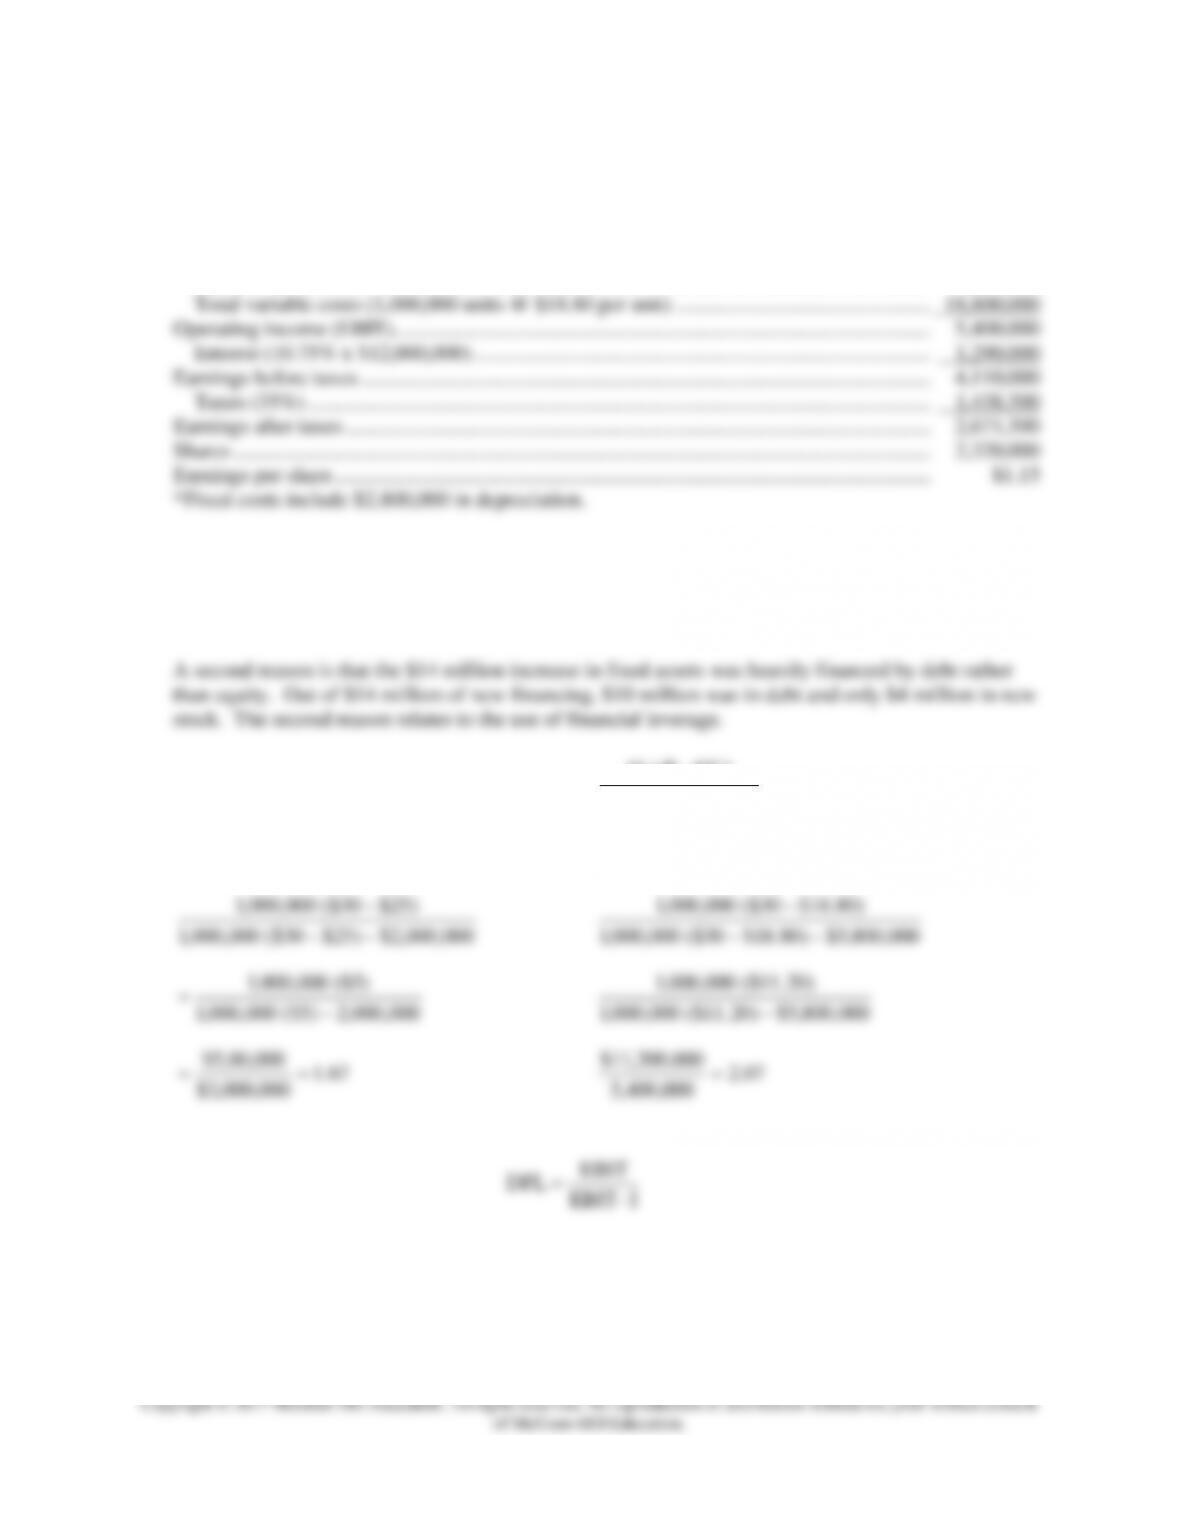
1. Figure 4
Sales (1,000,000 units @ $30 per unit) …………………………………………………………………………
$30,000,000
Fixed costs* …………………………………………………………………………………………………………..
5,800,000
Total variable costs (1,000,000 units @ $18.80 per unit) …………………………………………….
18,800,000
Operating income (EBIT) ……………………………………………………………………………………………
5,400,000
Interest (10.75% x $12,000,000) ………………………………………………………………………………
1,290,000
Earnings before taxes …………………………………………………………………………………………………
4,110,000
Taxes (35%) ………………………………………………………………………………………………………….
1,438,500
Earnings after taxes ……………………………………………………………………………………………………
2,671,500
Shares ………………………………………………………………………………………………………………………
2,320,000
Earnings per share ……………………………………………………………………………………………………..
$1.15
*Fixed costs include $2,800,000 in depreciation.
2. The first reason earnings per share has increased from $.91 to $1.15 relates to automation. That is
even though fixed costs have gone up, total variable costs have gone down by even more. Thus,
automation has lead to an increase in operating income from $3,000,000 to $5,400,000. This first
reason relates to the use of operating leverage.
A second reason is that the $14 million increase in fixed assets was heavily financed by debt rather
( )
3. DOL ( )
Q P VC
Q P VC FC
−
=−−
Before (Figure 2)
After (Figure 4)
67.1
000,000,3$
000,00,5$
000,000,2)5($000,000,1
)5($000,000,1
000,000,2$)25$30($000,000,1
)25$30($000,000,1
==
−
=
−−
−
07.2
000,400,5
000,200,11$
000,800,5$)20.11($000,000,1
)20.11($000,000,1
000,800,5$)80.18$30($000,000,1
)80.18$30($000,000,1
=
−
−−
−
I–EBIT
EBIT
DFL =
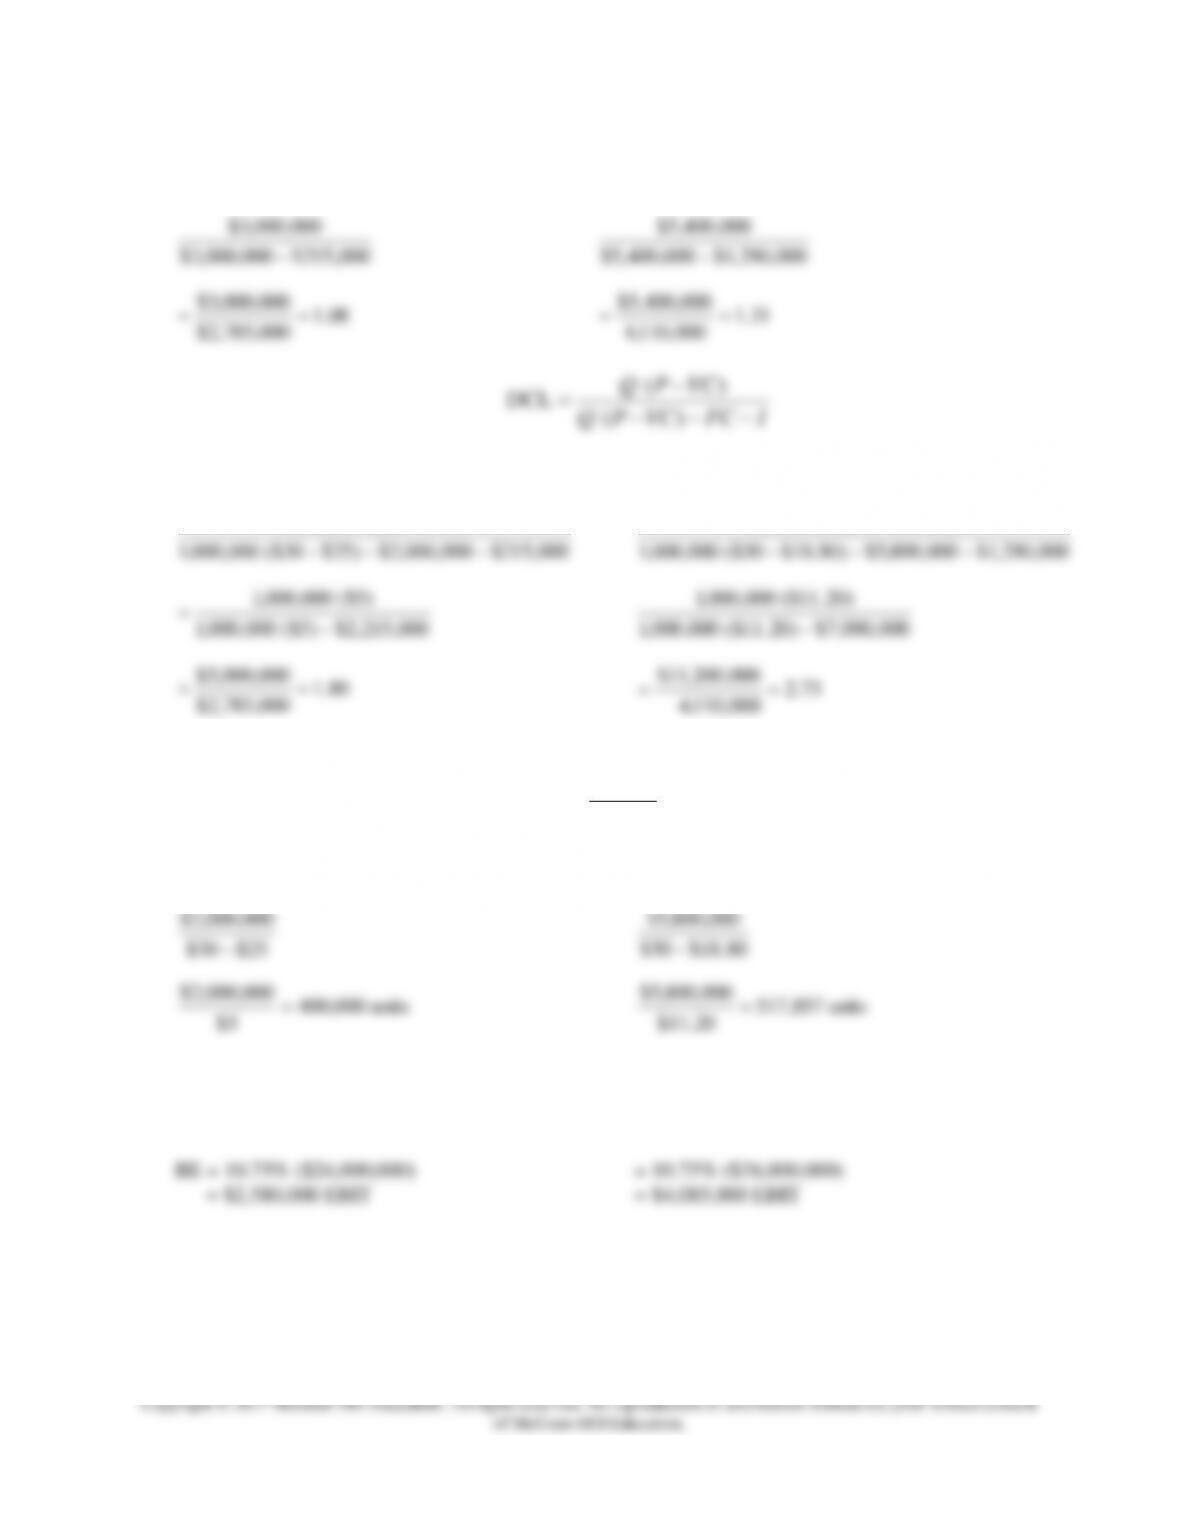
Before (Figure 2)
After (Figure 4)
08.1
000,785,2$
000,000,3$
000,215$000,000,3$
000,000,3$
==
−
31.1
000,110,4
000,400,5$
000,290,1$000,400,5$
000,400,5$
==
−
( )
DCL ( )
Q P VC
Q P VC FC I
−
=− − −
Before (Figure 2)
After (Figure 4)
80.1
000,785,2$
000,000,5$
000,215,2$)5($000,000,1
)5($000,000,1
000,215$000,000,2$)25$30($000,000,1
)25$30($000,000,1
==
−
=
−−−
−
73.2
000,110,4
000,200,11$
000,090,7$)20.11($000,000,1
)20.11($000,000,1
000,290,1$000,800,5$)80.18$30($000,000,1
)80.18$30($000,000,1
==
−
−−−
−
4. Operating BE FC
P VC
=−
Before (Figure 2)
After (Figure 4)
units 000,400
5$
000,000,2$
25$30$
000,000,2$
=
−
units 857,517
20.11$
000,800,5$
80.18$30$
000,800,5$
=
−
Financial BE = Interest rate % × Assets financed
Before
After new assets purchased
BE = 10.75% ($24,000,000)
= 10.75% ($38,000,000)
= $2,580,000 EBIT
= $4,085,000 EBIT
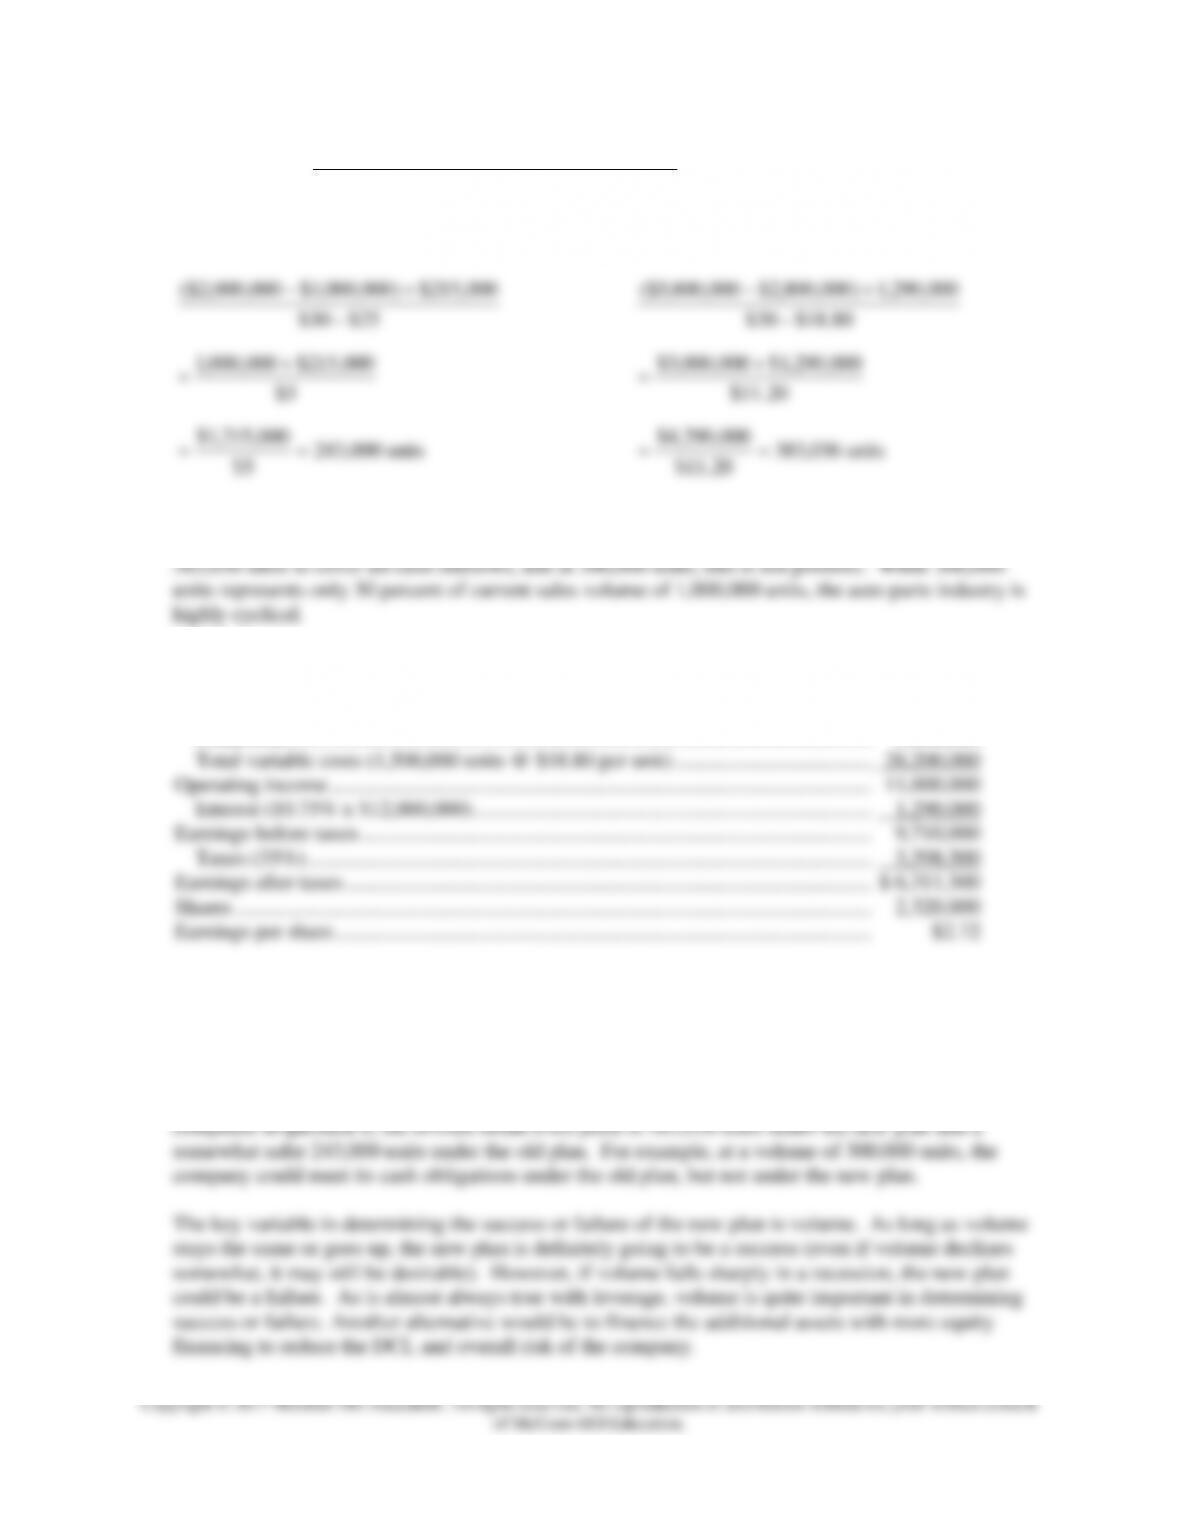
(Fixed costs Depreciation) Interest
5. Revised BE Price ( ) ( ) Variable cost per unitP VC
−+
=−
Before (Figure 2)
After (Figure 4)
units 000,243
5$
000,215,1$
5$
000,215$000,000,1
25$30$
000,215$)000,000,1$000,000,2($
==
+
=
−
+−
units 036,383
20.11$
000,290,4$
20.11$
000,290,1$000,000,3$
80.18$30$
000,290,1)000,800,2$000,800,5($
==
+
=
−
+−
6. Using the revised break-even analysis from question 5, the company would be in trouble. It requires
7.
Earnings per share at 1,500,000 units
Sales (1,500,000 units @ $30 per unit) …………………………………………………………….
$45,000,000
Fixed costs ………………………………………………………………………………………………..
5,800,000
Total variable costs (1,500,000 units @ $18.80 per unit) ………………………………..
28,200,000
Operating income ………………………………………………………………………………………….
11,000,000
Interest (10.75% x $12,000,000) ………………………………………………………………….
1,290,000
Earnings before taxes …………………………………………………………………………………….
9,710,000
Taxes (35%) ……………………………………………………………………………………………..
3,398,500
Earnings after taxes ……………………………………………………………………………………….
$ 6,311,500
Shares ………………………………………………………………………………………………………….
2,320,000
Earnings per share …………………………………………………………………………………………
$2.72
8. There is no correct answer as to who is right. The changes that Mike Anton suggests will definitely
increase profitability. At 1,000,000 units, earnings per share are $.91 under the old plan and $1.15
under the new plan. At 1,500,000 units, the gap is even wider. Earnings per share are $1.72 under
the old plan and $2.72 under the new plan.
On the other hand, the new plan exposes the firm to more risk of not covering its cash obligations. As