
assets. Due to the relation between the modified duration and Macaulay duration, the modified
duration analysis can be classified in terms of the latter. Manager C should agree with Manager
16. Why is there greater risk in a multiperiod immunization strategy than a cash flow-matching
strategy?
To understand the greater risk in a multiperiod immunization strategy, we need to first
understand the differences between the cash flow matching and multiperiod immunization
strategies. First, unlike the immunization approach, the cash flow matching approach has no
duration requirements. Second, with immunization, rebalancing is required even if interest rates
do not change. In contrast, no rebalancing is necessary for cash flow matching except to delete
17. Answer the below questions.
(a) What is a contingent immunization strategy?
A contingent immunization strategy is a strategy that consists of identifying both the available
immunization target rate and a lower safety net level return with which the investor would be
minimally satisfied. More details are given below.
For a contingent immunization strategy, the portfolio manager pursues an active portfolio
strategy until an adverse investment experience drives the then-available potential return—the
combined active return from actual past experience and immunized return from expected future
plan is abandoned.
(b) What is the safety net cushion in a contingent immunization strategy?
The safety cushion is the difference between the immunized return and the safety net return.
More details including an illustration of the safety cushion is given below.
Suppose that a client investing $50 million is willing to accept a 10% rate of return over
a four-year investment horizon at a time when a possible immunized rate of return is 12%. The
(c) Is it proper to classify a contingent immunization as a combination active/immunization
strategy?
In a contingent strategy, the portfolio manager is permitted to manage the portfolio actively until
the safety net is violated. The manager could theoretically employ an active strategy for the whole
period. While it is doing this, it is also following the guidelines of an immunization strategy. Given
these considerations, one might classify a contingent immunization as a combination
18. What is a combination matching strategy?
A popular variation of multiperiod immunization and cash flow matching to fund liabilities is
one that combines the two strategies. This strategy, referred to as combination matching or
horizon matching, creates a portfolio that is duration matched with the added constraint that it
19. In a stochastic liability funding strategy, why is an interest-rate model needed?
Changes in interest rates impact the cash flows for a stochastic liability funded strategy. Thus, an
interest model is needed to track the cash flows. More details are given below.
Since the mid-1980s, a number of models have been developed to handle real-world situations in
which liability payments and / or asset cash flows are uncertain. Such models are called
stochastic models. Such models require that the portfolio manager incorporate an interest-rate
20. Suppose that a client has granted an asset management firm permission to pursue an
active/immunized combination strategy. Suppose further that the minimum return
expected by the client is 9% and that the asset management firm believes that an
achievable immunized target return is 14% and the worst possible return from the actively
managed portion of the portfolio is 1%. Approximately how much should be allocated to
the active component of the portfolio?
The following formula can be used to determine the portion of the initial portfolio to be managed
actively, with the balance immunized:
immunization target rate expected worst case active return
−
In the formula it is assumed that the immunization target return is greater than either the
minimum return established by the client or the expected worst-case return from the actively
managed portion of the portfolio. Inserting in our values we get:
©2013 Pearson Education
553
active component =
14% 9%
14% 1%
−
−
=
5%
11%
= 0.454545 or about 45.45%.
21. A liability-driven strategy for defined benefit pension funds is to create an immunizing
portfolio and an excess return portfolio. Explain this strategy.
Ross, Bernstein, Ferguson, and Dalio of Bridgewater Associates propose the following
liability-driven strategy for a pension plan, which involves two steps. First, create an immunizing
portfolio. The purpose of this portfoliois to hedge the adverse consequences associated with the
exposure to the liabilities. Second, create what they refer to as an “excess return portfolio.” The
22. The following excerpt is from a January 18, 2008 article (“LDI Strategy that is Liable to
Word?”) by Penny Green, Chief Executive of the SAUL Trustee Company (a U.K. that
advises on pension management) and deals with liability-driven strategies:
“…there is no one asset class that precisely matches a plan’s liabilities. It is the case that
bonds provide a cash flow that can be used to meet the cash flows out of a pension plan.
But so do equities – it is just that the cash flows from equities (dividends) cannot be
Explain why you agree or disagree with this viewpoint.
In general one would agree with the views being presented concerning (i) the problems of any
asset class rendering cash flows that can perfectly match a plan’s liabilities, and (ii) the
shortcomings of any asset class meeting longevity risk. More details are given below.
23. In explaining how a pension fund should transition to a liability-driven investment strategy,
Duane Rocheleau, managing director of Northern Trust’s global investment solutions team,
writes in “Implementing LDI in Pension Plans,” January 2007:
“1. Analyze and characterize the liabilities;
Describe each of the above elements.
In terms of analyzing and characterizing the liabilities, the manager wants to know the amounts
of cash flows and the timing of the cash flows that are owed pension fund recipients. This is
In terms of quantifying the relation between the assets and liabilities, the manager wants to be
able to match the cash flows from the assets with those of the liabilities so that pension fund
recipients will be paid in full and on time. To understand this problem and the need to quantify,
In regards to developing and implementing appropriate investment strategies, there are two
strategies to choose from: multiperiod immunization and cash flow matching.
A multiperiod immunization strategy is one in which a portfolio is created that will be capable of
satisfying more than one predetermined future liability regardless if interest rates change. Even if
there is a parallel shift in the yield curve, it has been demonstrated that matching the duration of
A cash flow matching strategy is used to construct a portfolio that will fund a schedule of
liabilities from a portfolio’s cash flows, with the portfolio’s value diminishing to zero after
payment of the last liability. This strategy can be summarized as follows. A bond is selected with
In regards to further action (monitoring, rebalancing, and tweaking) on the investment strategy as
necessary, we can note that action is required because the market yield will fluctuate over the
investment horizon. As a result, the duration of the portfolio will change (and change by more
than that caused simply by the passage of time).In the face of changing yields, a portfolio can
A question we can pose is: How often should the portfolio be rebalanced to adjust its duration?
24. One of your clients, a newcomer to the life insurance business, questioned you about the
following excerpt from Peter E. Christensen, Frank J. Fabozzi, and Anthony LoFaso,
“Dedicated Bond Portfolios,” Chapter 43 in Frank J. Fabozzi (ed.), The Handbook of Fixed
Income Securities (Homewood, IL: Richard D. Irwin, 1991):
For financial intermediaries such as banks and insurance companies, there is
a well-recognized need for a complete funding perspective. This need is best illustrated
by the significant interest-rate risk assumed by many insurance carriers in the early
years of their Guaranteed Investment Contract (GIC) products. A large volume of
Answer the below questions posed to you by your client.
(a) “It is not clear to me what risk an issuer of a GIC is facing. A carrier can invest the
proceeds in assets offering a higher yield than they are guaranteeing to GIC policyholders,
so what’s the problem? Isn’t it just default risk that can be controlled by setting tight credit
standards?”
An issuer of a GIC is facing reinvestment rate risk. As rates increase, the issuer of a GIC will
face paying a higher rate of return on subsequent securities because GICs mature in three to
seven years. This liability is matched by a longer term asset that pays an increasingly lower
©2013 Pearson Education
557
assets gave a return too low to meet the return guaranteed on the liabilities. This problem has no
immediate relationship to default risk. However, due to the mismatch in assets and liabilities the
company has put itself in a precarious net surplus situation.
(b) “I understand that disintermediation means that when a policy matures, the funds are
withdrawn from the insurance company by the policyholder. But why would a rise in
interest rates cause GIC policyholders to withdraw their funds? The insurance company
can simply guarantee a higher interest rate.”
Under a GIC policy, for a lump-sum payment a life insurance company guarantees that specified
dollars will be paid to the policyholder at a specified future date. Or, equivalently, the financial
institution (i.e., life insurance company) guarantees a specified rate of return on the payment.
(c) “What do the authors mean by ‘pricing GICs on a spread basis and investing the
proceeds on a mismatched basis,’ and what is this ‘rollover risk’ they are referring to?”
The GICs were priced such that the bank and insurance companies would realize what they
believed was a healthy spread compared to other possible liabilities. However, the profit was
25. Suppose that a life insurance company sells a five-year guaranteed investment contract
that guarantees an interest rate of 7.5% per year on a bond-equivalent yield basis (or
equivalently, 3.75% every six months for the next 10 six-month periods). Also suppose that
the payment made by the policyholder is $9,642,899.
Consider the following three investments that can be made by the portfolio manager:
Bond X: Buy $9,642,899 par value of an option-free bond selling at par with a 7.5%
yield to maturity that matures in five years.
Answer the below questions.
(a) Holding aside the spread that the insurance company seeks to make on the invested
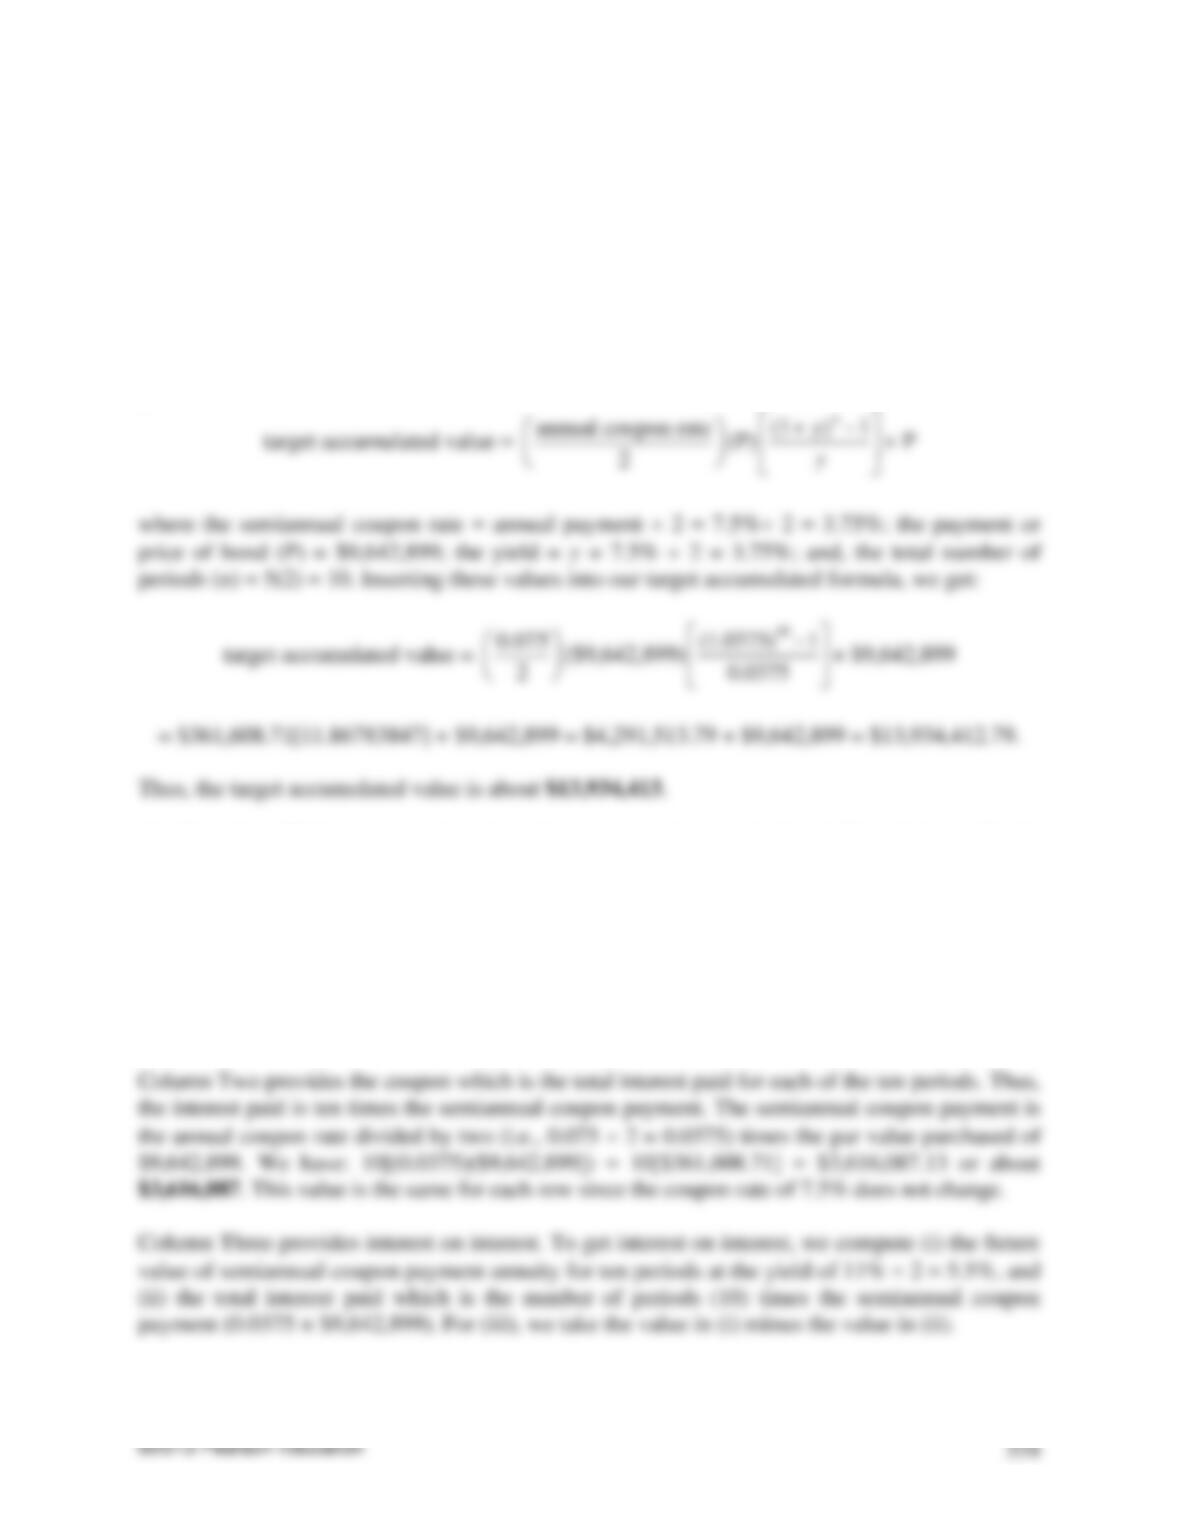
funds, demonstrate that the target accumulated value to meet the GIC obligation five years
from now is $13,934,413.
To compute the target accumulated value, we need to take the future value of the annuity
resulting from the policyholder’s payment and add it to this payment due at the end of the last
period. We have:
annual coupon rate
(1 + 1
)
−
n
y
(b) Complete Table A assuming that the manager invests in bond X and immediately
following the purchase, yields change and stay the same for the five-year investment horizon.
For the each row, we have six columns. Below we show how all values are gotten for the first
row of 11.00%. The same process can be repeated to get values for the remaining rows.
Column One gives the new yield which is 11% for the first row. This means the semiannual yield
will be 5.5%. This value changes for each row with each new yield provided for each row.
For (i), we have:
annual coupon rate
2
(P)
(1 + 1
)
−
n
y
y
=
0.075
2
($9,642,899)
10
(1.055 1
)
0.055
−
=$361,608.71[12.87535379] = $4,655,840.11.
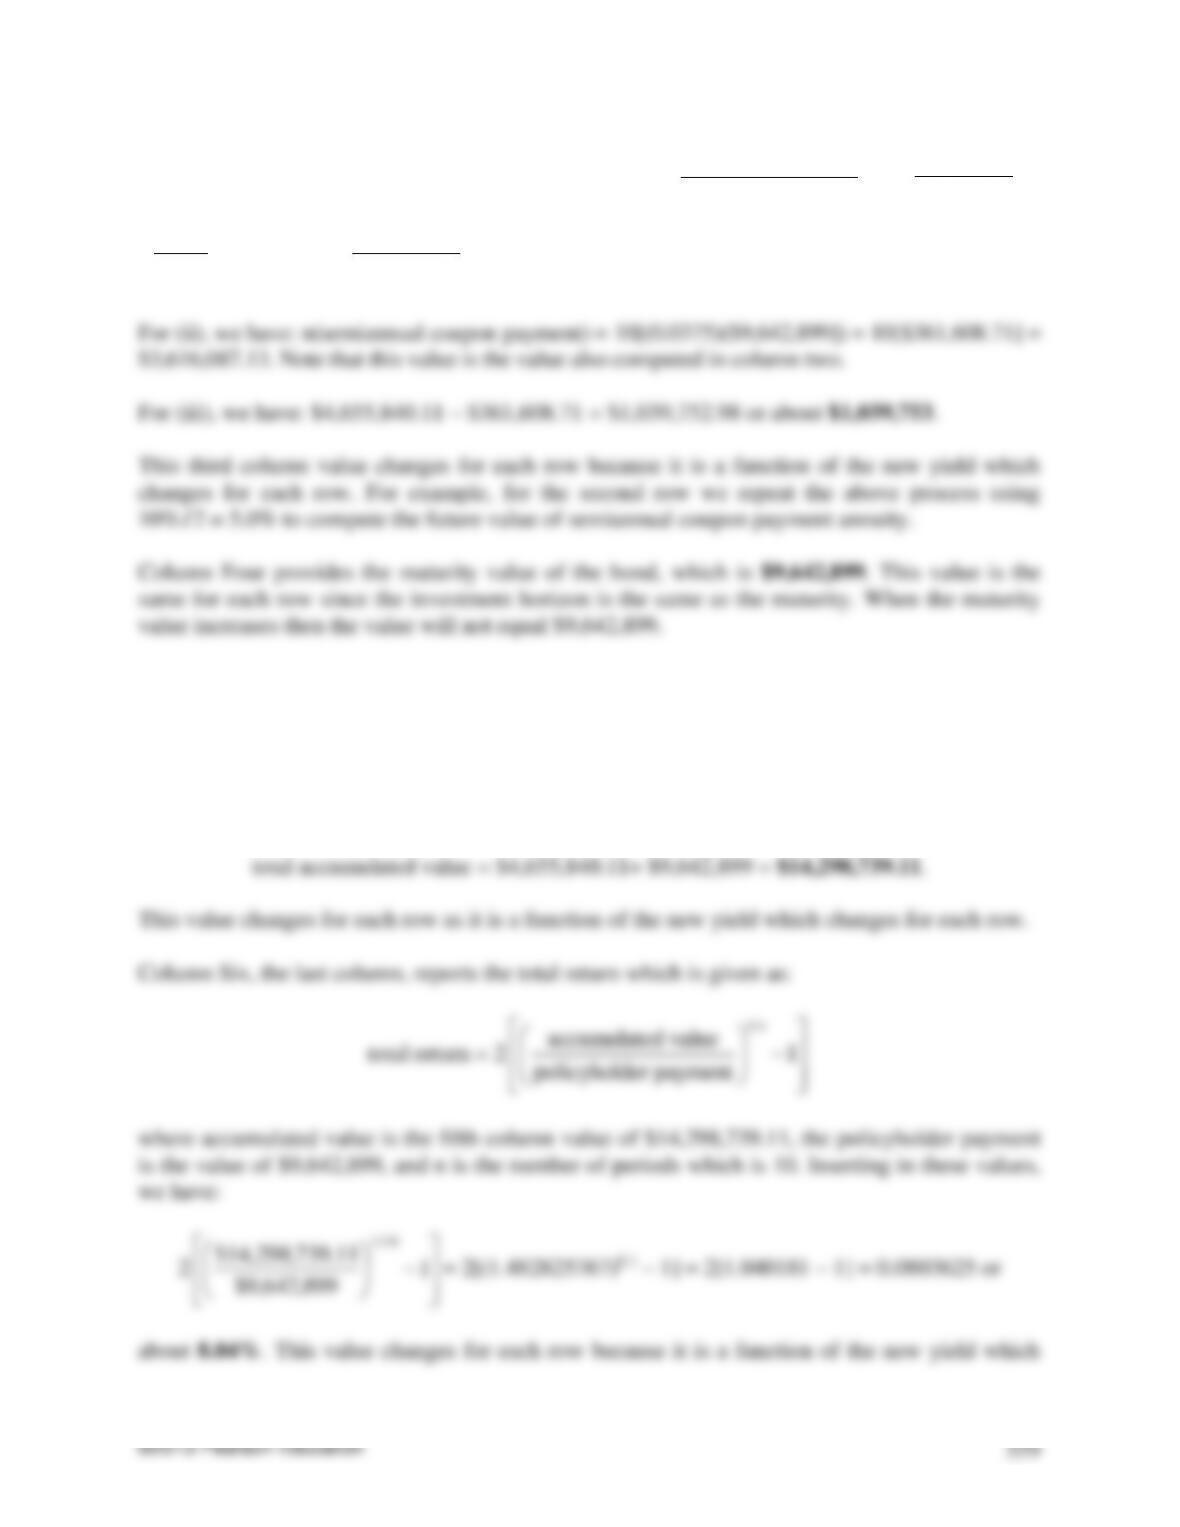
Column Five is the total accumulated value. This is computed by adding (i) the future value of
semiannual coupon payment annuity for ten periods at the yield of 11% 2 = 5.5%and (ii) the
maturity value given in the fourth column. The value for (i) was given previously as
$4,655,840.11 when computing the interest on interest. This value is also given by adding the
second and third column values. The value for (ii) is $9,642,899 as given in the fourth column.
For the accumulated value, we have:
changes for each row.
We repeat the above process to get all values for each row. These values are given below with
Table A filled in.
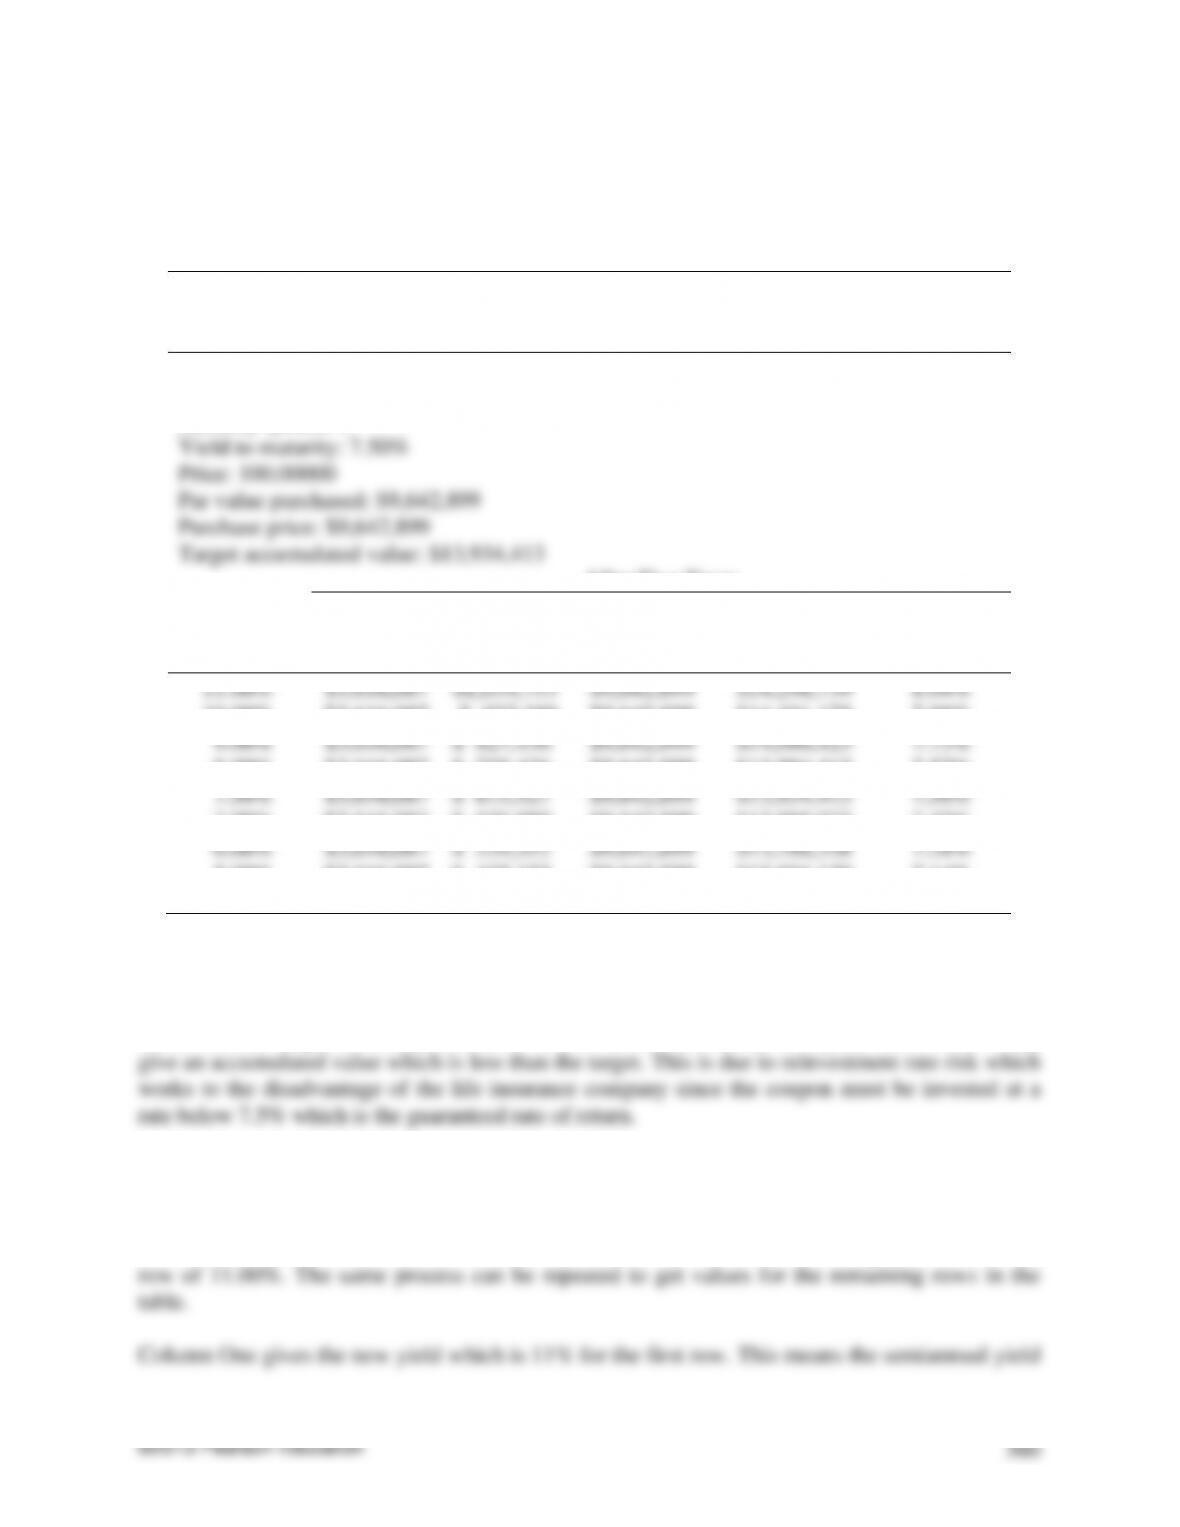
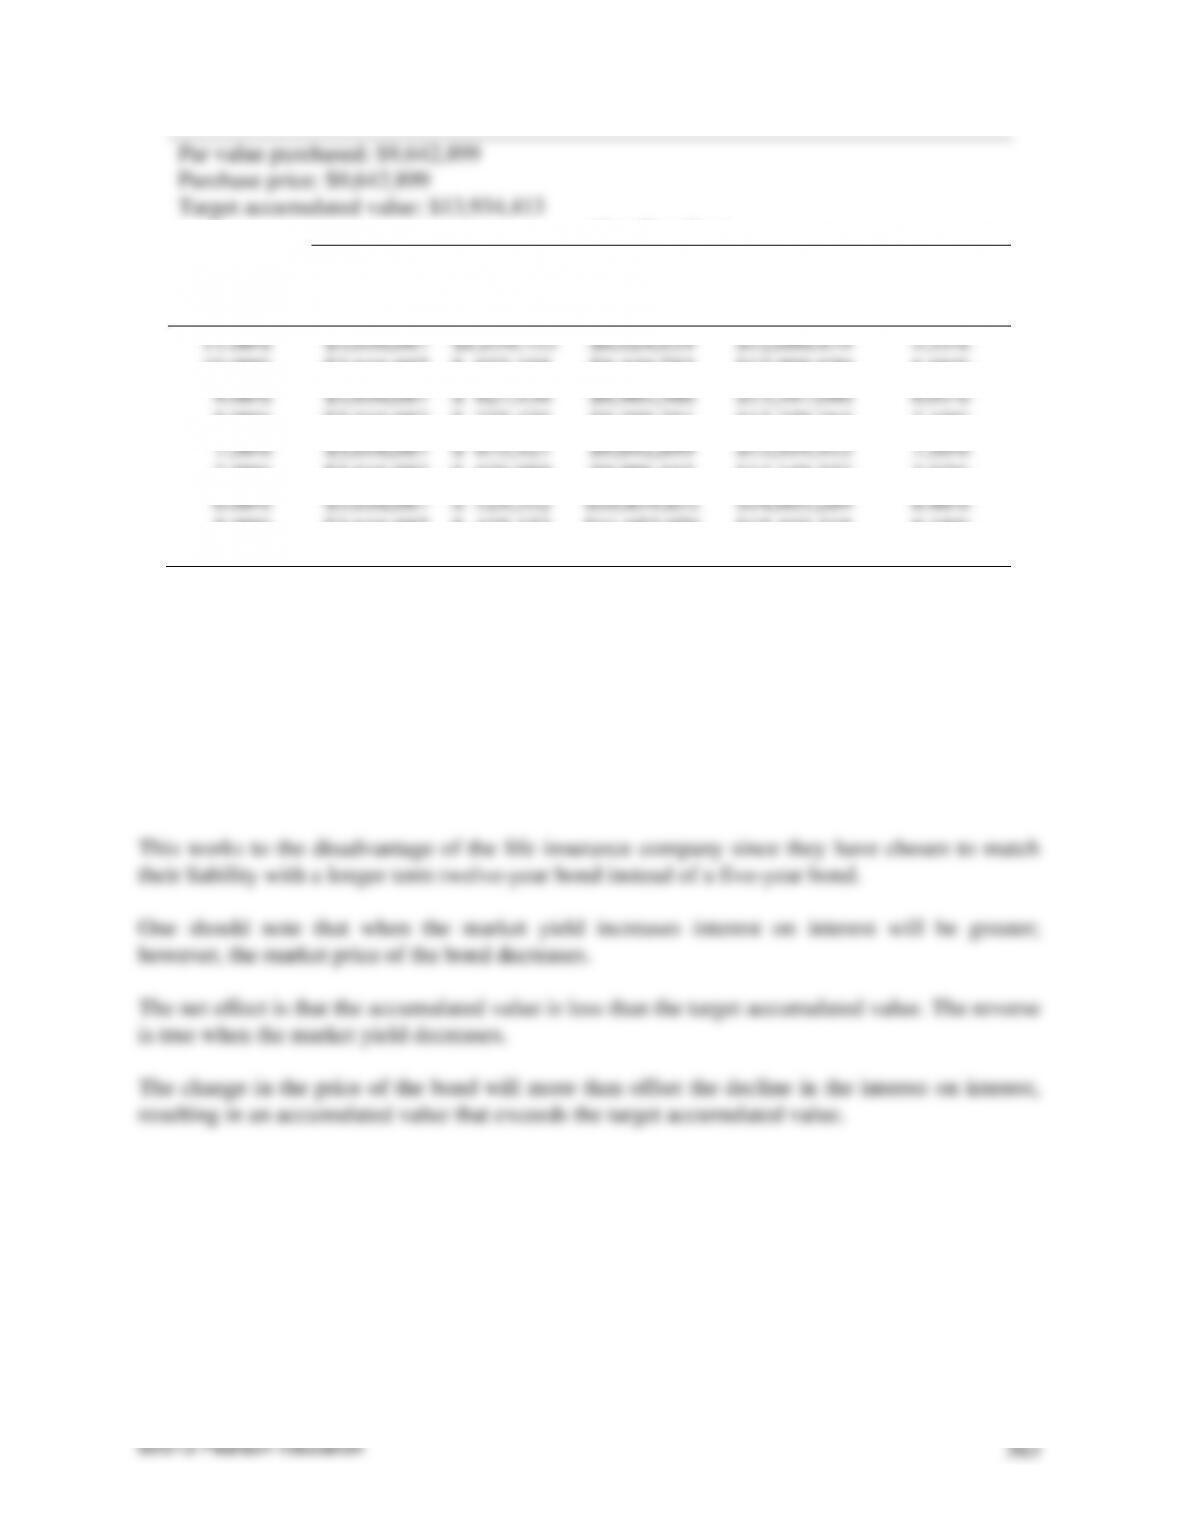
Table A
Accumulated Value and Total Return After Five Years:
Five-Year 7.5% Bond Selling to Yield 7.5%
Investment horizon (years): 5
Coupon rate: 7.50%
Maturity (years): 5
Yield to maturity: 7.50%
Price: 100.00000
Par value purchased: $9,642,899
Purchase price: $9,642,899
Target accumulated value: $13,934,413
After Five Years
New Yield
Coupon
Interest on
Interest
Price of
Bond
Accumulated
Value
Total Return
11.00%
$3,616,087
$1,039,753
$9,642,899
$14,298,739
8.04%
10.00%
$3,616,087
$ 932,188
$9,642,899
$14,191,175
7.88%
9.00%
$3,616,087
$ 827,436
$9,642,899
$14,086,423
7.73%
8.00%
$3,616,087
$ 725,426
$9,642,899
$13,984,412
7.57%
7.50%
$3,616,087
$ 675,427
$9,642,899
$13,934,413
7.50%
7.00%
$3,616,087
$ 626,089
$9,642,899
$13,885,073
7.43%
6.00%
$3,616,087
$ 529,352
$9,642,899
$13,788,338
7.28%
5.00%
$3,616,087
$ 435,153
$9,642,899
$13,694,139
7.14%
4.00%
$3,616,087
$ 343,427
$9,642,899
$13,602,414
7.00%
(c) Based on Table A, under what circumstances will the investment in bond X fail to satisfy
the target accumulated value?
Given that the target accumulated value is $13,934,413, we see any new yield below 7.50% will
(d) Complete Table B, assuming that the manager invests in bond Y and immediately
following the purchase, yields change and stay the same for the five-year investment horizon.
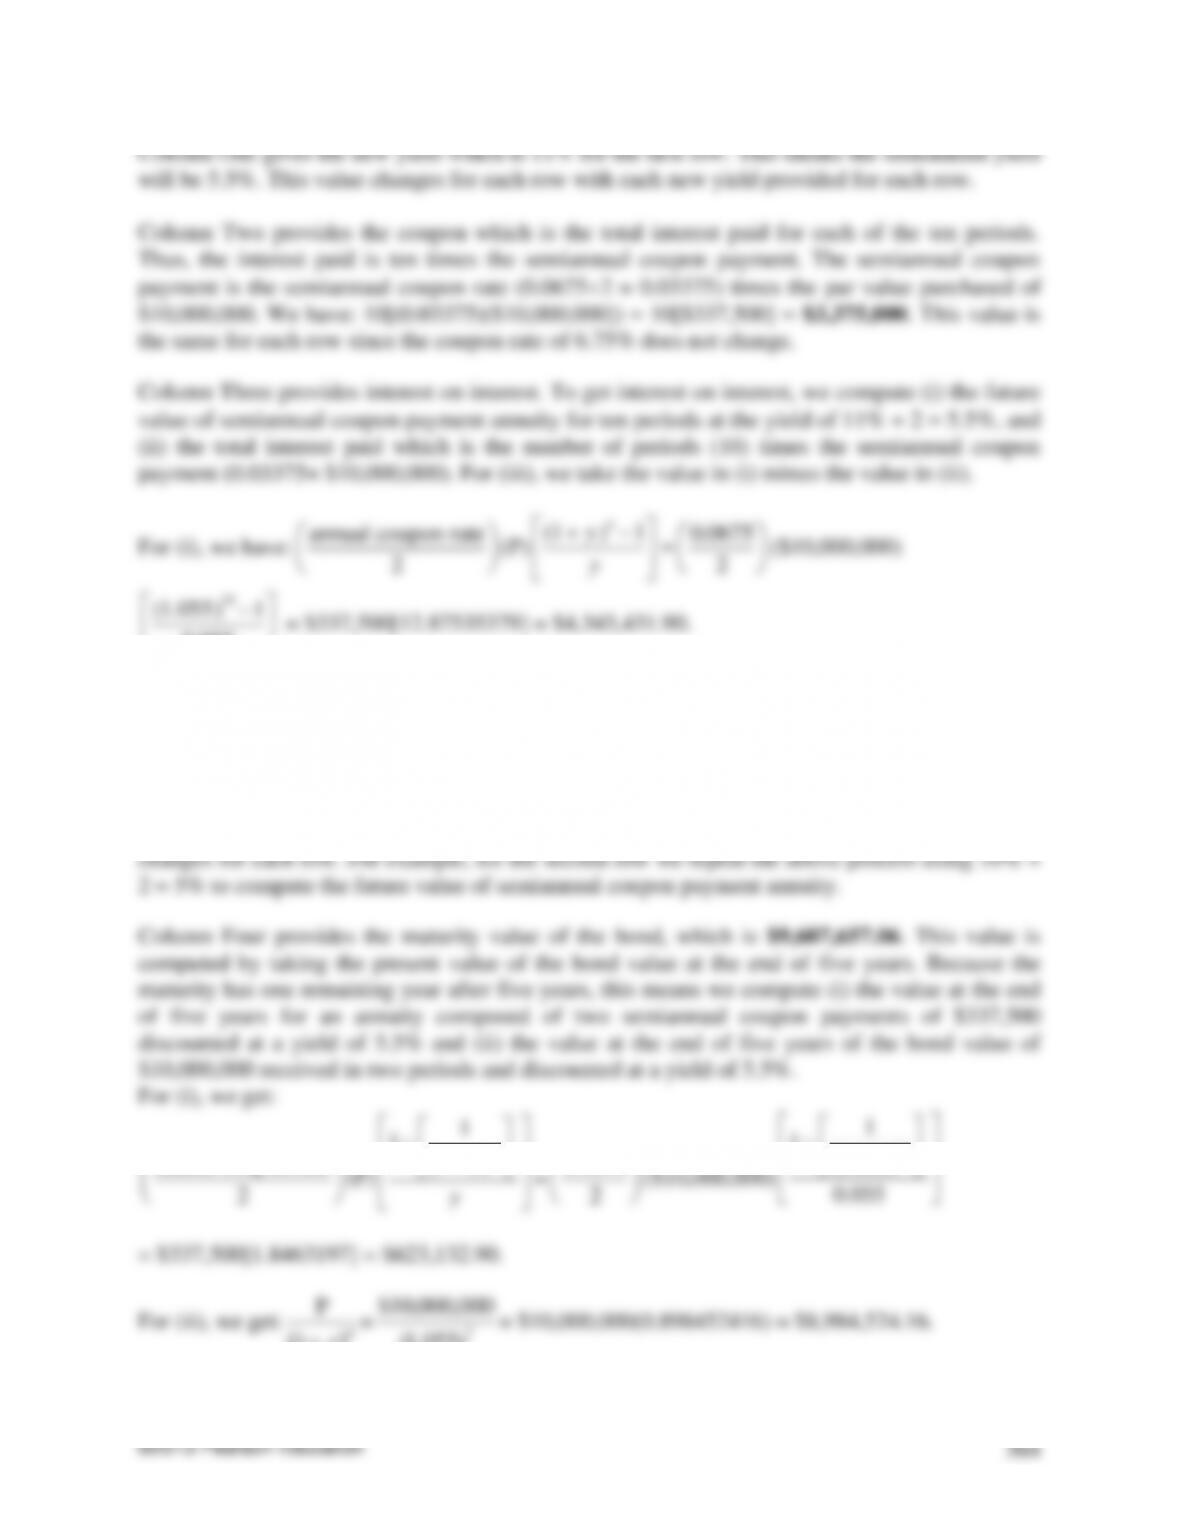
For the each row, we have six columns. Below we show how all values are gotten for the first
will be 5.5%. This value changes for each row with each new yield provided for each row.
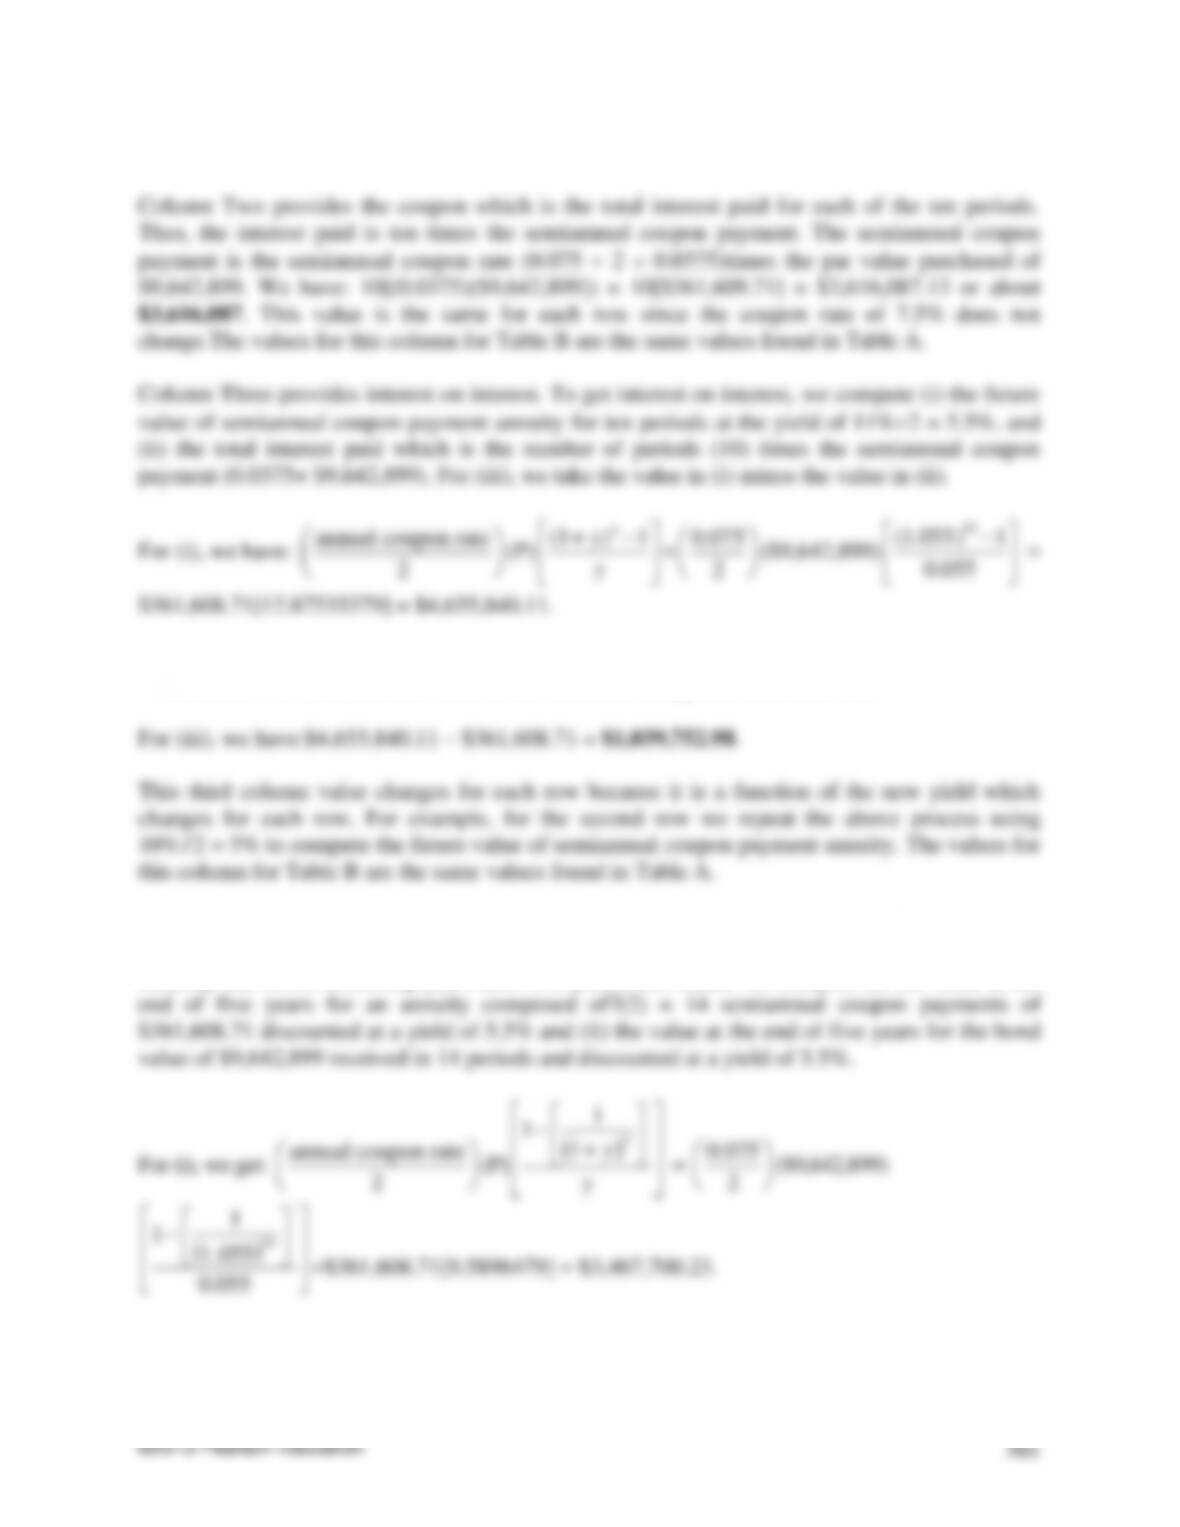
For (ii), we have: n(semiannual coupon payment) = 10[(0.0375)($9,642,899]) = 10[$361,608.71]
= $3,616,087.13. Note that this value is the value also computed in column two.
Column Four provides the maturity value of the bond, which is $8,024,638.89. This value is
computed by taking the present value of the bond value at the end of five years. Because the
maturity has seven remaining years after five years, this means we compute (i) the value at the
0.055
©2013 Pearson Education
562
For (ii), we get:
( )
P
1+n
y
=
( )
14
$9,642,899
1.055
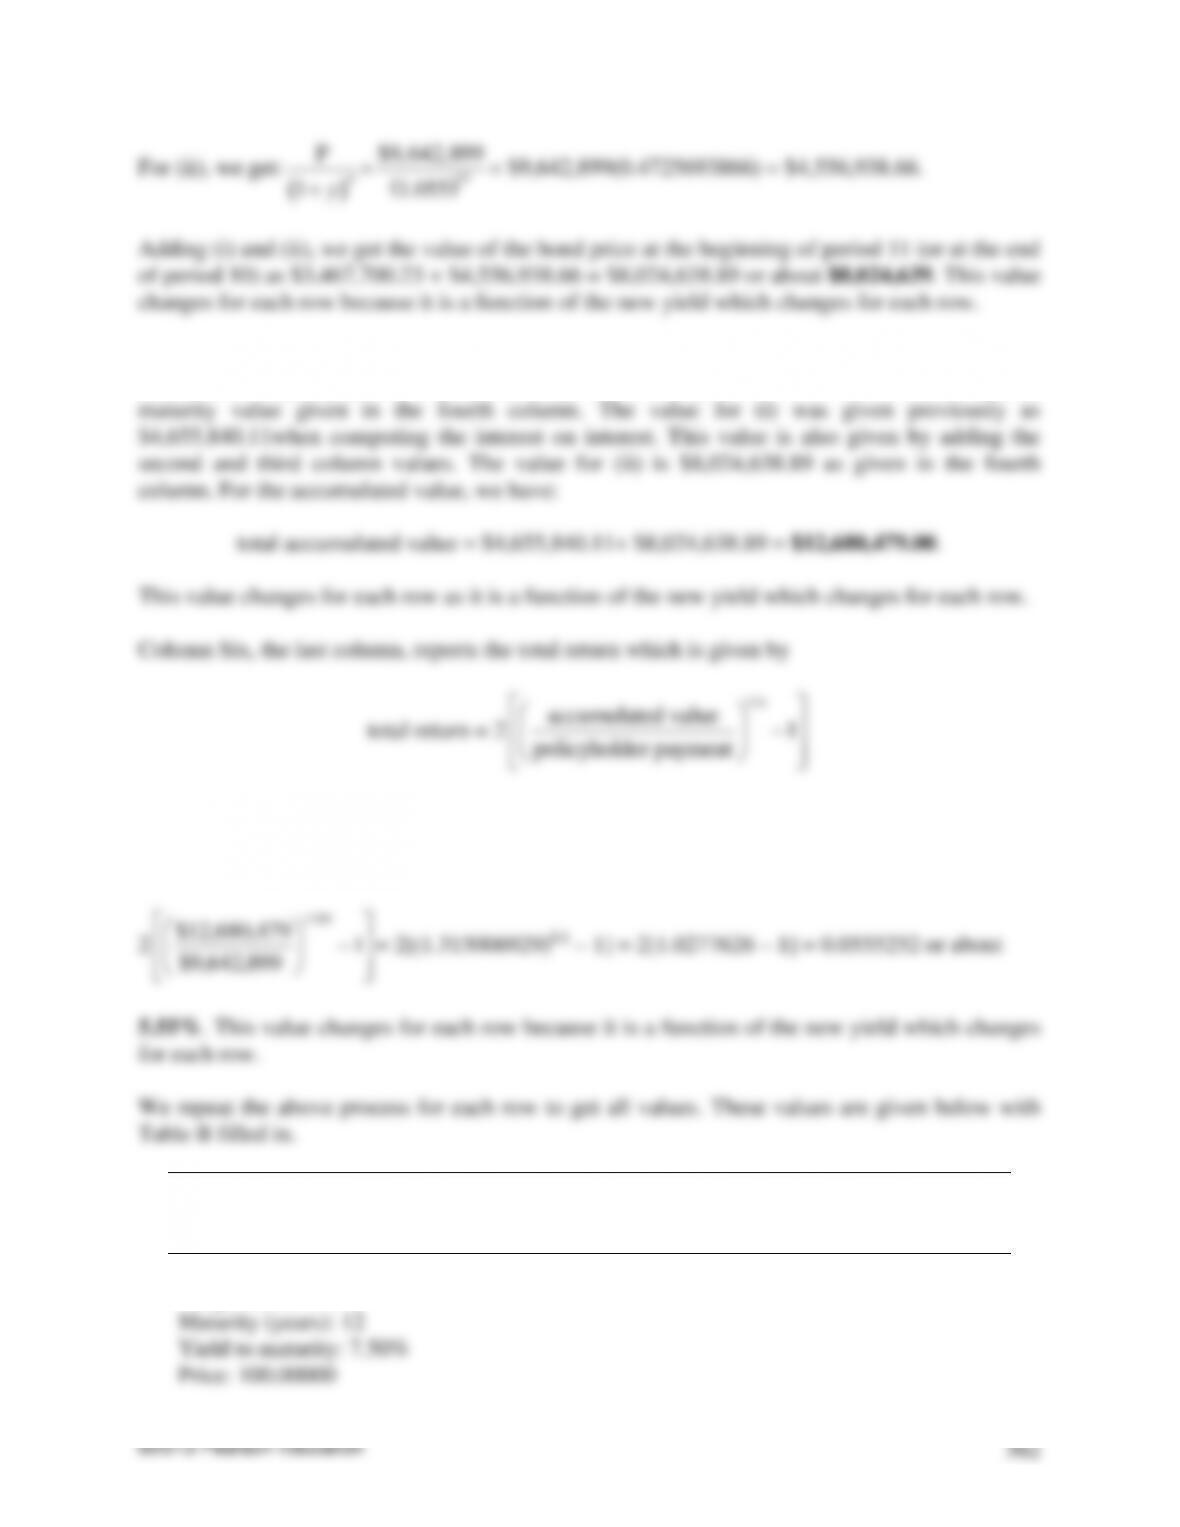
= $9,642,899(0.4725693866) = $4,556,938.66.
Adding (i) and (ii), we get the value of the bond price at the beginning of period 11 (or at the end
of period 10) as $3,467,700.23 + $4,556,938.66 = $8,024,638.89 or about $8,024,639. This value
changes for each row because it is a function of the new yield which changes for each row.
Column Five is the total accumulated value. This is computed by adding (i) the future value of
semiannual coupon payment annuity for ten periods at the yield of 11% 2 = 5.5%and (ii) the
policyholder payment
where accumulated value is the fifth column value of $12,680,479.00, the policyholder payment
is the value of $9,642,899, and n is the number of periods which is 10. Inserting in these values,
we have:
Table B
Accumulated Value and Total Return After Five Years:
Twelve-Year 7.5% Bond Selling to Yield 7.5%
Investment horizon (years): 5
Coupon rate: 7.50%
Maturity (years): 12
Yield to maturity: 7.50%
Price: 100.00000
Par value purchased: $9,642,899
Purchase price: $9,642,899
Target accumulated value: $13,934,413
After Five Years
New Yield
Coupon
Interest on
Interest
Price of
Bond
Accumulated
Value
Total Return
11.00%
$3,616,087
$1,039,753
$8,024,639
$12,680,479
5.55%
10.00%
$3,616,087
$ 932,188
$8,449,753
$12,998,030
6.06%
9.00%
$3,616,087
$ 827,436
$8,903,566
$13,347,090
6.61%
8.00%
$3,616,087
$ 725,426
$9,388,251
$13,729,764
7.19%
7.50%
$3,616,087
$ 675,427
$9,642,899
$13,934,413
7.50%
7.00%
$3,616,087
$ 626,089
$9,906,163
$14,148,337
7.82%
6.00%
$3,616,087
$ 529,352
$10,459,851
$14,605,289
8.48%
5.00%
$3,616,087
$ 435,153
$11,052,078
$15,103,318
9.18%
4.00%
$3,616,087
$ 343,427
$11,685,837
$15,645,352
9.92%
(e) Based on Table B, under what circumstances will the investment in bond Y fail to
satisfy the target accumulated value?
Given that the target accumulated value is $13,934,413, we see any new yield above 7.50% will
give accumulated value which is less than the target.
This is due to fact that the increase in interest rates lowers the value of the coupon and principal
payments which are discounted at a higher yield in the future.
(f) Complete Table C, assuming that the manager invests in bond Z and immediately
following the purchase, yields change and stay the same for the five-year investment
horizon.
For the each row, we have six columns. Below we show how all values are gotten for the first
row of 11.00%. The same process can be repeated to get values for the remaining rows in the
table.
564
Column One gives the new yield which is 11% for the first row. This means the semiannual yield
will be 5.5%. This value changes for each row with each new yield provided for each row.
Column Two provides the coupon which is the total interest paid for each of the ten periods.
Thus, the interest paid is ten times the semiannual coupon payment. The semiannual coupon
payment is the semiannual coupon rate (0.06752 = 0.03375) times the par value purchased of
$10,000,000. We have: 10[(0.03375)($10,000,000]) = 10[$337,500] = $3,375,000. This value is
the same for each row since the coupon rate of 6.75% does not change.
Column Three provides interest on interest. To get interest on interest, we compute (i) the future
value of semiannual coupon payment annuity for ten periods at the yield of 11% 2 = 5.5%, and
(ii) the total interest paid which is the number of periods (10) times the semiannual coupon
payment (0.03375× $10,000,000). For (iii), we take the value in (i) minus the value in (ii).
For (i), we have:
annual coupon rate
2
(P)
−
y
yn1
)
+ (1
=
0.0675
2
($10,000,000)
055.0
1
)
055(1. 10
−
= $337,500[12.87535379] = $4,345,431.90.
For (ii), we have: n(semiannual coupon payment) = 10[(0.03375)($ 10,000,000]) = 10[$337,500]
= $3,375,000. Note that this value is the value also computed in column two.
For (iii), we have:$4,345,431.90 – $3,375,000 = $970,431.90.
This third column value changes for each row because it is a function of the new yield which
annual coupon rate
2
(P)
( )
1
1
1 +
−
n
y
y
=
0.0675
2
($10,000,000)
( )
2
1
1
1 .055
0.055
−
= $337,500[1.8463197] = $623,132.90.
( )
P
1+n
y
)055.1(
000,000,10$
2

Adding (i) and (ii), we get the value of the bond price at the beginning of period 11 (or at the end
of period 10) as $623,132.90+ $8,984,524.16 = $9,607,657.06 or about $9,607,657. This value
changes for each row because it is a function of the new yield which changes for each row.
Column Five is the total accumulated value. This is computed by adding (i) the future value of
total return = 2
1/
accumulated value 1
policyholder payment
−
n
$9,642,899
7.53%. This value changes for each row because it is a function of the new yield which changes
for each row.
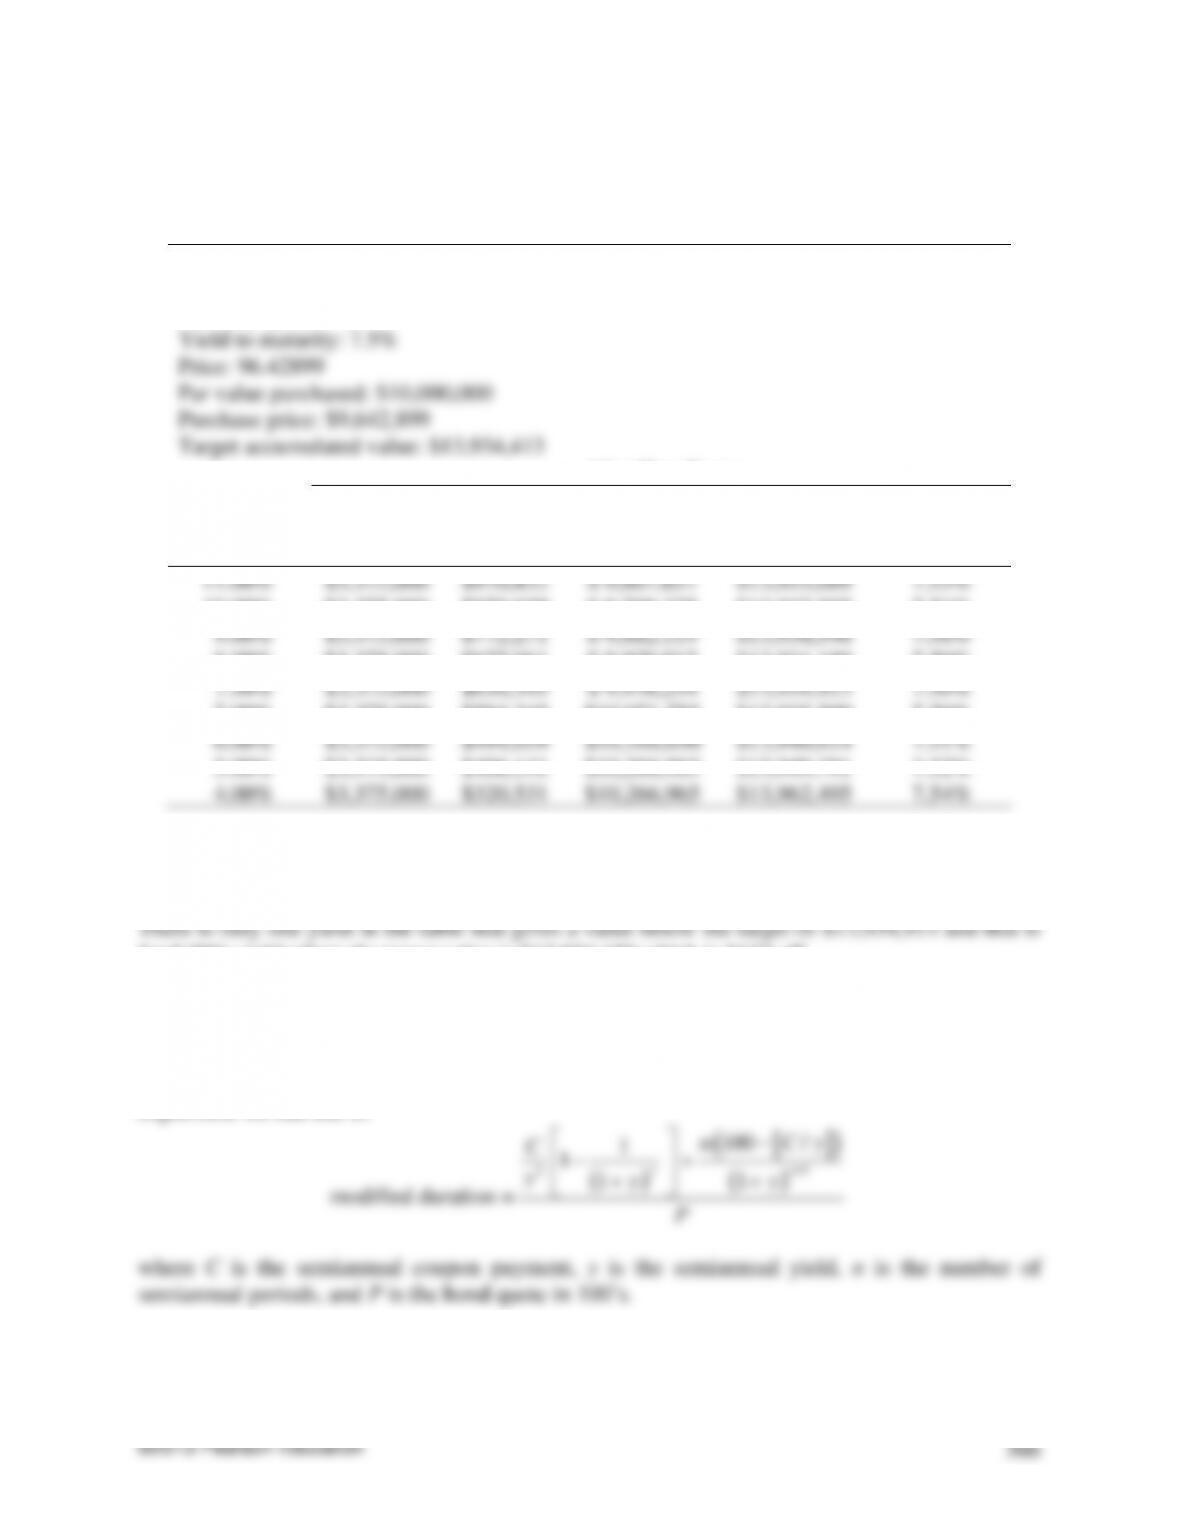
Table C
Accumulated Value and Total Return After Five Years:
Six-Year 6.75% Bond Selling to Yield 7.5%
Investment horizon (years): 5
Coupon rate: 6.75%
Maturity (years): 6
Yield to maturity: 7.5%
Price: 96.42899
Par value purchased: $10,000,000
Purchase price: $9,642,899
Target accumulated value: $13,934,413
After Five Years
New Yield
Coupon
Interest on
Interest
Price of
Bond
Accumulated
Value
Total Return
11.00%
$3,375,000
$970,432
$ 9,607,657
$13,953,089
7.53%
10.00%
$3,375,000
$870,039
$ 9,789,325
$13,942,885
7.51%
9.00%
$3,375,000
$772,271
$ 9,882,119
$13,936,596
7.50%
8.00%
$3,375,000
$677,061
$ 9,929,017
$13,934,180
7.50%
7.50%
$3,375,000
$630,395
$ 9,976,254
$13,934,413
7.50%
7.00%
$3,375,000
$584,345
$10,071,755
$13,935,599
7.50%
6.00%
$3,375,000
$494,059
$10,168,650
$13,940,814
7.51%
5.00%
$3,375,000
$406,141
$10,266,965
$13,949,791
7.52%
4.00%
$3,375,000
$320,531
$10,266,965
$13,962,495
7.54%
(g) Based on Table C, under what circumstances will the investment in bond Z fail to
satisfy the target accumulated value?
for 8.00% yield where the target value is $13,934,180 which is $133 off.
(h) What is the modified duration of the liability?
Modified duration is a measure of the sensitivity of a bond’s price to interest-rate changes,
assuming that the expected cash flow does not change with interest rates. One modified duration
expression we can use is:
( )
( )
( )
1
2
100 /
1
1
11
+
−
−+
++
nn
n C y
C
yyy
For our bond (expressing numbers in terms of a $100 bond quote), we have: C = $3.75, y =
0.0375, n = 10, and P = $96.43. Inserting these values in our modified duration formula, we can
solve as follows:
( )
( )
( )
1
2
100 /
1
1
11
+
−
−+
++
nn
n C y
C
yyy
P
=
( ) ( )
( )
( )
2 10 11
10 $100 $3.75/ 0.0375
$3.75 1
1
0.375 1 .0375 1 .0375
$96.43
−
−+
=
$2,666.67 (0.3079795) $0
$96.43
+
=
$821.28
$96.43
= 8.52.
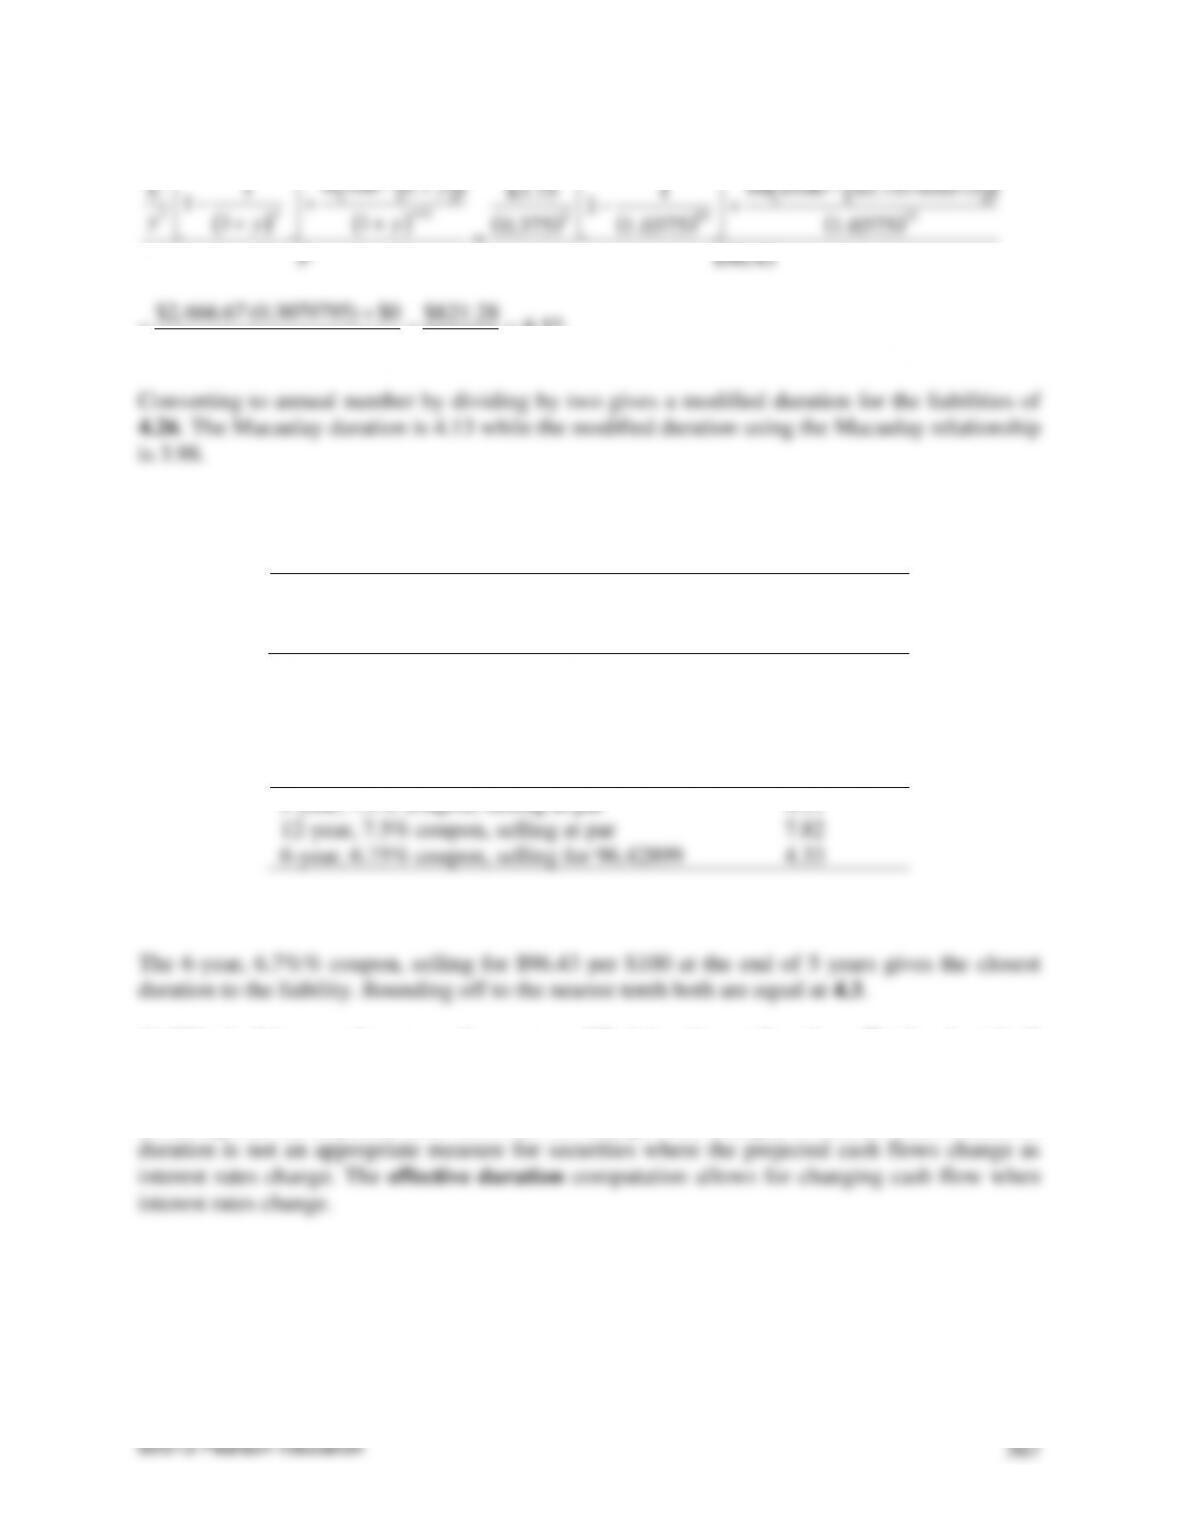
(i) Complete the following table for the three bonds assuming that each bond is trading to
yield 7.5%:
Bond
Modified Duration
5-year, 7.5% coupon, selling at par
12-year, 7.5% coupon, selling at par
6-year, 6.75% coupon, selling for 96.42899
Using the formula in part (h) for modified duration, we get the below values as given in the
completed table:
Bond
Modified Duration
5-year, 7.5% coupon, selling at par
4.11
12-year, 7.5% coupon, selling at par
7.82
6-year, 6.75% coupon, selling for 96.42899
4.33
(j) For which bond is the modified duration equal to the duration of the liability?
(k) Why in this example can one focus on modified duration rather than effective duration?
Modified duration is a measure of the sensitivity of a bond’s price to interest-rate changes,
assuming that the expected cash flows do not change with changes in interest rates. Modified