Chapter 2
Lesson 2-1 Interpret Scatterplots
Check Your Understanding (Example 1)
Check Your Understanding (Example 2)
Because sales decrease when the temperature
increases, the correlation is negative. This
Check Your Understanding (Example 3)
Taller people generally have larger feet, so a
correlation, but there is no causation.
Applications
1. Remind students that the terms explanatory and
response are used when causation is implied.
correlation.
3d. As the x-values increase, the y-values decrease.
This scatterplot shows a negative correlation.
3e. As the x-values increase, the y-values decrease.
This scatterplot shows a negative correlation.
3f. As the x-values increase, the y-values do not
increase or decrease. This scatterplot shows no
correlation.
explanatory variable and weight is the response
variable.
4b. In general, as the number of hours studied
variable.
4c. In general, as the number of hours worked
4d. In general, as the number of gallons of gas
consumed increases, the weight of the car
5a. Let 2 represent year 2002, 3 represent year
2003, and so on. The minimum on the x-axis is
0, the maximum is 10, and the scale is 1. The
5b. As the number of years increases, the per capita
income increases. This scatterplot shows a
positive correlation.
6a.The minimum on the x-axis is 0, the maximum is
1,100, and the scale is 100. The minimum on
6b. As the daily dose of vitamin C increases, the
number of colds decreases. This is a negative
correlation.
6c. The relationship seems to be casual. An
increase in the daily dose of vitamin C causes a
decrease in the number of colds. The daily dose
7a. Let 6 represent year 2006, 7 represent year
2007, and so on. The minimum on the x-axis is
7b. As the number of years increases, the
7c.The minimum on the x-axis is 775, the maximum
is 950, and the scale is 25. The minimum on the
7d. As the enrollment increases, the number of
students on the baseball team stays the same.
This scatterplot shows no correlation.
8a. As the price per song decreases, the number of
downloads increases.
8b. The minimum on the x-axis is 0.3, the maximum
scale is 250. Enter the price per song in L1 and
the number of downloads in L2. Use the STAT
8c. The average of $0.59 and $0.49 is $0.54. The
average of 1,877 and 1,944 is 1,910.5. The table
9a. Answers vary.
9b. Answers vary.
9c. Answers vary.
9d. Answers vary.
Lesson 2-2 Linear Regression
Check Your Understanding (Example 1)
Enter the ordered pairs into your calculator. Then
regression equation. The equation of the
regression line is y = –11x + 67.7.
Check Your Understanding (Example 2)
Check Your Understanding (Example 3)
line: y = 4.44(83) – 187.67 = 180.85, or about 181
water bottles. Because this is a prediction of a
Check Your Understanding (Example 4)
Because –0.28 is negative, the correlation is
Applications
almost linear and shows a strong correlation.
3. There is no apparent causation. Both prices may
have increased due to inflation over time. So,
the price of a slice of pizza would not be the
4a. Enter the data from the table into your
60,384.4.
4b. The slope is the coefficient of x in the equation
y = 30.5x – 60,384. The slope is 30.5.
4d. Substitute 2016 for x in the equation of the
regression line: y = 30.5(2016) – 60,384 = 1,101
students.
4e. Because 2016 is outside of the domain, this is
4f. Use a graphing calculator to find the correlation
coefficient. Rounded to the nearest hundredth,
the correlation coefficient is 0.98.
4g. Because 0.98 is positive, the correlation is
5b. 801 + 834 + 844 + 897 + 922 = 4,298
5c. (2008, 859.6)
5d. Substitute 2008 for x and 859.6 for y in the
859.6 = 859.6
6b. Because –0.87 is negative, the correlation is
6d. Because –0.099 is negative, the correlation is
negative. Because |–0.099| is less than 0.3, the
correlation is weak.
6e. Because 0.99 is positive, the correlation is
6f. Because –0.49 is negative, the correlation is
7a. Enter the data from the table into your
calculator. Then use the statistics menu to
calculate the linear regression equation. The
7b. The slope is the coefficient of x in the equation
7c. The slope is the change in y, number of
7d. Substitute 0.45 for x in the equation of the
7e. Because this is a prediction of a y-value given
an x-value in the domain, this is an example of
interpolation.
7f. Use a graphing calculator to find the correlation
coefficient. Rounded to the nearest hundredth,
8a. Enter the data from the table into your
calculator. Then use the statistics menu to
8c. The slope is the change in y, amount of tip in
dollars, over the change in x, amount of
restaurant bill in dollars. So the slope can be
or about $26.
8e. Because $120 is outside of the domain, this is
the correlation coefficient is 0.75.
8g. Because 0.75 is positive, the correlation is
8h. In the spreadsheet, cell A2 represents x, the
formula for the spreadsheet is =A2*0.22–0.27.
9. A positive slope means the line is increasing,
coefficient is positive. A negative slope means
10. The correct line of best fit is in graph c because
may not go through any point.
Lesson 2-3 Supply and Demand
Check Your Understanding (Example 1)
Check Your Understanding (Example 2)
Substitute 0.9 for Markup rate and x for Wholesale
1.9x.
Check Your Understanding (Example 3)
Check Your Understanding (Example 4)
As the price increases, less quantity is demanded,
Applications
1. Parrots repeat the things they hear over and
2. Markup + Wholesale price = Retail price
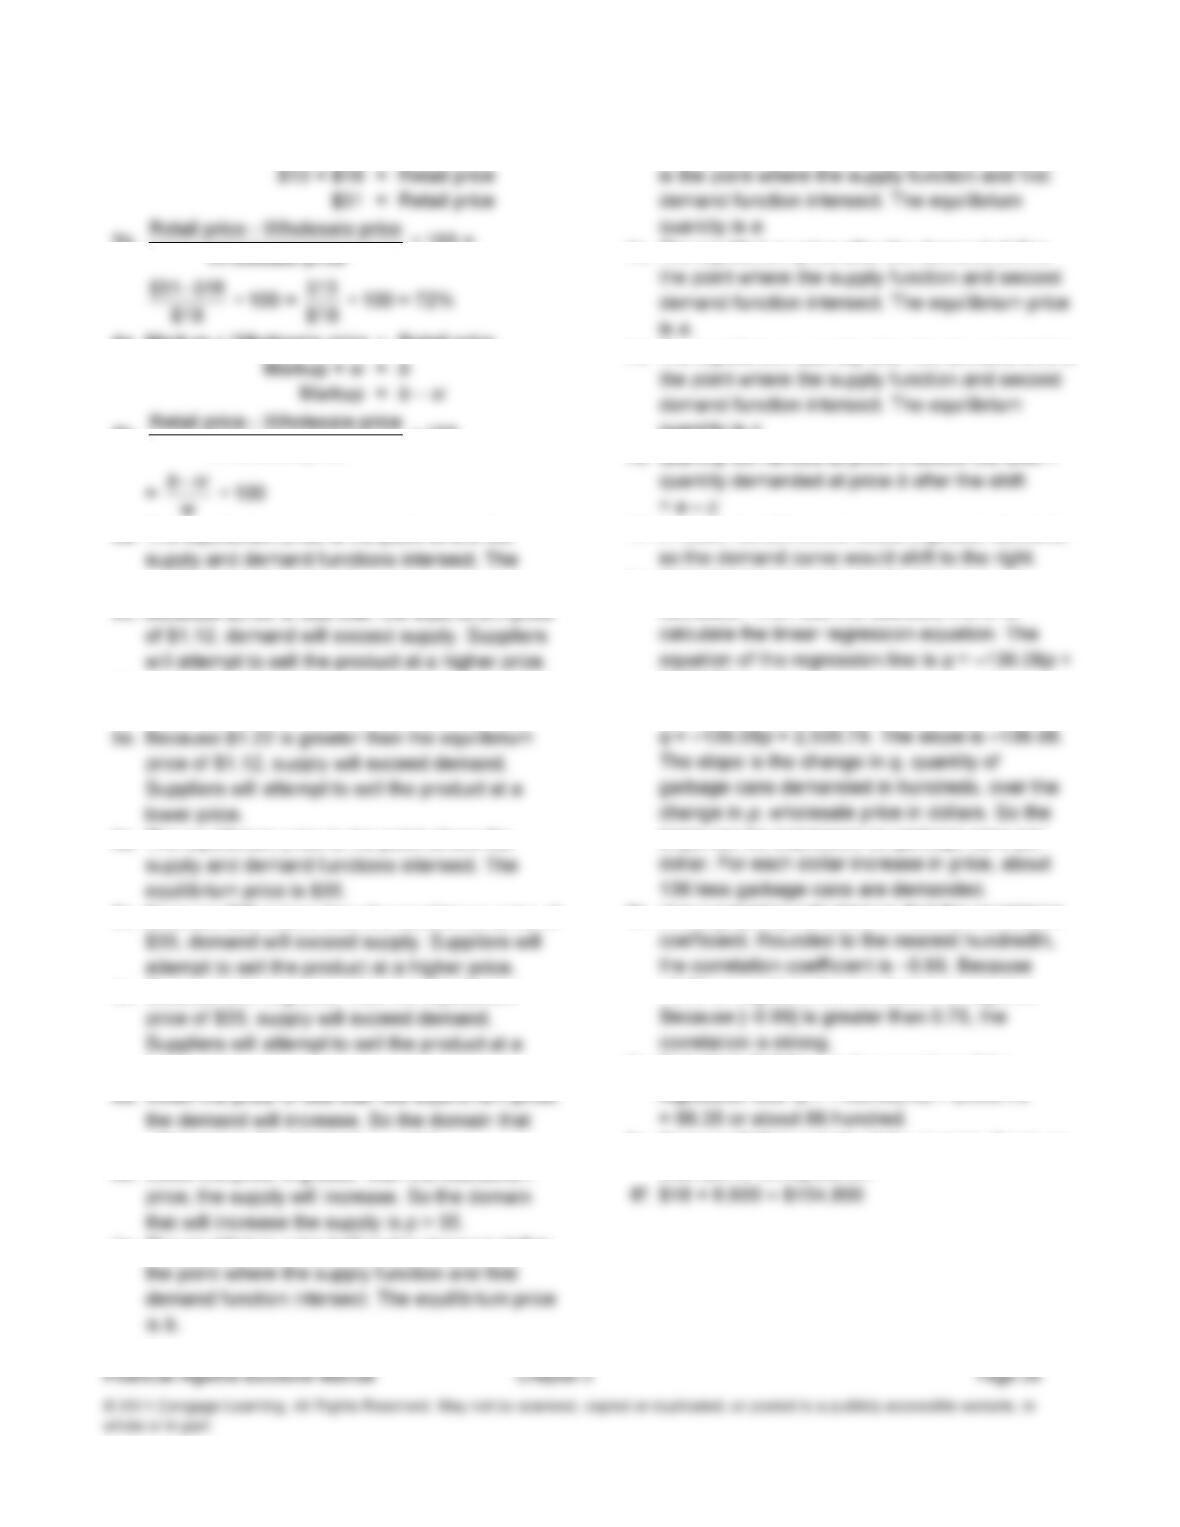
3a. Markup + Wholesale price = Retail price
3b. −Retail price Wholesale price
Wholesale price • 100 =
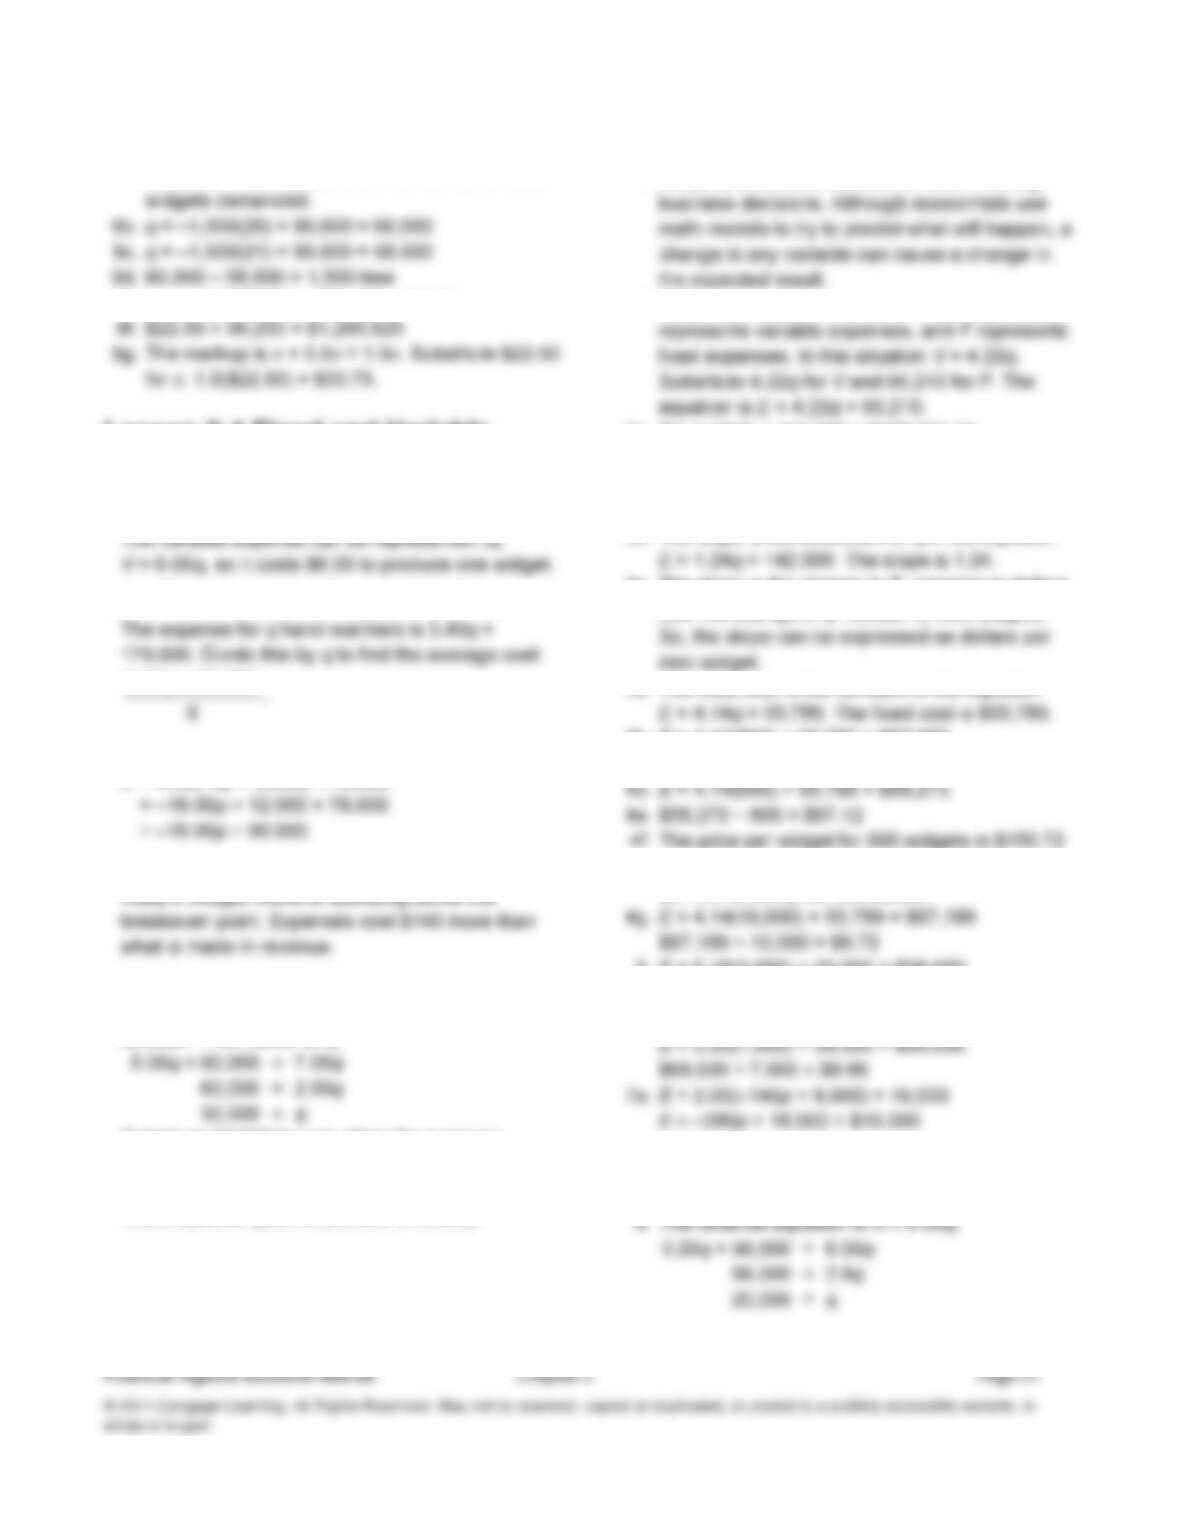
4a. Markup + Wholesale price = Retail price
4b. −Retail price Wholesale price
Wholesale price • 100
5a. The equilibrium price is the point where the
equilibrium price is $1.12.
5b. Because $0.98 is less than the equilibrium price
5c. y
5d. x
6a. The equilibrium price is the point where the
6b. Because $20 is less than the equilibrium price of
6c. Because $40 is greater than the equilibrium
lower price.
6d. When the price is less than the equilibrium price,
will increase the demand is p < 35.
6e. When the price is greater than the equilibrium
7b. The equilibrium quantity before the demand shift
7c. The equilibrium price after the demand shift is
7d. The equilibrium quantity after the demand shift is
quantity is c.
7e. quantity demanded at price b before the shift –
7f. A health benefit would cause a greater demand,
8a. Enter the data from the table into your
calculator. Then use the statistics menu to
2,535.79.
8b. The slope is the coefficient of p in the equation
slope can be expressed as garbage cans per
8c. Use a graphing calculator to find the correlation
–0.99 is negative, the correlation is negative.
8d. Substitute $18 for p in the equation of the
regression line: q = –136.08(18) + 2,535.79
8e. Because $18 is outside of the domain, this is an
example of extrapolation.
9a. The slope is –1,500, so for each dollar increase
in the wholesale price, there will be 1,500 fewer
9e. q = –1,500(22.50) + 90,000 = 56,250
Lesson 2-4 Fixed and Variable
Expenses
Check Your Understanding (Example 1)
Check Your Understanding (Example 2)
+340 189000.,q
.
Check Your Understanding (Example 3)
E = 4.00(–4p + 3,000) + 78,000
Check Your Understanding (Example 4)
Check Your Understanding (Example 5)
Set the expense function equal to the revenue
function. Then solve for q.
Substitute 30,000 for q in either the expense
function or the revenue function.
R = 7.00(30,000) = 210,000
The breakeven point is (30,000, 210,000).
Applications
1. Many variables are considered when making
2.
E = V + F, where E represents total expense, V
3a. E = 1.24(1) + 142,900 = $142,901.24
3b. E = 1.24(20,000) + 142,900 = $167,700
3c. E = V + F and V = 1.24q
E = 1.24q + 142,900
3e. The slope is the change in E, expense in dollars,
over the change in q, number of mini-widgets.
4a. The fixed cost is the constant in the equation
4b. E = 4.14(500) + 55,789 = $57,859
4c. $57,859 ÷ 500 = $155.72
and the price per widget for 600 widgets is
5.
E = 5.15(3,000) + 23,500 = $38,950
$38,950 ÷ 3,000 = $12.98
6.
E = 5.00q + 34,000
E = –280p + 34,000
7b. q = –140(10) + 9,000 = $7,600
7c. E = 2.00(7,600) + 16,000 = $31,200
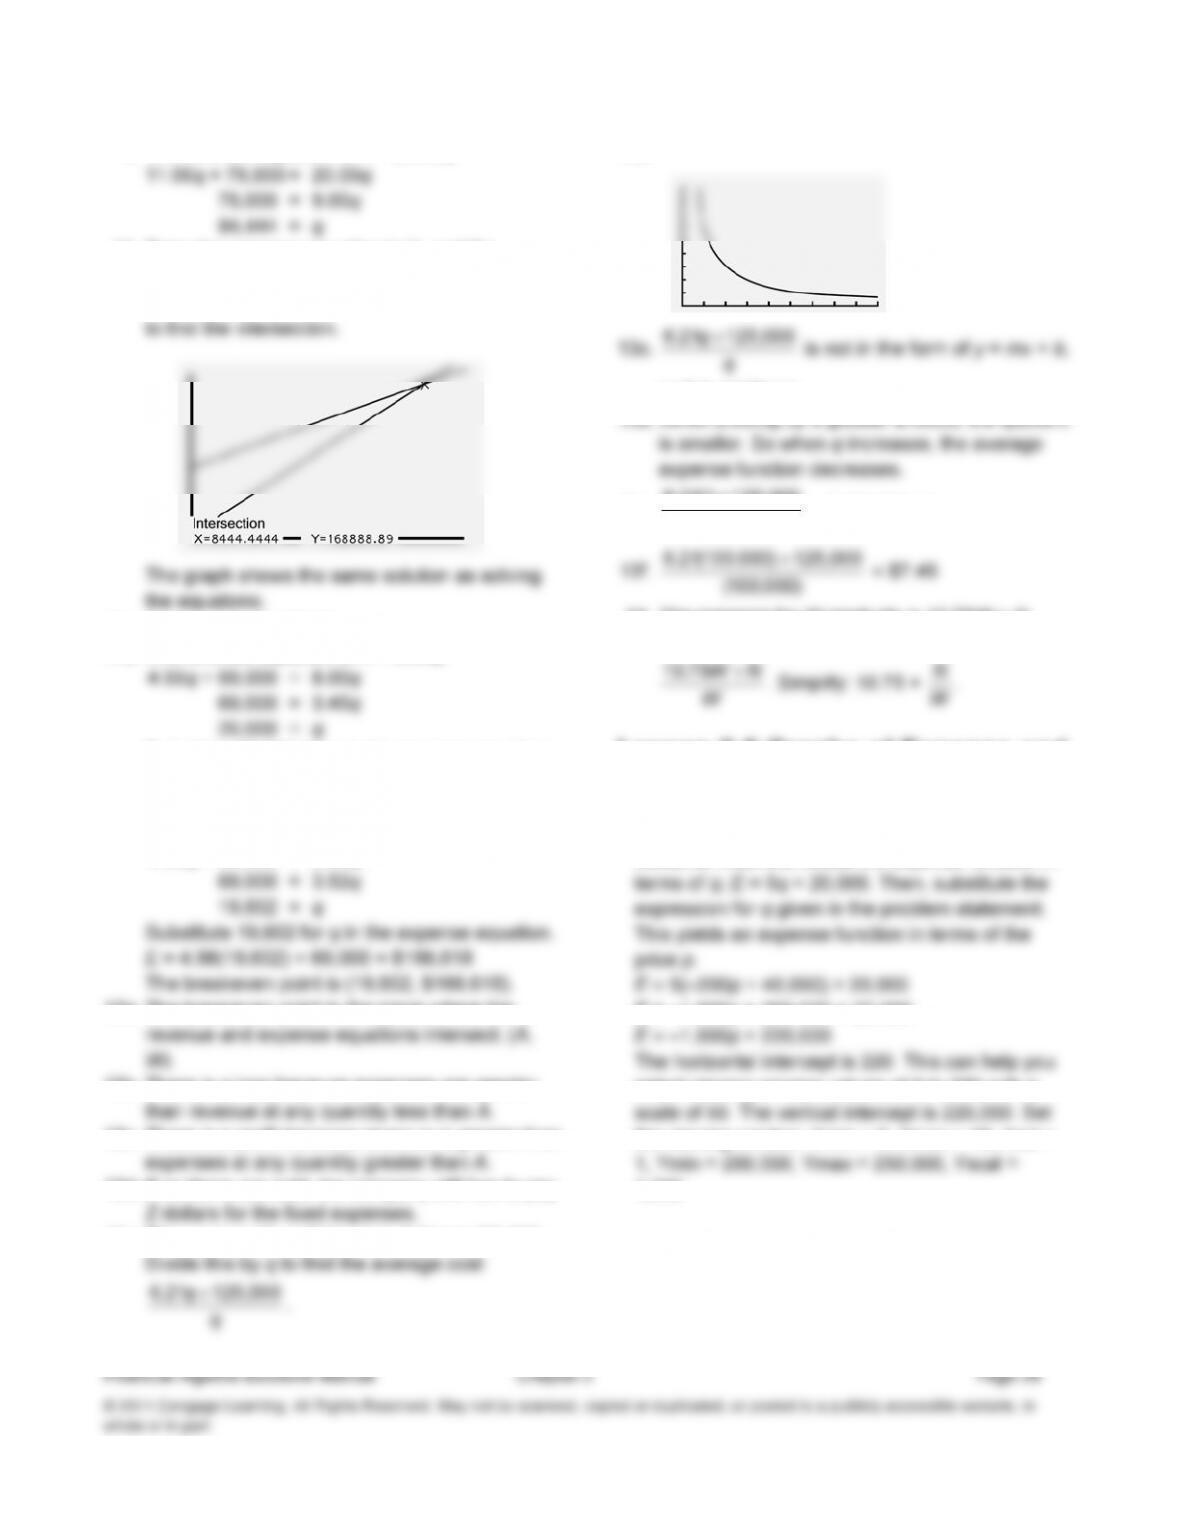
9. The revenue equation is R = 20.00q.
10. Enter the expense equation in Y1 and the
revenue equation in Y2. Use the ZoomFit feature
to view the graph. Then use the Intersect feature
11a. $4.98 – $4.55 = $0.43
11b. The revenue equation is R = 8.00q.
Substitute 20,000 for q in the expense equation.
E = 4.55(20,000) + 69,000 = $160,000
The breakeven point is (20,000, $160,000).
11c. The revenue equation is R = 8.50q.
4.98q + 69,000 = 8.50q
12a. The breakeven point is the place where the
12b. There is a loss because expenses are greater
12c. There is a profit because revenue is greater than
12d. If no items are sold, the company still has to pay
13a. The expense for q Nokee’s is 6.21q + 125,000.
13b.
14. The expense for
W products is 10.75W + N.
Divide this by W to find the average cost:
+
10 75.WN
Lesson 2-5 Graphs of Expense and
Revenue Functions
Check Your Understanding (Example 1)
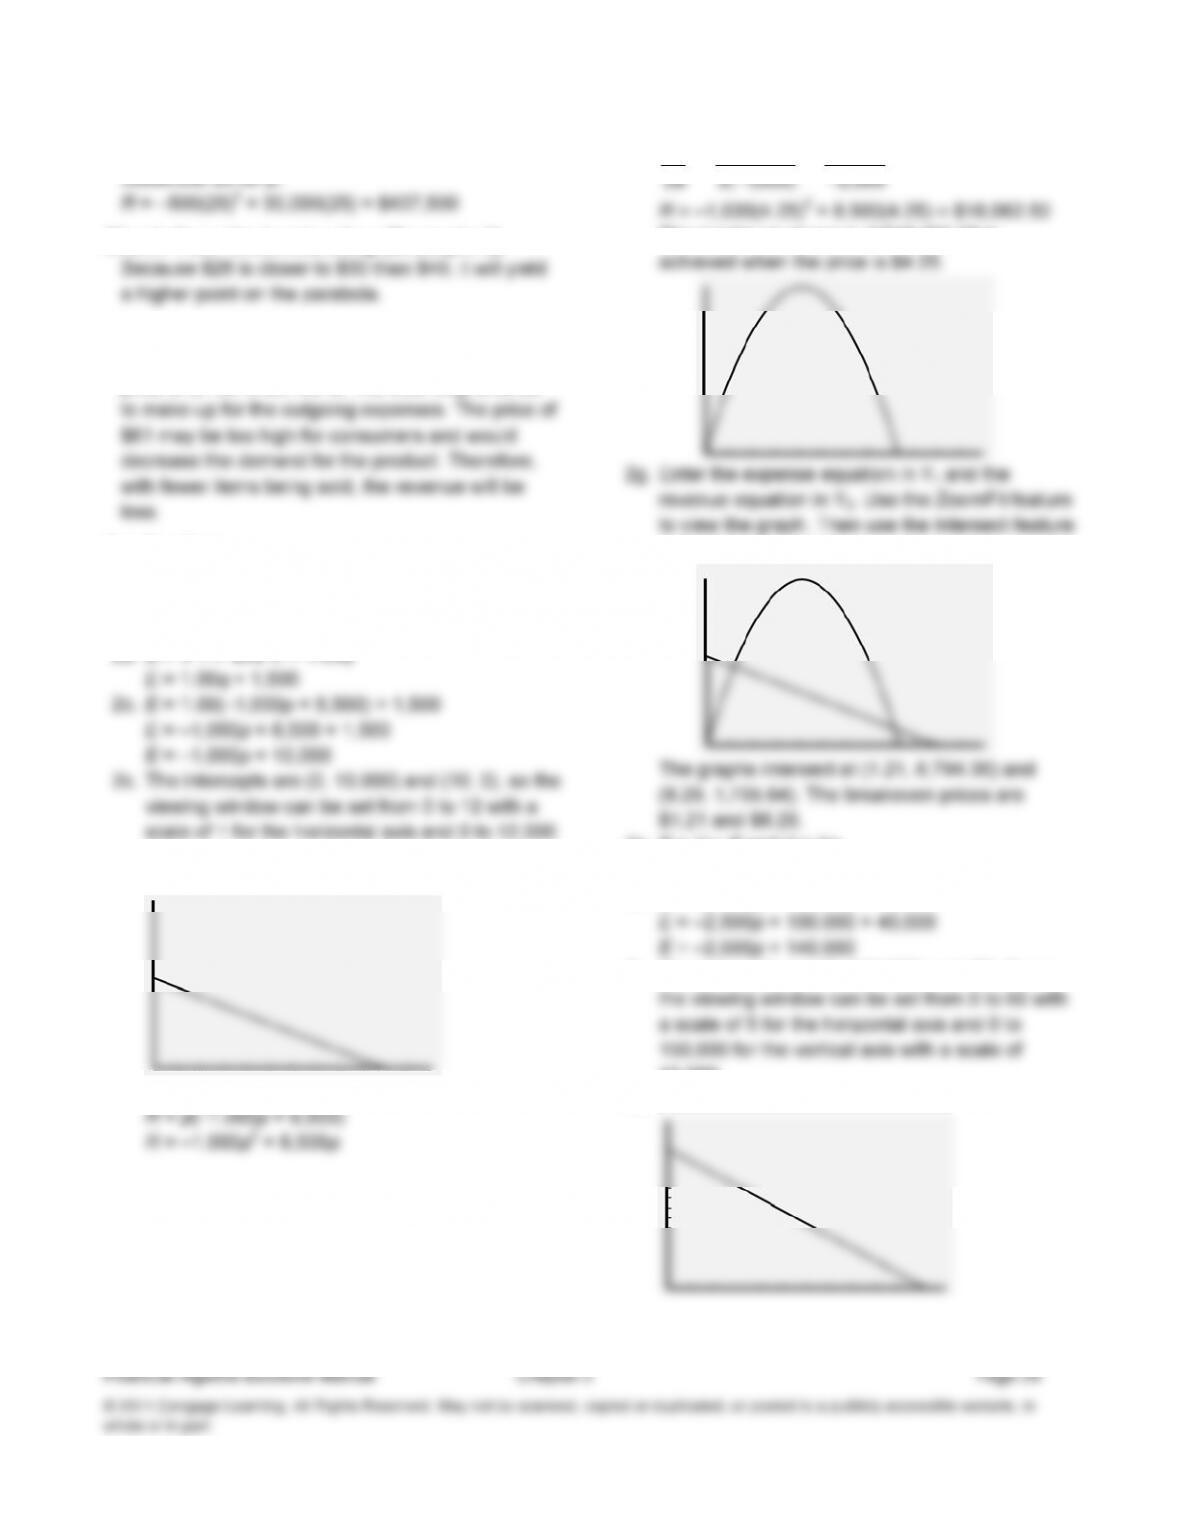
Students must first create the expense function in
E = –1,000p + 200,000 + 20,000
select viewing window values of 0 to 250 with a
the viewing window: Xmin = 0, Xmax = 15, Xscl =
1,000.
Check Your Understanding (Example 2)
Check Your Understanding (Example 3)
Applications
1. Emerson cautions to be aware of the fact that
the expenses involved in making revenue are
often more than the revenue itself.
2a.
E = V + F and V = 1.00q
for the vertical axis with a scale of 100.
2d.
2e. R = pq
2f.
−
b
8 500
,
= −
8500
,
The maximum revenue of $18,062.50 is
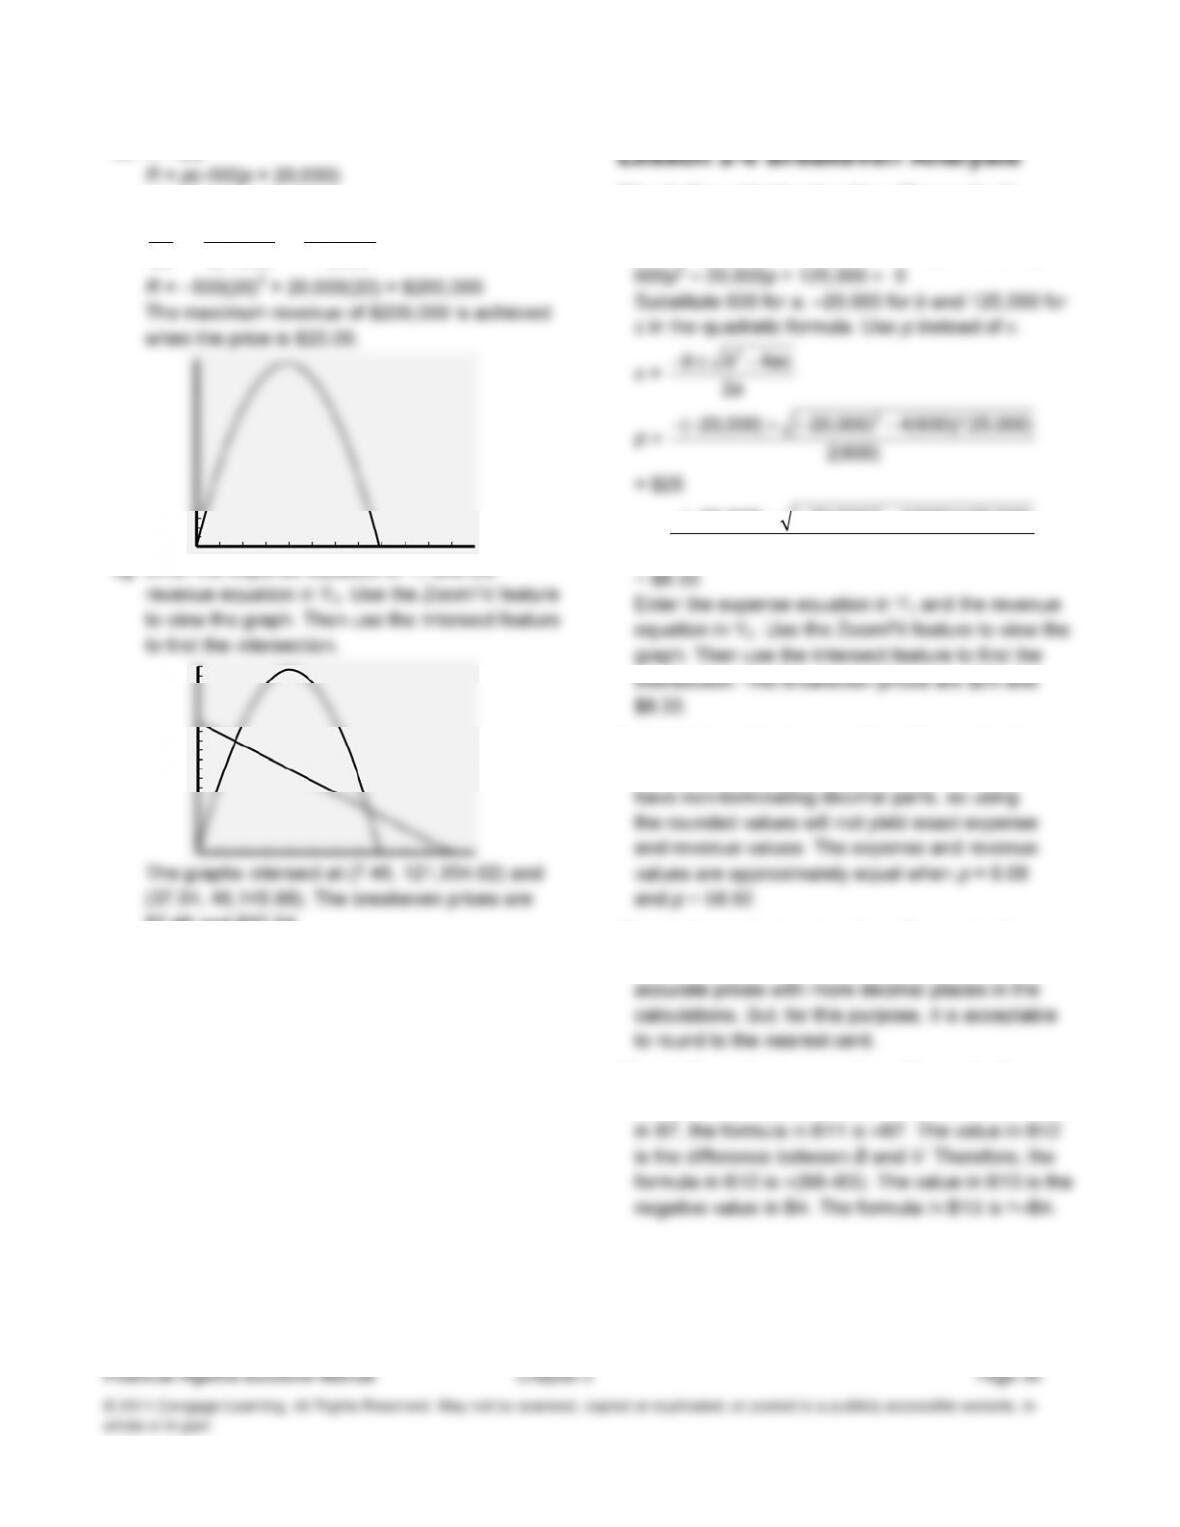
to find the intersection.
3a.
E = V + F and V = 5q
E = 5q + 40,000
3b. E = 5(–500p + 20,000) + 40,000
3c. The intercepts are (0, 140,000) and (56, 0), so
10,000.
3d.
3e. R = pq
R = –500p2 + 20,000p
3f. −
2
b
a = −
−
20 000
2500
,
()
= −
−
20 000
1000
,
, = 20
3g. Enter the expense equation in Y1 and the
$7.46 and $37.54.
Check Your Understanding (Example 1)
E = R
–2,000p + 125,000 = –600p2 + 18,000p
p = −− − − −
2
20 000 20 000 4 600 125 000
2600
(
,
)(
,
)()(
,
)
()
Check Your Understanding (Example 2)
The error could have been improved by using more
Check Your Understanding (Example 3)
Because the value in B11 is the same as the value
Applications
1. Warren Buffet speaks to the need to be
knowledgeable in order to minimize or eliminate
2. Divide the expense by the number of items:
3a. Divide the expense by the number of items:
3b. “Twice as many kits” means 2G and “80% of the
.W
4a. 1,250q + 800,000 = 2,600,000
4b. 1,250q + 800,000 = 3,500,000
2,160 is greater than 1,440, so the quantity
demanded increased.
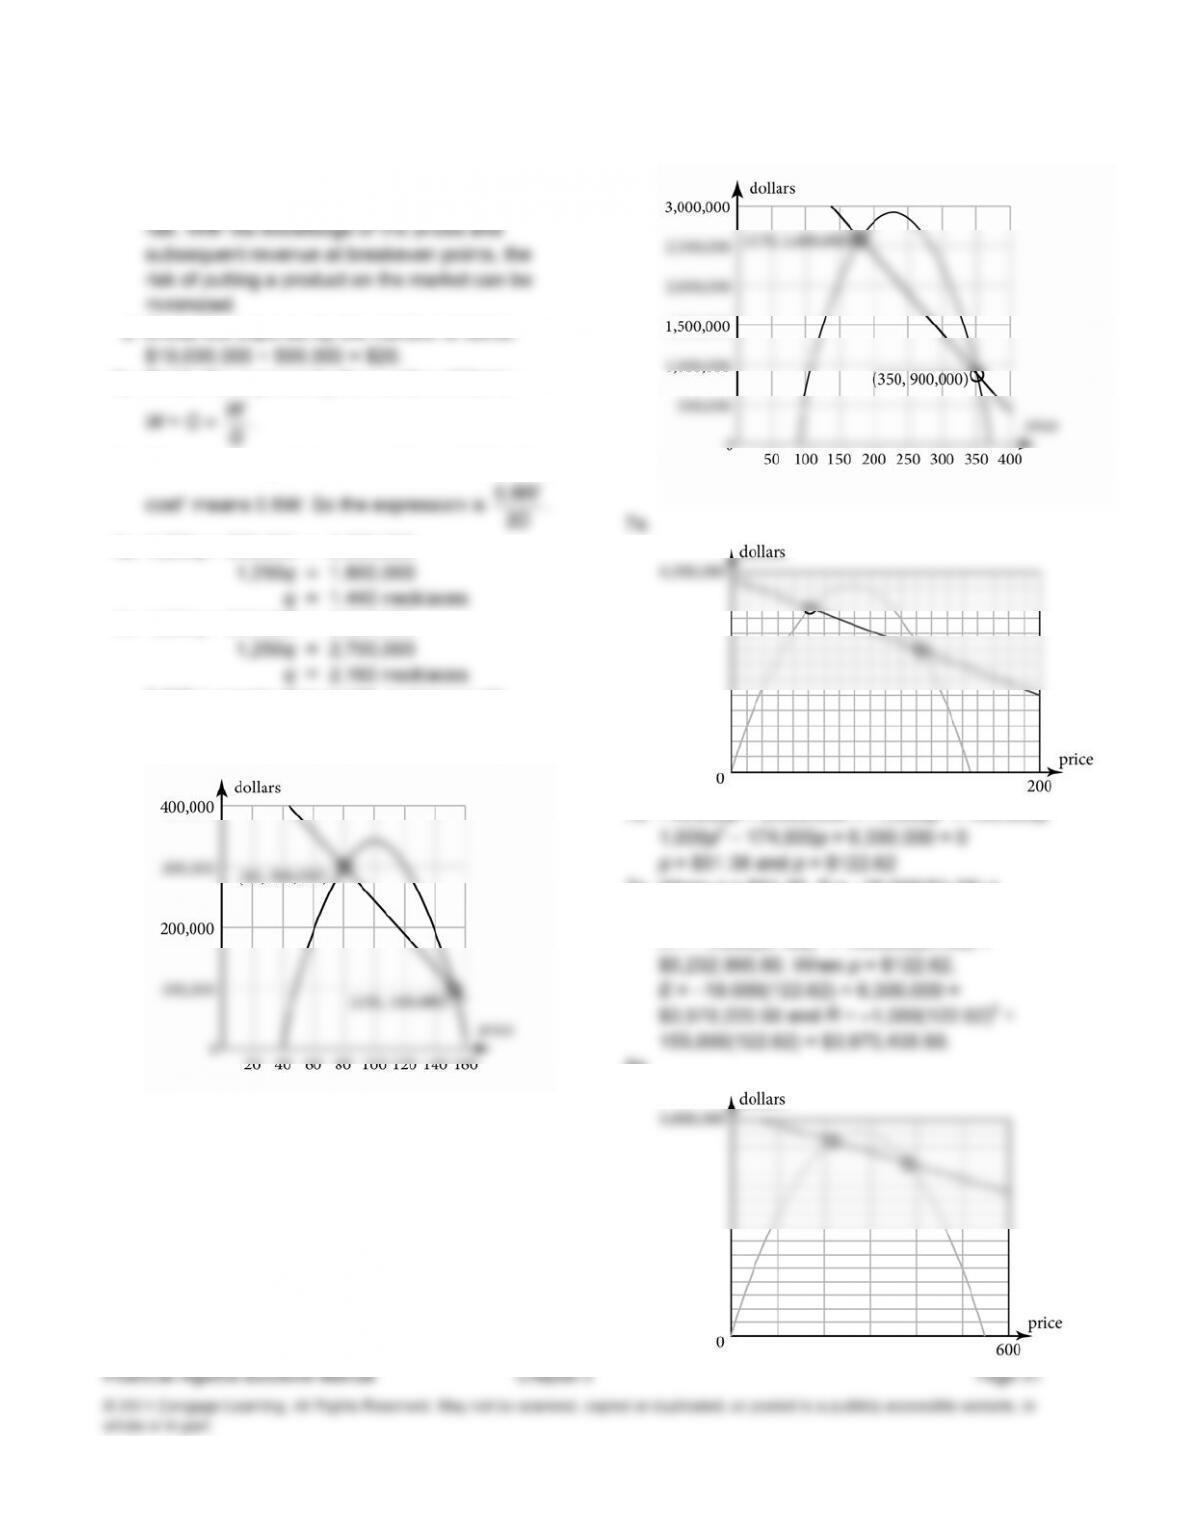
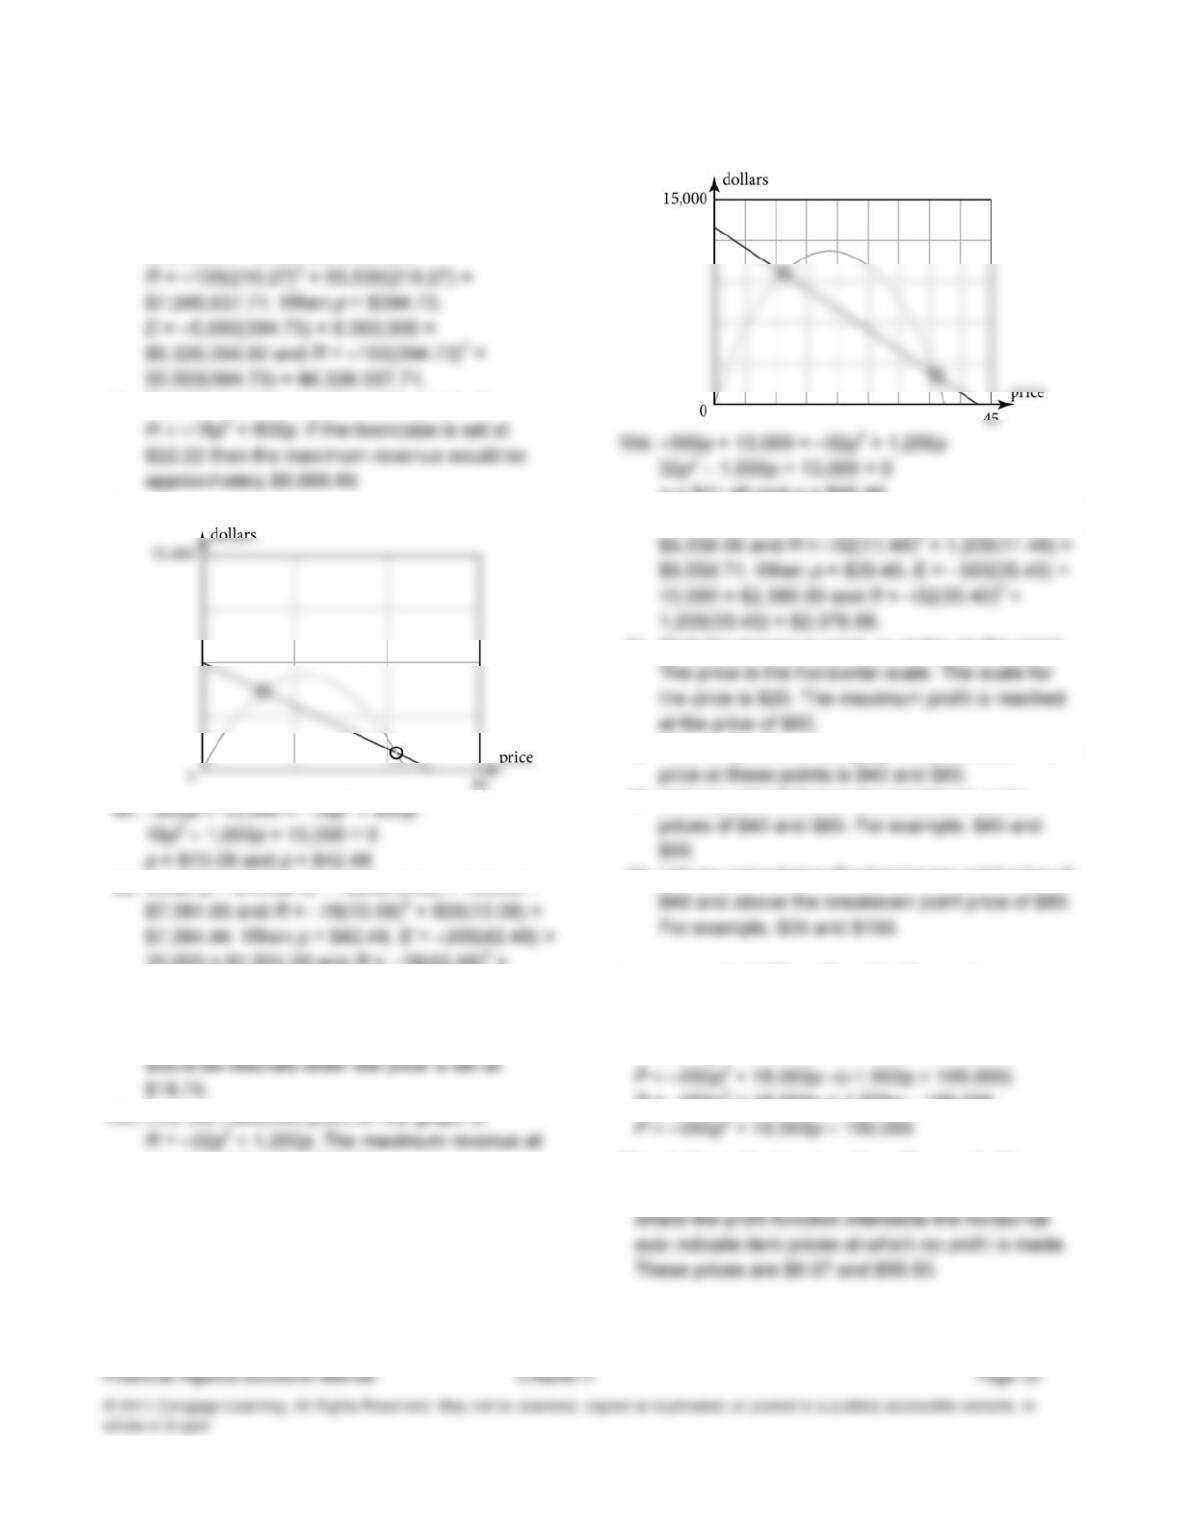
5. Answers vary. Sample graph is shown.
6. Answers vary. Sample graph is shown.
7b. –19,000p + 6,300,000 = –1,000p2 + 155,000p
7c. When
p = $51.38, E = –19,000(51.38) +
6,300,000 = $5,323,780.00 and
R = –1,000(51.38)2 + 155,000(51.38) =
8b. –5,000p + 8,300,000 = –100p2 + 55,500p
100p2 – 60,500p + 8,300,000 = 0
p = $210.27 and p = $394.73
8c. When
p = $210.27, E = –5,000(210.27) +
8,300,000 = $7,248,650.00 and
9a. Find the maximum point on the graph of
9b.
9d. When
p = $13.08, E = –200(13.08) + 10,000 =
10,000 = $1,504.00 and R = –18(42.48)2 +
800(42.48) = $1,502.09.
10a. Find the maximum point on the graph of
R = –32p2 + 1,200p. The maximum revenue
10b. Find the maximum point on the graph of
price $18.75 is $11,250.00.
10c.
p = $11.48 and p = $35.40
10e. When p = $11.48, E = –300(11.48) + 13,000 =
11. Find the maximum point, or vertex on the graph.
12. Find the points on the graph that intersect. The
13. List any price between the breakeven point
14. List any price below the breakeven point price of
Lesson 2-7 The Profit Equation
Check Your Understanding (Example 1)
P = R – E
P = –350p2 + 18,000p + 1,500p – 199,000
Check Your Understanding (Example 2)
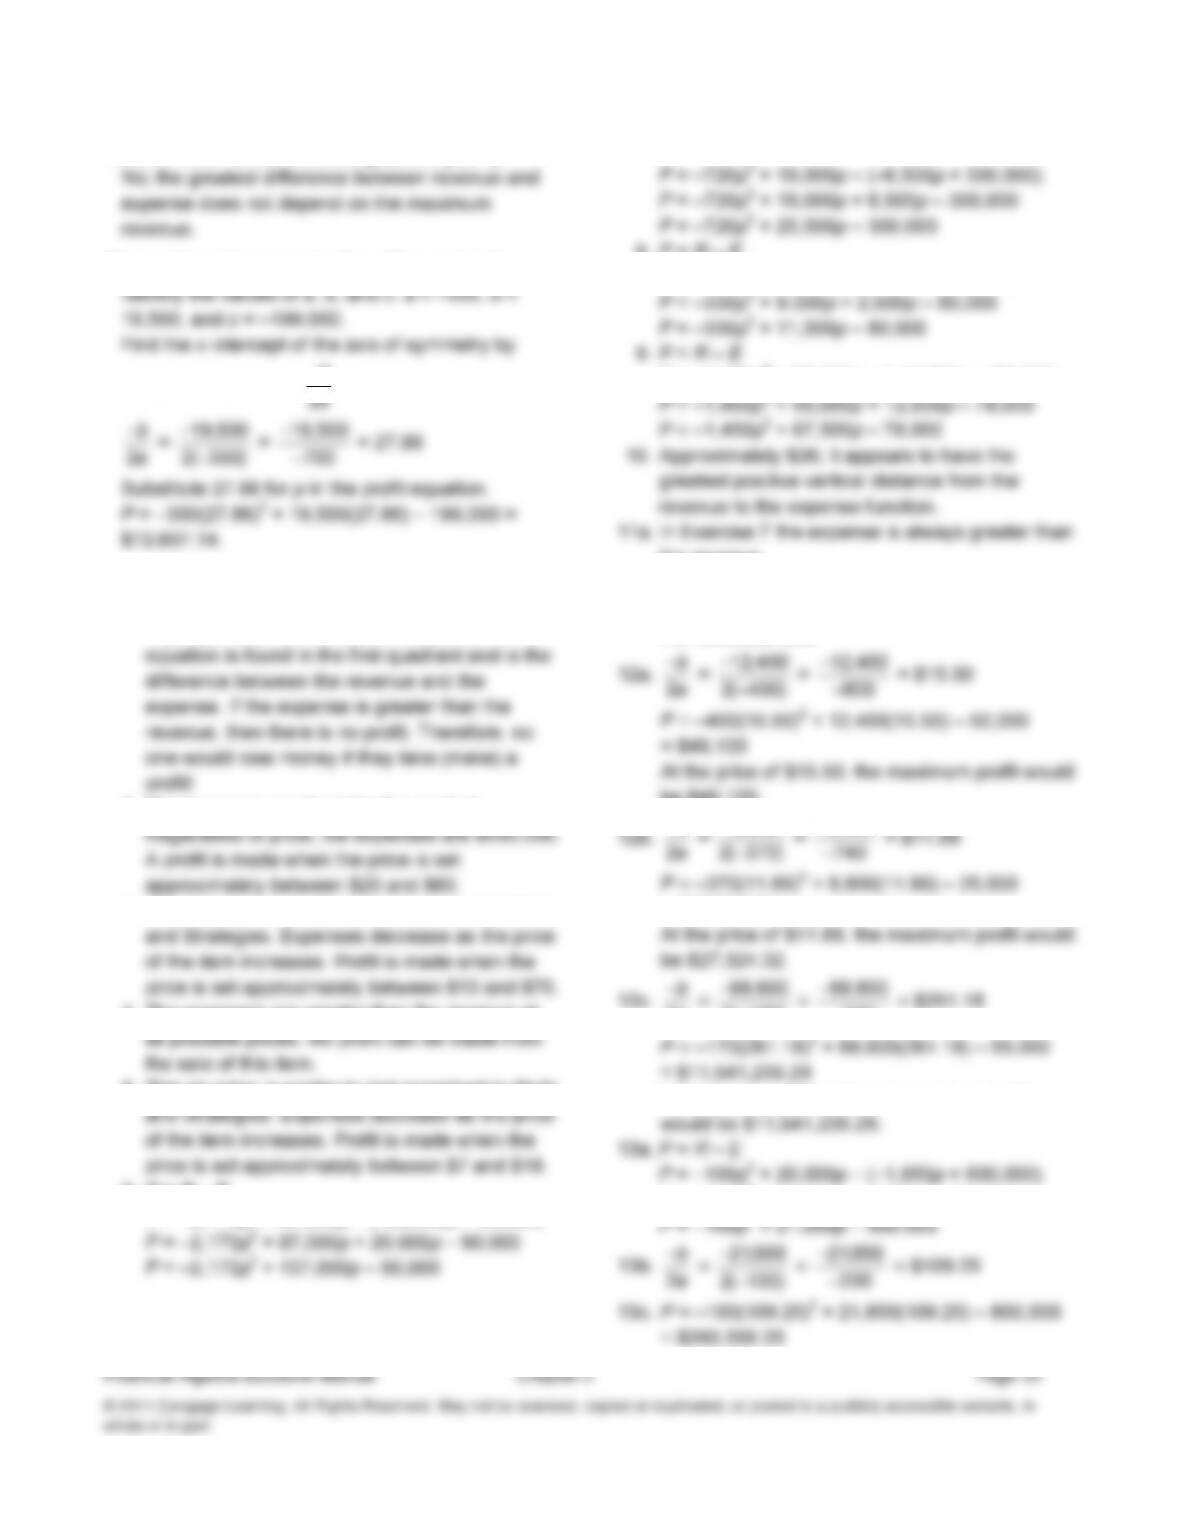
The graph is shown in Example 2. The two points
Check Your Understanding (Example 3)
Check Your Understanding (Example 4)
using the expression −
b
Applications
1. A person would lose money when the expense
is greater than the revenue. A true profit
−
2. The expenses are fixed for this product.
3. This situation is similar to that examined in Skills
7.
P = R – E
8.
P = R – E
P = –330p2 + 9,000p – (–2,500p + 80,000)
P = –1,450p2 + 55,000p – (–12,500p + 78,000)
the revenue.
11b. If expenses are always greater than the
revenue, the profit parabola will lie entirely below
the horizontal axis.
be $46,100.
−
b
8 800
,
8800
,= $11.89
= $27,324.32
14a. P = R – E
P = –185p2 + 9,000p – (–450p + 90,000)
14b. −
2
b
a
=−
−
9450
2185
,
()
=−
−
9450
370
,= $25.54
14c. P = –185(25.54)2 + 9,450(25.54) – 90,000 =
15a. P = R – E
P = –225p2 + 7,200p – (–250p + 50,000)
()
15c. P = –225(16.56)2 + 7,450(16.56) – 50,000 =
16a. P = R – E
16b. −
b
=−
6 800
,
=−
6800
,= $12.36
16c. P = –275(12.36)2 + 6,800(12.36) – 32,000 =
Lesson 2-8 Mathematically
Modeling a Business
Check Your Understanding (Example 1)
Extend Your Understanding (Example 1)
Once the value of z is known, then y can be
Check Your Understanding (Example 2)
The maximum point on the profit function is (40,
$800,000. Subtract the expense from the revenue:
$800,000 – $420,000 = $380,000.
not reality. There are a fixed number of variables
that are used in models. In reality, there are
function and the revenue function, so this is the
2b. (E, A) is the vertex of the parabola, so this is the
second breakeven point.
the horizontal axis, so this is a price at which no
2e. (H, 0) is on the expense function and intersects
the horizontal axis, so this is a price at which
there are no expenses.
2f. The maximum profit occurs where there is the
greatest vertical difference between the revenue
and expense functions. It appears that this might
5. As the price of a product increases, the demand
7. Enter the ordered pairs into your calculator.
8. Based on the correlation coefficient of –0.92, the
linear regression line is a good predictor.
9.
r = –0.92; This is a significant correlation
11. The revenue equation is R = pq.
13. E = 6.12q + 24,500
E = 6.12(–423.61p + 14,315.94) + 24,500
14a. Set the expense function equal to 0.
0 = –2,592.49p + 112,113.55
–112,113.55 = –2,592.49p
43.25 ≈ p
Since the expense function will intersect the
horizontal axis at about 43.25, a maximum
horizontal-axis value of 50 is reasonable.
Since the expense function will intersect the
(16.90, 120,952.13).
The breakeven points are (8.40, 90,343.87) and
(31.52, 30,403.76).
17. P = R – E
P = –423.61p2 + 16,908.43p – 112,113.55
18. Enter the profit equation P = –423.61p2 +
16,908.43p – 112,113.55 into a graphing
calculator. The maximum profit is the vertex of
the parabola. Use the maximum feature on your
19a. To start this business, make the number of
$8.40.
19d. There are two prices that cause the revenue and
19e. At the selling price of $19.96, the revenue is –
423.61(19.96)2 + 14,315.94(19.96) =
19g. The profit is the revenue minus the expense:
$116,979.26 – $60,367.45 = $56,611.81.
20. To start the business, there has to be enough
up to the next whole stock to ensure that there is
enough money for the expenses. So there
Assessment
Really? Really! Revisited
1. Look at the first section of bars, which is
2. Look at the fifth section of bars, which is
condition 2. The year 2008 is the green bar. The
3. Subtract the value of a 1958 Villager in a
4. The value for the 1958 Villager in a condition of
2 in 1999 is about $7,000. The value for the
Applications
1a. As the x-values increase, the y-values decrease.
1b. As the
x-values increase, the y-values decrease.
This scatterplot shows a negative correlation.
1c. As the
x-values increase, the y-values do not
2a. In general, as the number of hours spent
reading increases, the number of pages read
increases. An increase in the number of hours
2b. In general, as the number of minutes exercised
increases, the number of calories burned
2c. In general, as the amount of a paycheck
increases, the amount paid in income taxes
2d. In general, as the number of pounds of
hamburger increases, the number of people that
can be fed increases. An increase in the number
explanatory variable and the number of people
that can be fed is the response variable.
4a. Because 0.17 is positive, the correlation is
negative. Because |–0.62| is not less than 0.3
4c. Because –0.88 is negative, the correlation is
4d. Because 0.33 is positive, the correlation is
4e. Because 0.49 is positive, the correlation is
4f. Because –0.25 is negative, the correlation is
negative. Because |–0.25| is less than 0.3, the
4g. Because 0.91 is positive, the correlation is
5a. The equilibrium price is the point where the
5b. Because $7.99 is less than the equilibrium price
of $11.49, demand will exceed supply. Suppliers
price is $7.99. There are 250 game controllers
supplied at a price of $7.99.
5e. Because $12.99 is greater than the equilibrium
6a. E = V + F, where E represents total expense, V
represents variable expenses, and F represents
6b. E = 2q + 500,000
6c. q = –300p + 10,000
q = 4,000
q = –7,500 + 10,000
6e. E = 2q + 500,000
It cost $502,000 to produce 1,000 widgets.
6f.
E = –600p + 520,000
E = –9,000 + 520,000
sell for $15 each.
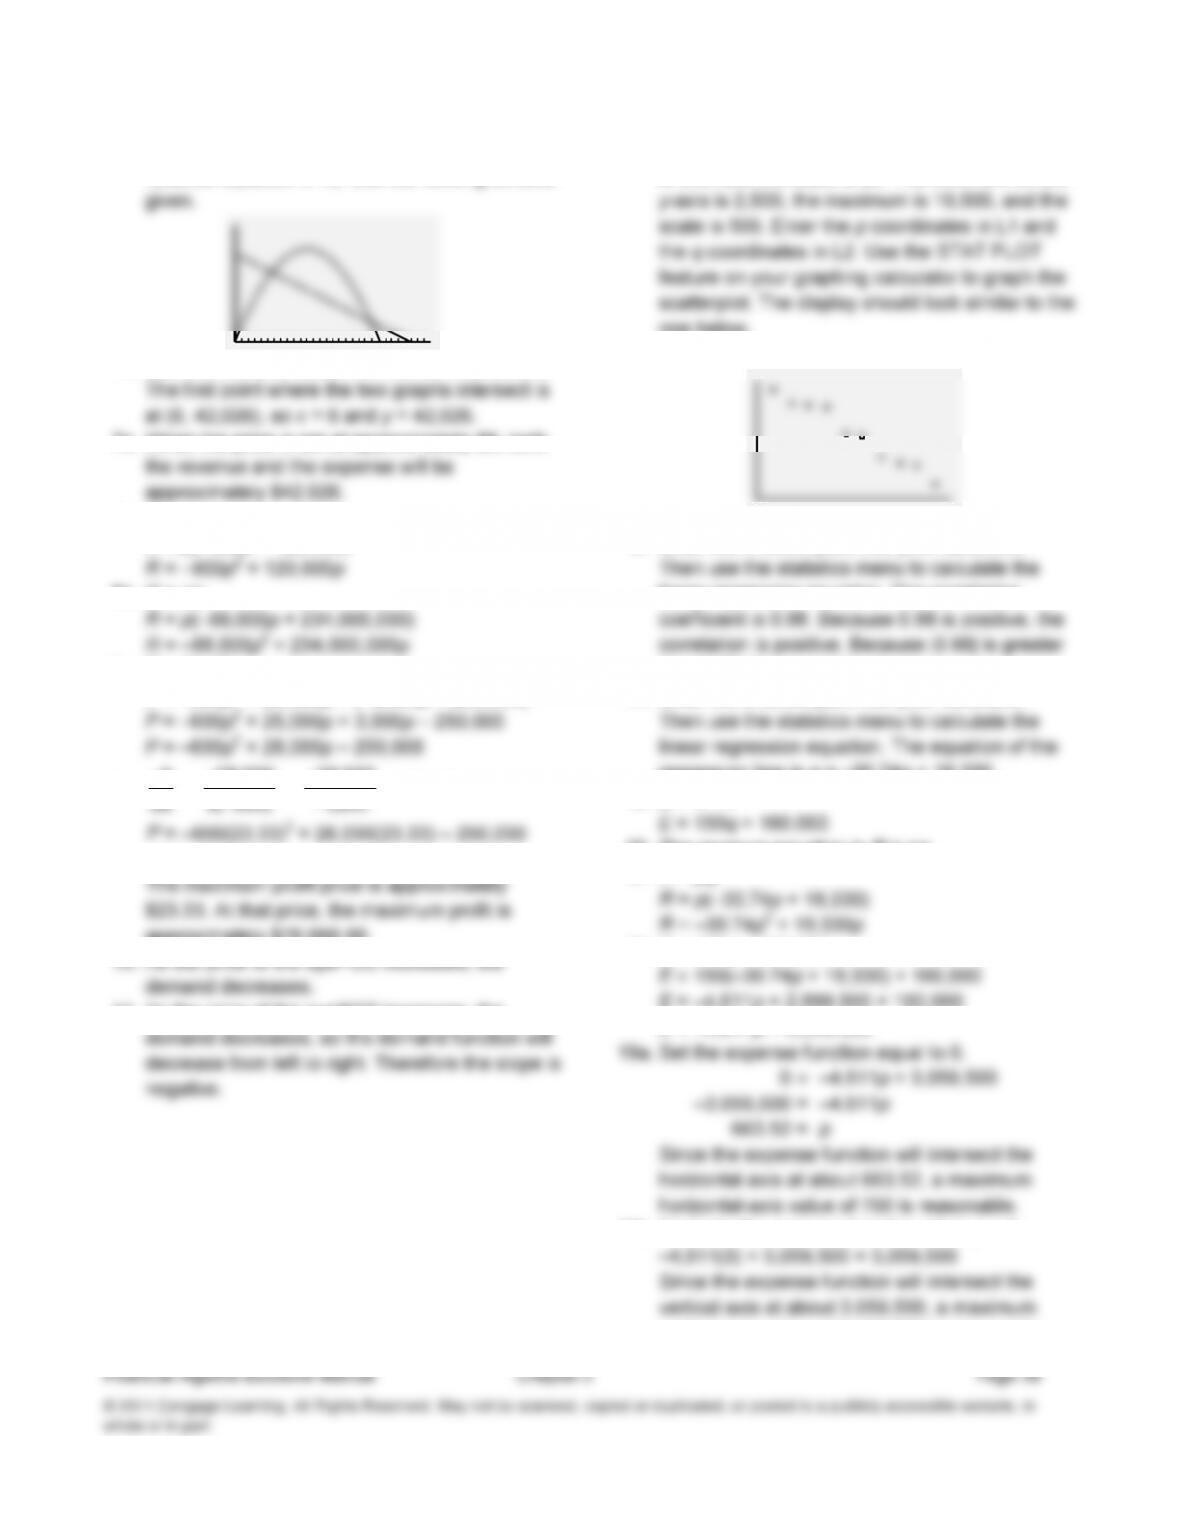
7a. Enter the expense equation in Y1 and the
revenue equation in Y2. Use the viewing window
7b. Use the Intersect feature to find the intersection.
7c. When the price is set at approximately $6, both
8a. R = pq
R = p(–900p + 120,000)
8b. R = pq
9a. P = R – E
P = –600p2 + 25,000p – (–3,000p + 250,000)
9b. −
b
28 000
,
= −
28 000
,
= $76,666.66
approximately $76,666.66.
11. As the price of the eyePOD increases, the
12. The minimum on the x-axis is 275, the maximum
is 550, and the scale is 25. The minimum on the
one below.
13. Enter the ordered pairs into your calculator.
linear regression equation. The correlation
than 0.75, the correlation is strong.
14. Enter the ordered pairs into your calculator.
regression line is q = –30.74p + 19,330.
16. The revenue equation is R = pq.
17. R = pq
18. E = 150q + 160,000
E = –4,611p + 2,899,500 + 160,000
E = –4,611p + 3,059,500
19b. Evaluate the expense function when p = 0.
vertical-axis value of 3,100,000 is reasonable.
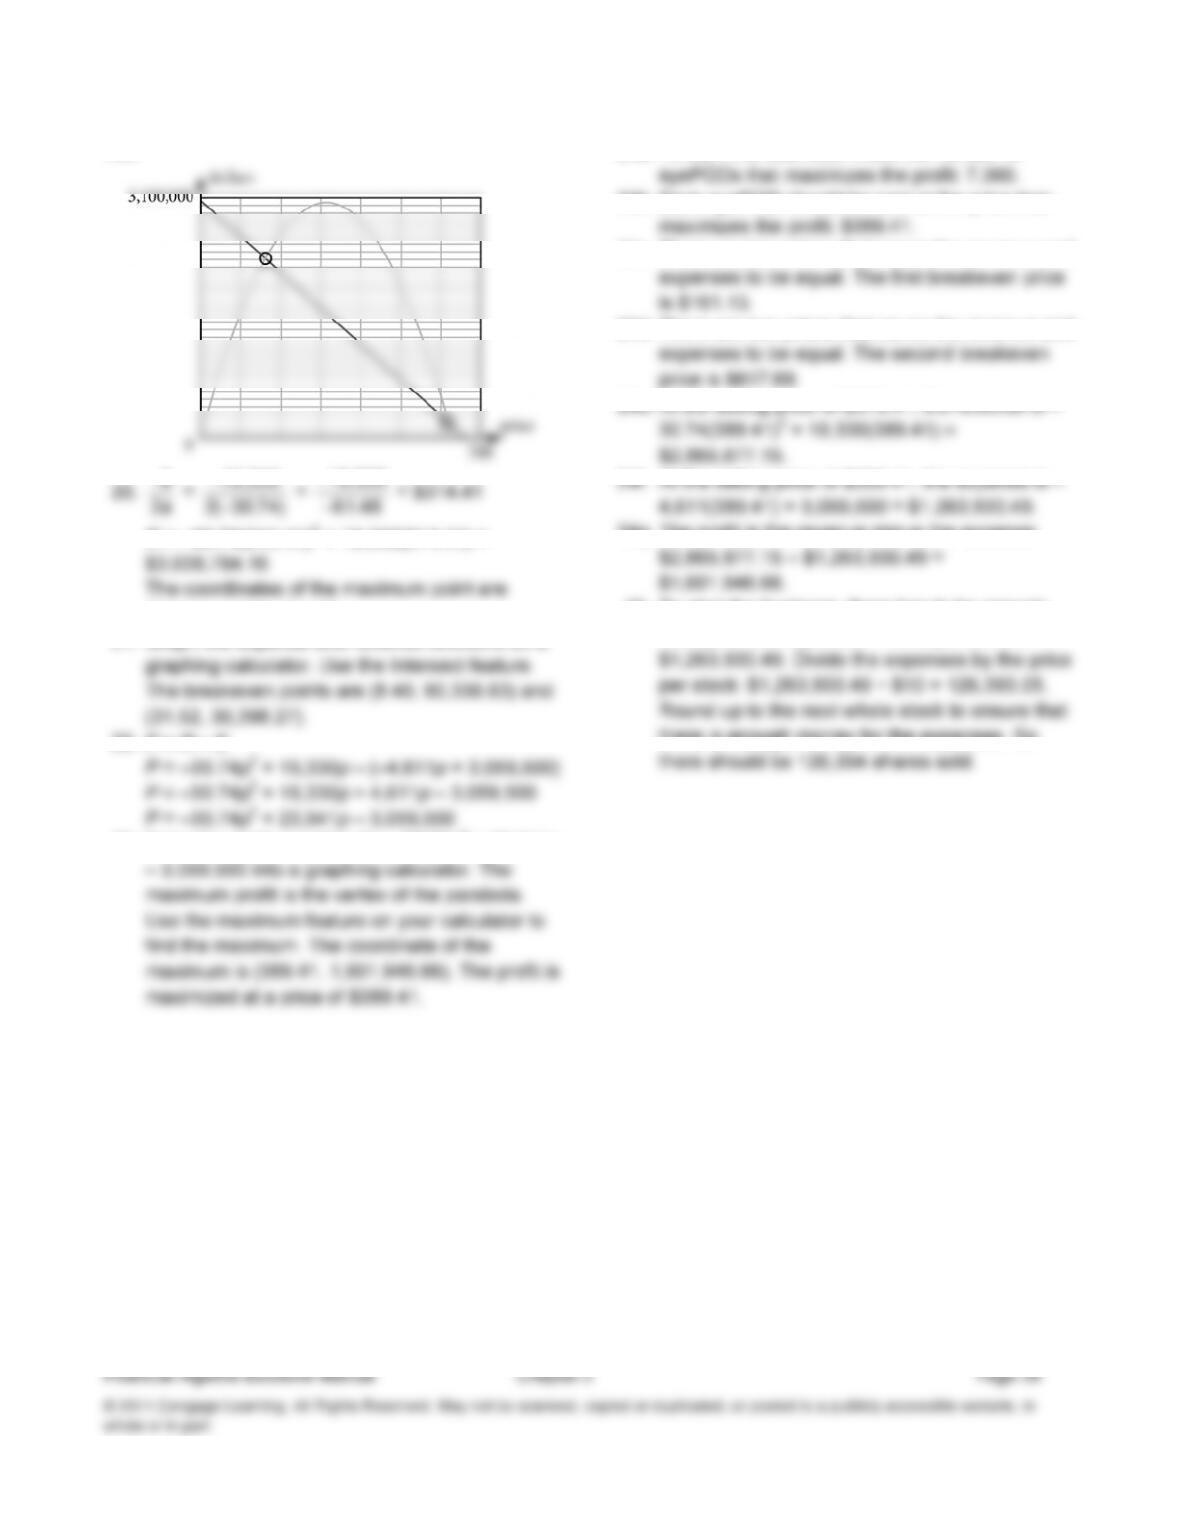
19c. 24a. To start this business, make the number of
24g. The profit is the revenue minus the expense:
R = –30.74(314.41)2 + 19,330(314.41) =
(314.41, 3,038,784.16). 25. To start the business, there has to be enough
money for the expenses. The expenses are
there is enough money for the expenses. So
21. Graph the expense and revenue functions on a
22. P = R – E
23. Enter the profit equation P = –30.74p2 + 23,941p