Chapter 19 – Financial Statement Analysis
19-1
CHAPTER 19: FINANCIAL STATEMENT ANALYSIS
PROBLEM SETS
1. The major difference in approach of international financial reporting standards and
U.S. GAAP accounting stems from the difference between principles and rules.
2. Earnings management should not matter in a truly efficient market, where all
publicly available information is reflected in the price of a share of stock. Investors
3. Both credit rating agencies and stock market analysts are likely to be more or less
interested in all of the ratios discussed in this chapter (as well as many other ratios
4. ROA = ROS ATO
5. ABC’s asset turnover must be above the industry average.
Chapter 19 – Financial Statement Analysis
8. a. Lower bad debt expense will result in higher operating income.
9. A. Certain GAAP rules can be exploited by companies in order to achieve specific
10. A. Off-balance-sheet financing through the use of operating leases is acceptable
11. A. A warning sign of accounting manipulation is abnormal inventory growth as
compared to sales growth. By overstating inventory, the cost of goods sold is
lower, leading to higher profitability.
12.
Debt
ROE (1 ) [ROA (ROA–Interest rate) ]
Equity
t= − +
Chapter 19 – Financial Statement Analysis
19-3
13.
14.
a. Cash flows from investing activities
Sale of old equipment
$72,000
Purchase of bus
(33,000)
Net cash used in investing activities
Cash dividend
(80,000)
Cash collections from customers
$300,000
Cash payments to suppliers
Cash payments for interest
(25,000)
Net cash provided by operating activities
Net increase in cash
$84,000
15. a. The total capital of the firms must first be calculated by adding their respective
CFA PROBLEMS
1. SmileWhite has higher quality of earnings for the following reasons:
• SmileWhite amortizes its goodwill over a shorter period than does
Chapter 19 – Financial Statement Analysis
19-4
2. a.
Equity
Assets
Assets
Sales
Sales
profitsNet
Equity
profitsNet
ROE ==
= Net profit margin Total asset turnover Assets/equity
3. a. CF from operating activities = $260 – $85 – $12 – $35 = $128
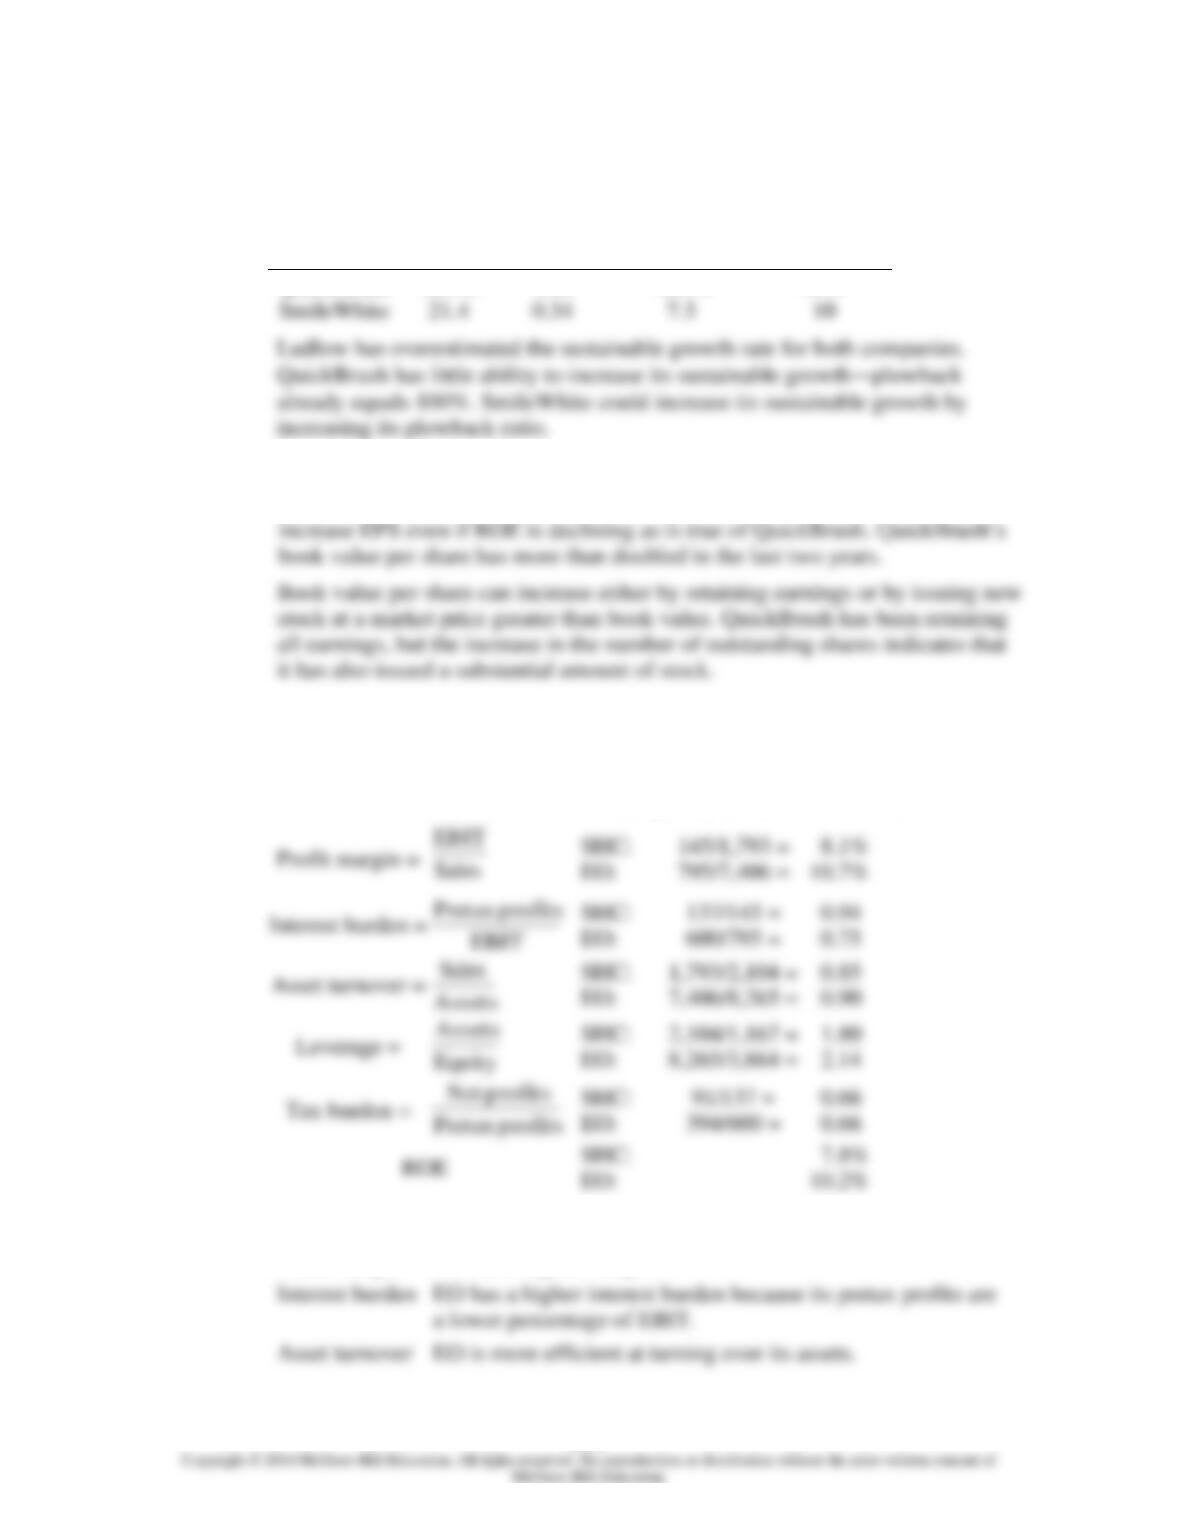
4. a. QuickBrush has had higher sales and earnings growth (per share) than
SmileWhite. Margins are also higher. But this does not mean that QuickBrush
is necessarily a better investment. SmileWhite has a higher ROE, which has
been stable, while QuickBrush’s ROE has been declining. We can see the
source of the difference in ROE using DuPont analysis:
Component
Definition
QuickBrush
SmileWhite
Tax burden (1 – t)
Net profits/pretax profits
67.4%
66.0%
Interest burden
Pretax profits/EBIT
Profit margin
EBIT/Sales
Asset turnover
Sales/Assets
Leverage
Assets/Equity
ROE
Net profits/Equity
12.0%
21.4%
Chapter 19 – Financial Statement Analysis
19-5
Sustainable growth = ROE Plowback ratio
ROE
Plowback
Ratio
Sustainable
Growth
Rate
Ludlow’s
Estimate of
Growth
Rate
QuickBrush
12.0%
1.00
12.0%
30%
SmileWhite
0.34
b. QuickBrush’s recent EPS growth has been achieved by increasing book value
per share, not by achieving greater profits per dollar of equity. A firm can
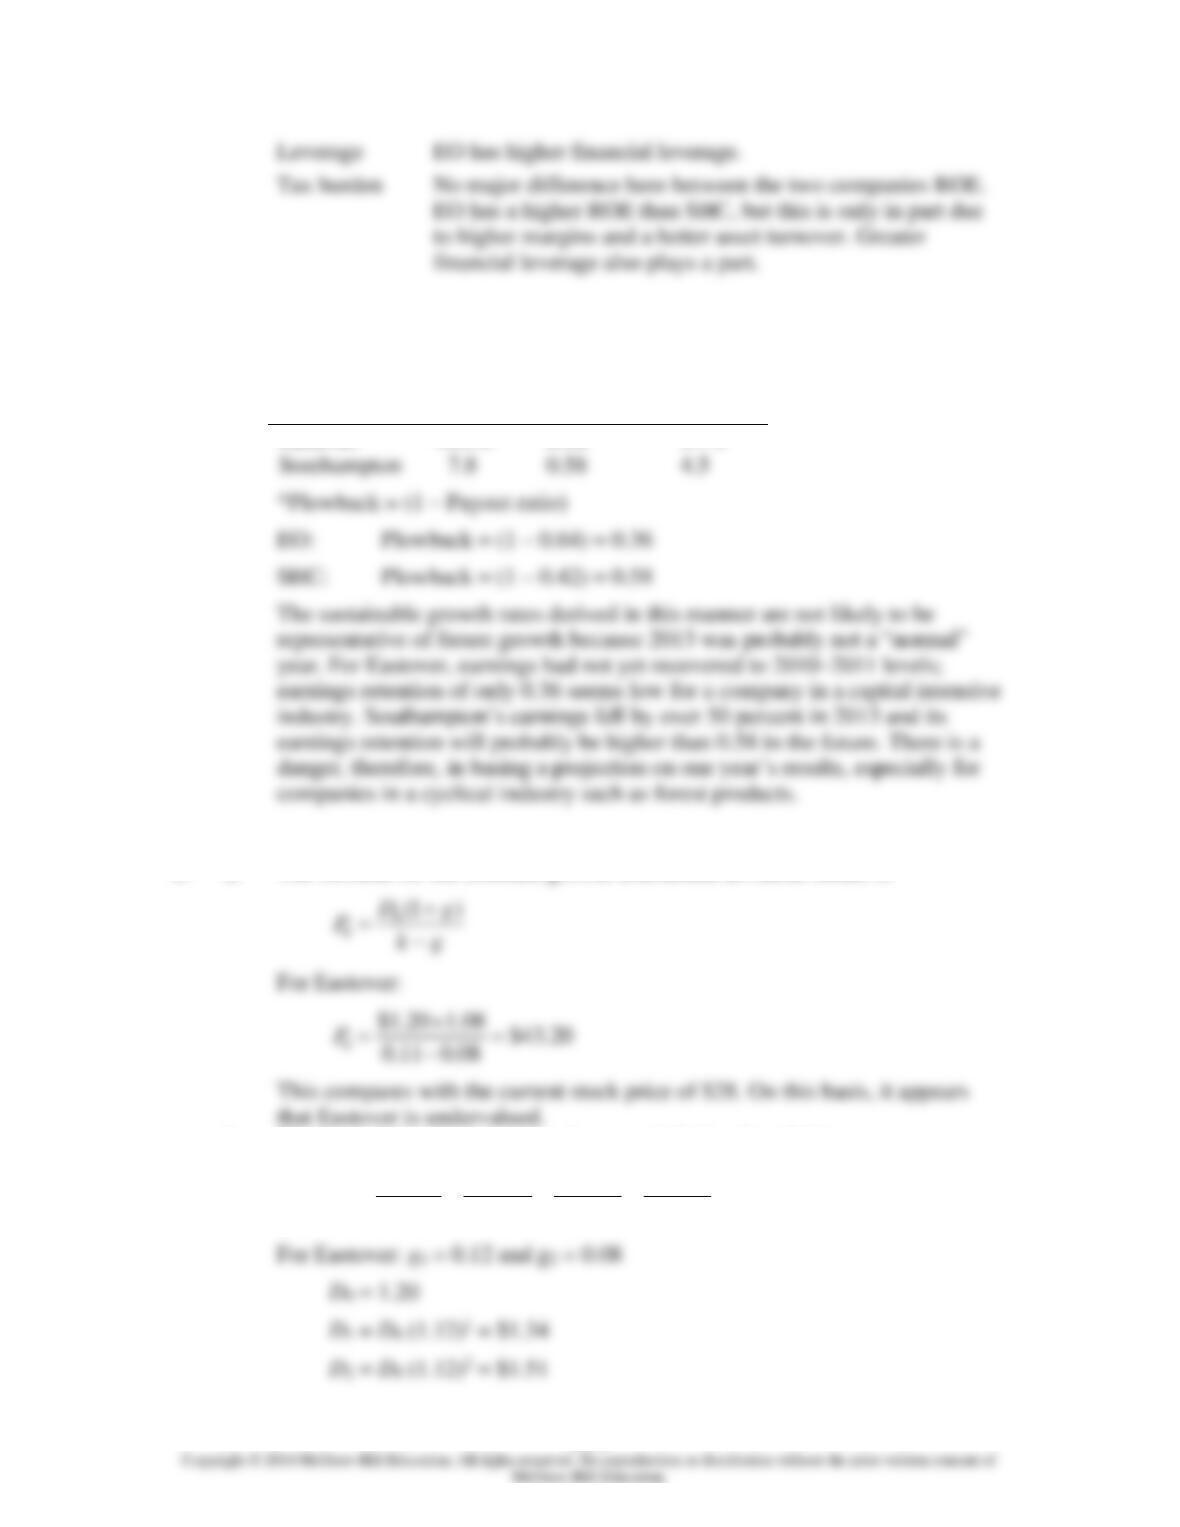
5. a. ROE = Operating margin Interest burden Asset turnover Leverage Tax
burden
ROE for Eastover (EO) and for Southampton (SHC) in 2013 is found as follows:
b. The differences in the components of ROE for Eastover and Southampton are:
Profit margin EO has a higher margin.
Chapter 19 – Financial Statement Analysis
19-6
c. The sustainable growth rate can be calculated as ROE times plowback ratio.
The sustainable growth rates for Eastover and Southampton are as follows:
ROE
Plowback
Ratio*
Sustainable
Growth Rate
Eastover
10.2%
0.36
3.7%
Southampton
0.58
4.5
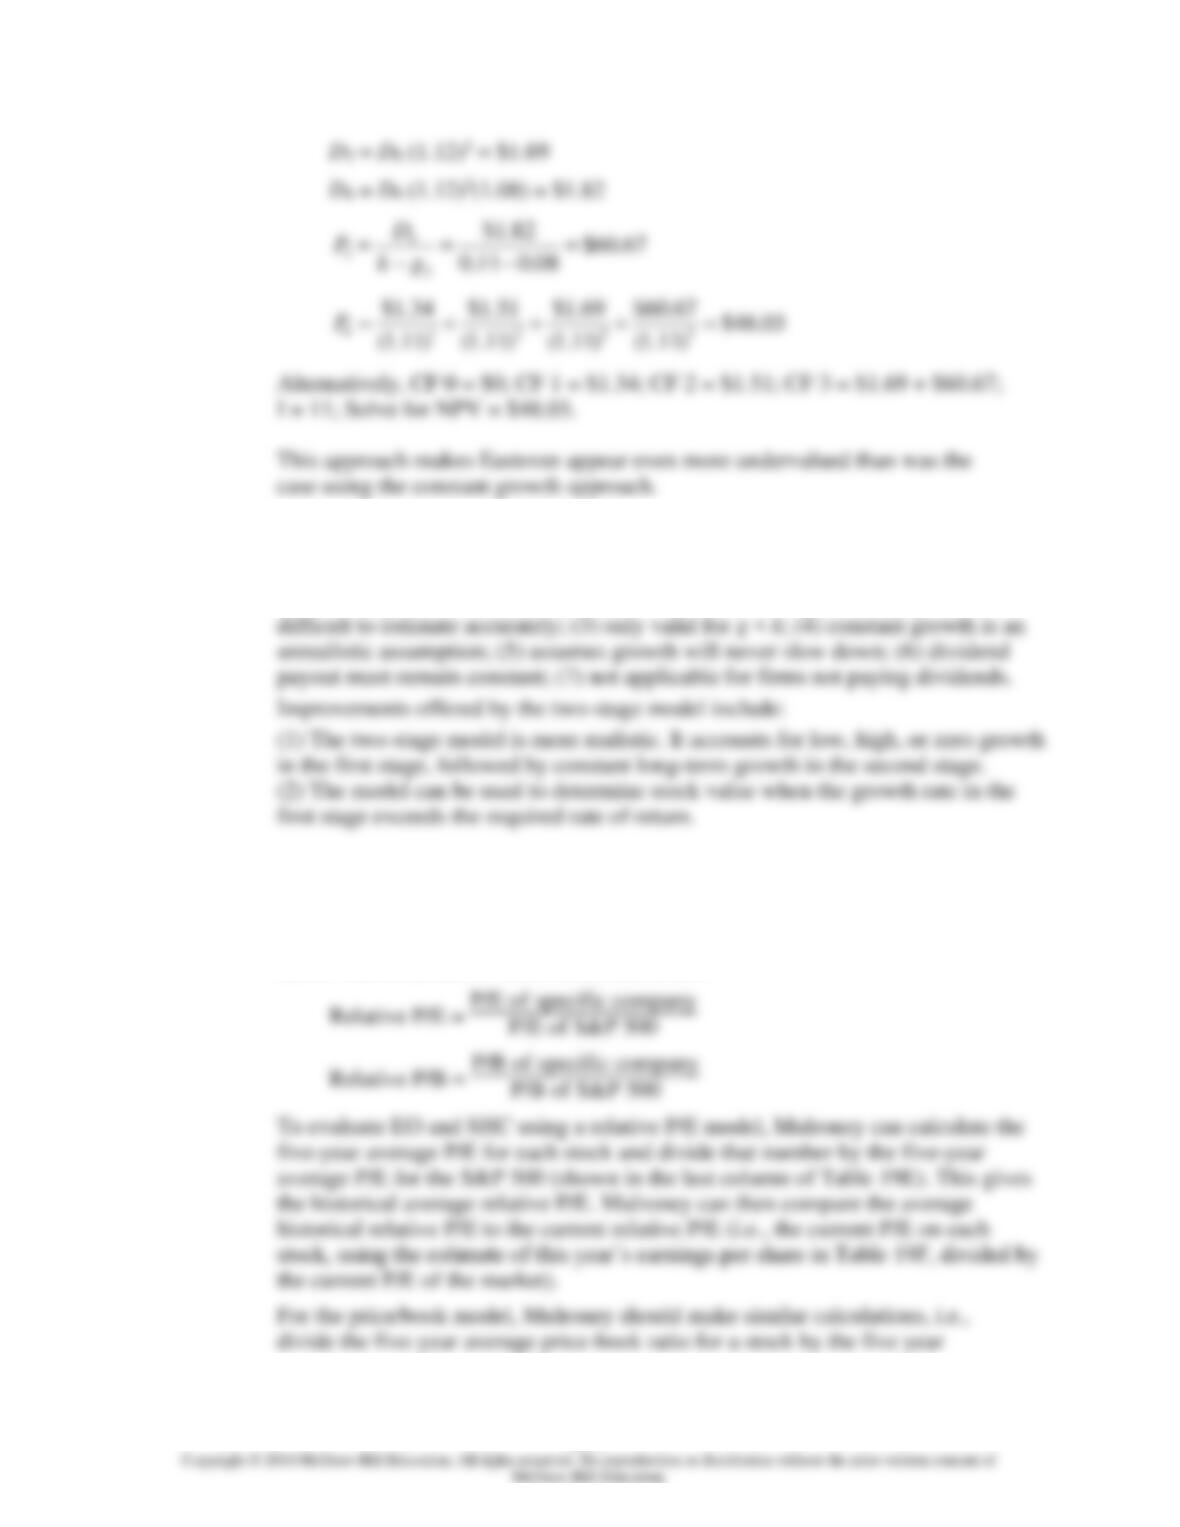
6. a. The formula for the constant growth discounted dividend model is
b. The formula for the two-stage discounted dividend model is
33
12
01 2 3 3
(1 ) (1 ) (1 ) (1 )
DP
DD
Pk k k k
= + + +
+ + + +
Chapter 19 – Financial Statement Analysis
19-7
c. Advantages of the constant growth model include: (1) logical, theoretical
basis; (2) simple to compute; (3) inputs can be estimated.
Disadvantages include: (1) very sensitive to estimates of growth; (2) g and k
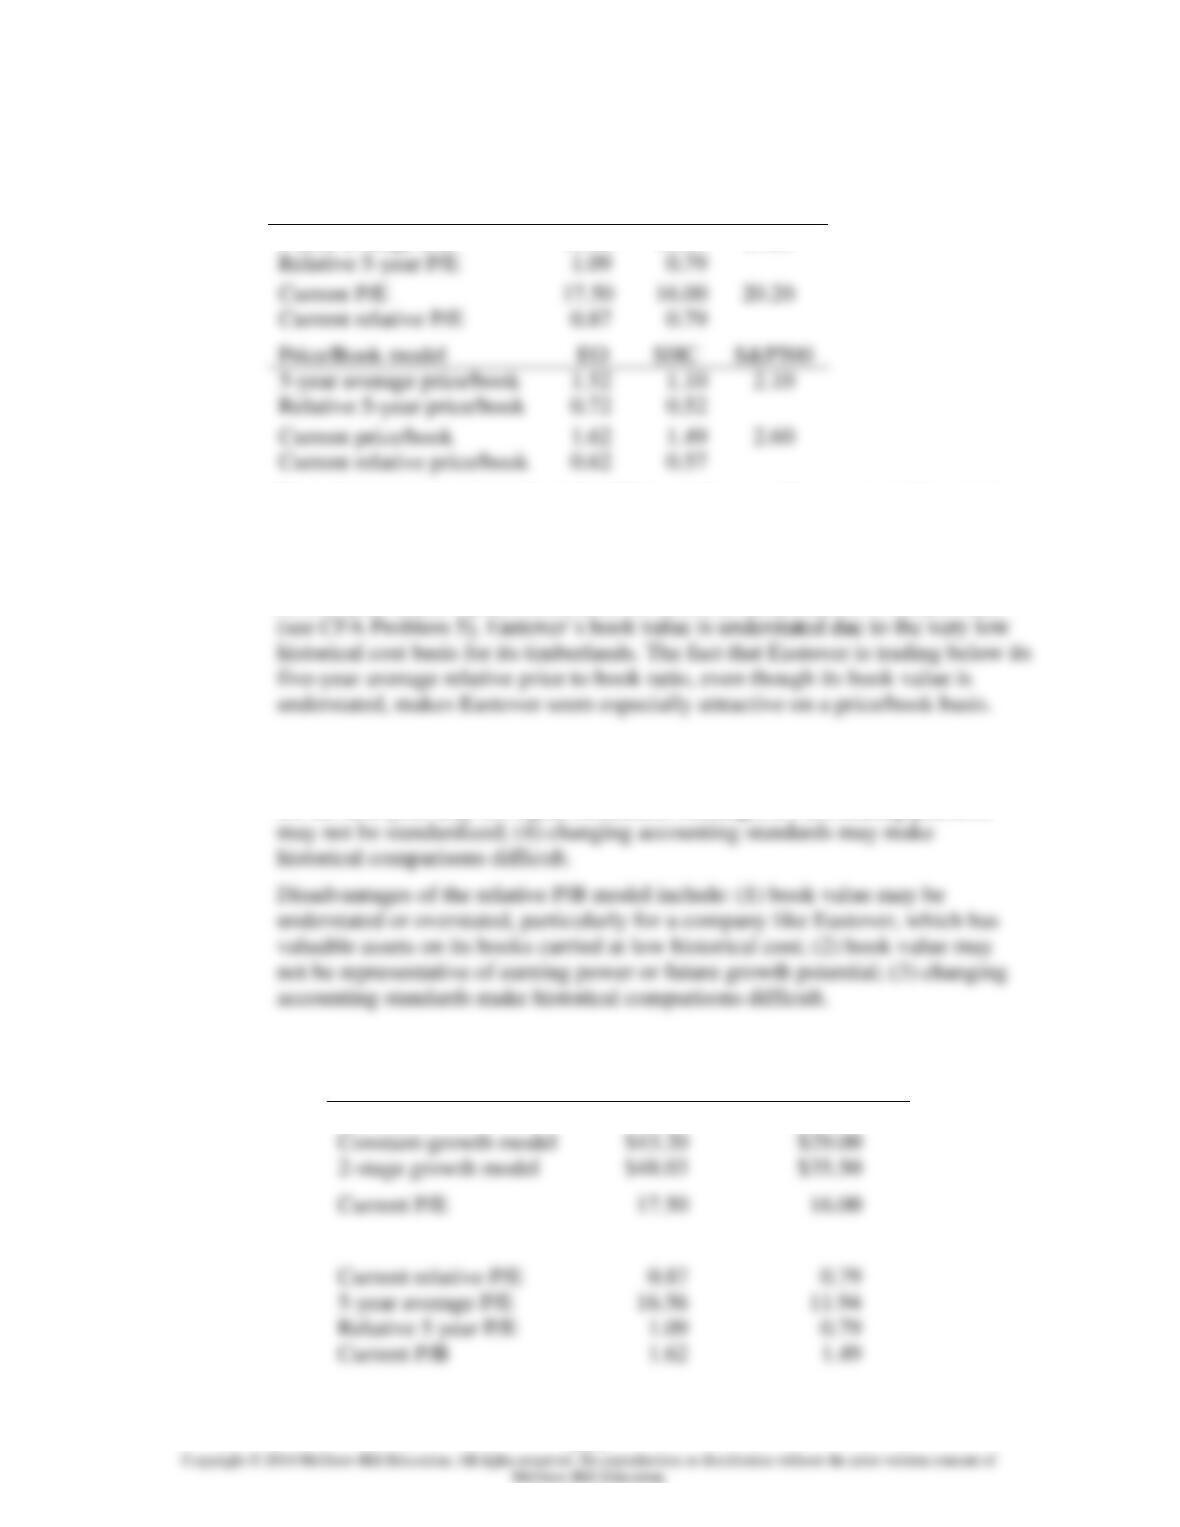
7. a. In order to determine whether a stock is undervalued or overvalued, analysts
often compute price-earnings ratios (P/Es) and price-book ratios (P/Bs); then,
these ratios are compared to benchmarks for the market, such as the S&P 500
index. The formulas for these calculations are:
Chapter 19 – Financial Statement Analysis
19-8
average price/book for the S&P 500, and compare the result to the current
relative price/book (using current book value). The results are as follows:
P/E model
EO
SHC
S&P500
5-year average P/E
16.56
11.94
15.20
Relative 5-year P/E
1.09
Current P/E
17.50
Current relative P/E
0.87
Price/Book model
EO
SHC
S&P500
5-year average price/book
Relative 5-year price/book
0.72
Current price/book
1.62
Current relative price/book
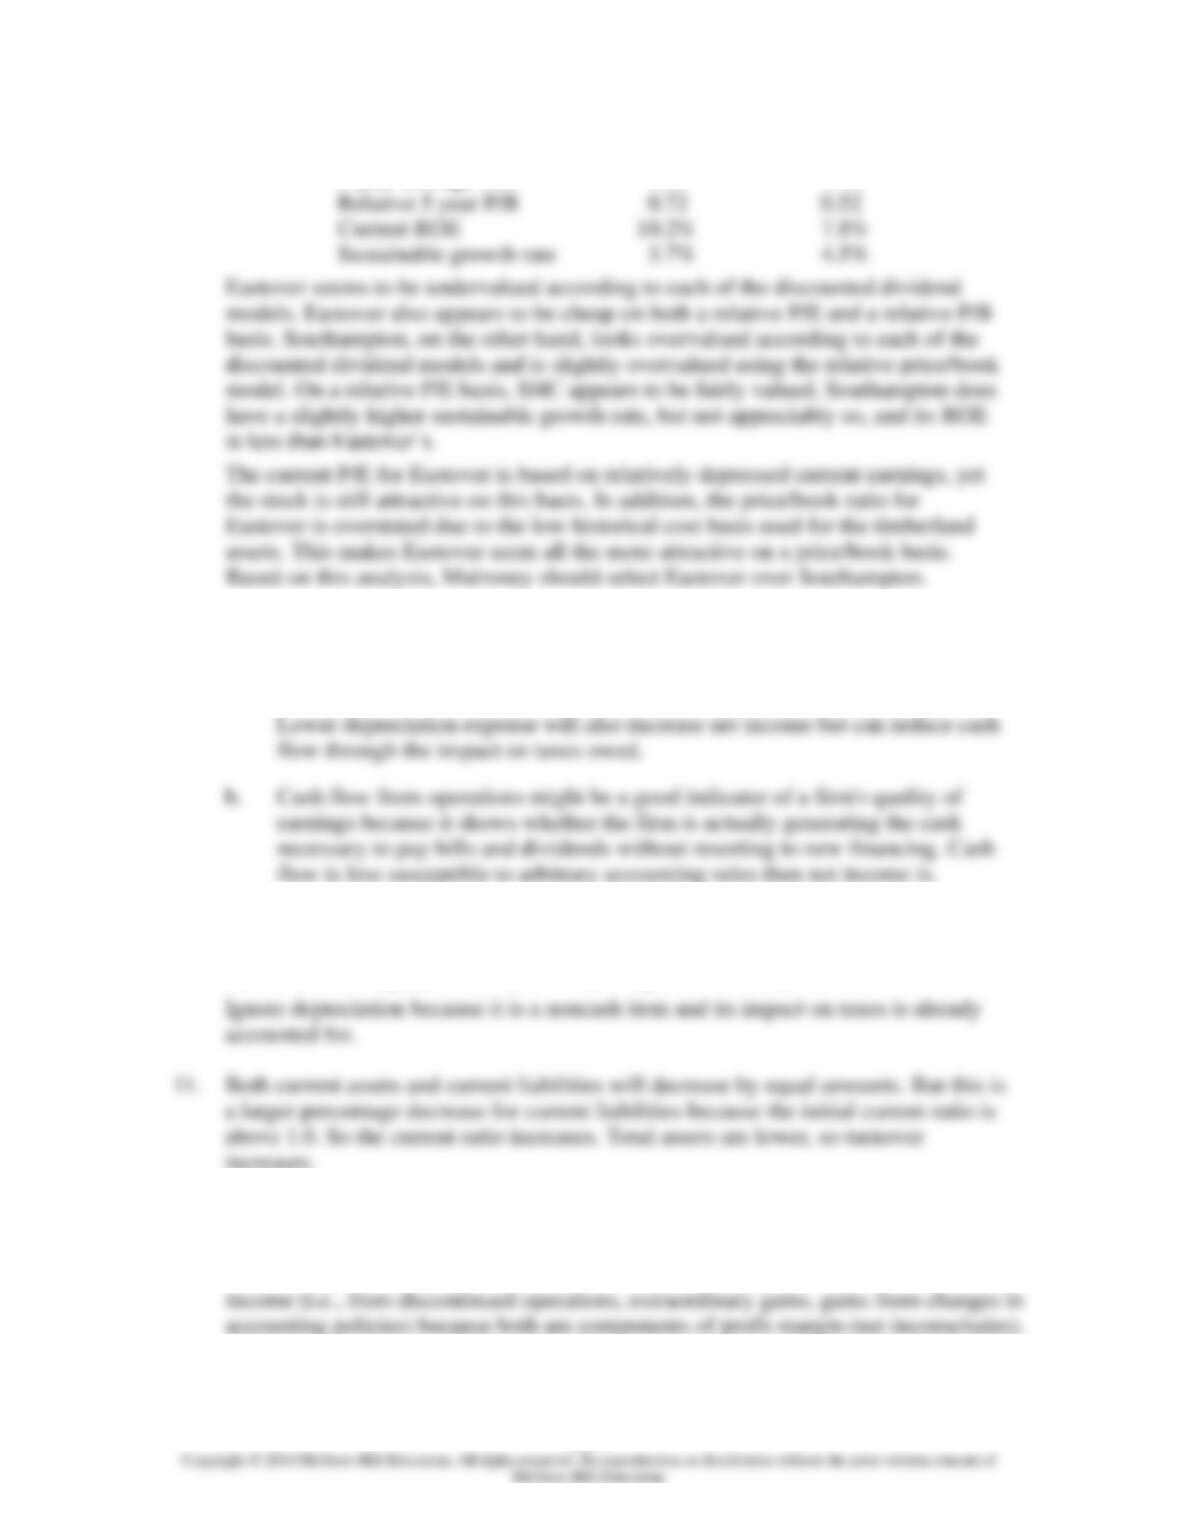
From this analysis, it is evident that EO is trading at a discount to its historical
five-year relative P/E ratio, whereas Southampton is trading right at its historical
five-year relative P/E. With respect to price/book, Eastover is trading at a discount
to its historical relative price/book ratio, whereas SHC is trading modestly above
its five-year relative price/book ratio. As noted in the preamble to the problem
b. Disadvantages of the relative P/E model include: (1) the relative P/E measures
only relative, rather than absolute, value; (2) the accounting earnings estimate
for the next year may not equal sustainable earnings; (3) accounting practices
8. The following table summarizes the valuation and ROE for Eastover and Southampton:
Eastover
Southampton
Stock price
$28.00
$48.00
Constant-growth model
$43.20
$29.00
2-stage growth model
$48.03
$35.50
Current P/E
Current relative P/E
5-year average P/E
Relative 5 year P/E
Current P/B
Chapter 19 – Financial Statement Analysis
19-9
Current relative P/B
0.62
0.57
5-year average P/B
1.52
1.10
Relative 5 year P/B
0.72
0.52
Current ROE
7.8%
Sustainable growth rate
3.7%
4.5%
9. a. Net income can increase even while cash flow from operations decreases. This
can occur if there is a buildup in net working capital—for example, increases
in accounts receivable or inventories, or reductions in accounts payable.
10. $1,200
Cash flow from operations = Sales – Cash expenses – Increase in A/R
increases.
12. Considering the components of after-tax ROE, there are several possible explanations
for a stable after-tax ROE despite declining operating income:
1. Declining operating income could have been offset by an increase in nonoperating
Chapter 19 – Financial Statement Analysis
19–10
2. Another offset to declining operating income could have been declining interest rates
on any interest rate obligations, which would have decreased interest expense while
allowing pretax margins to remain stable.
3. Leverage could have increased as a result of a decline in equity from: (a) writing
down an equity investment; (b) stock repurchases, (c) losses; or (d) selling new debt.
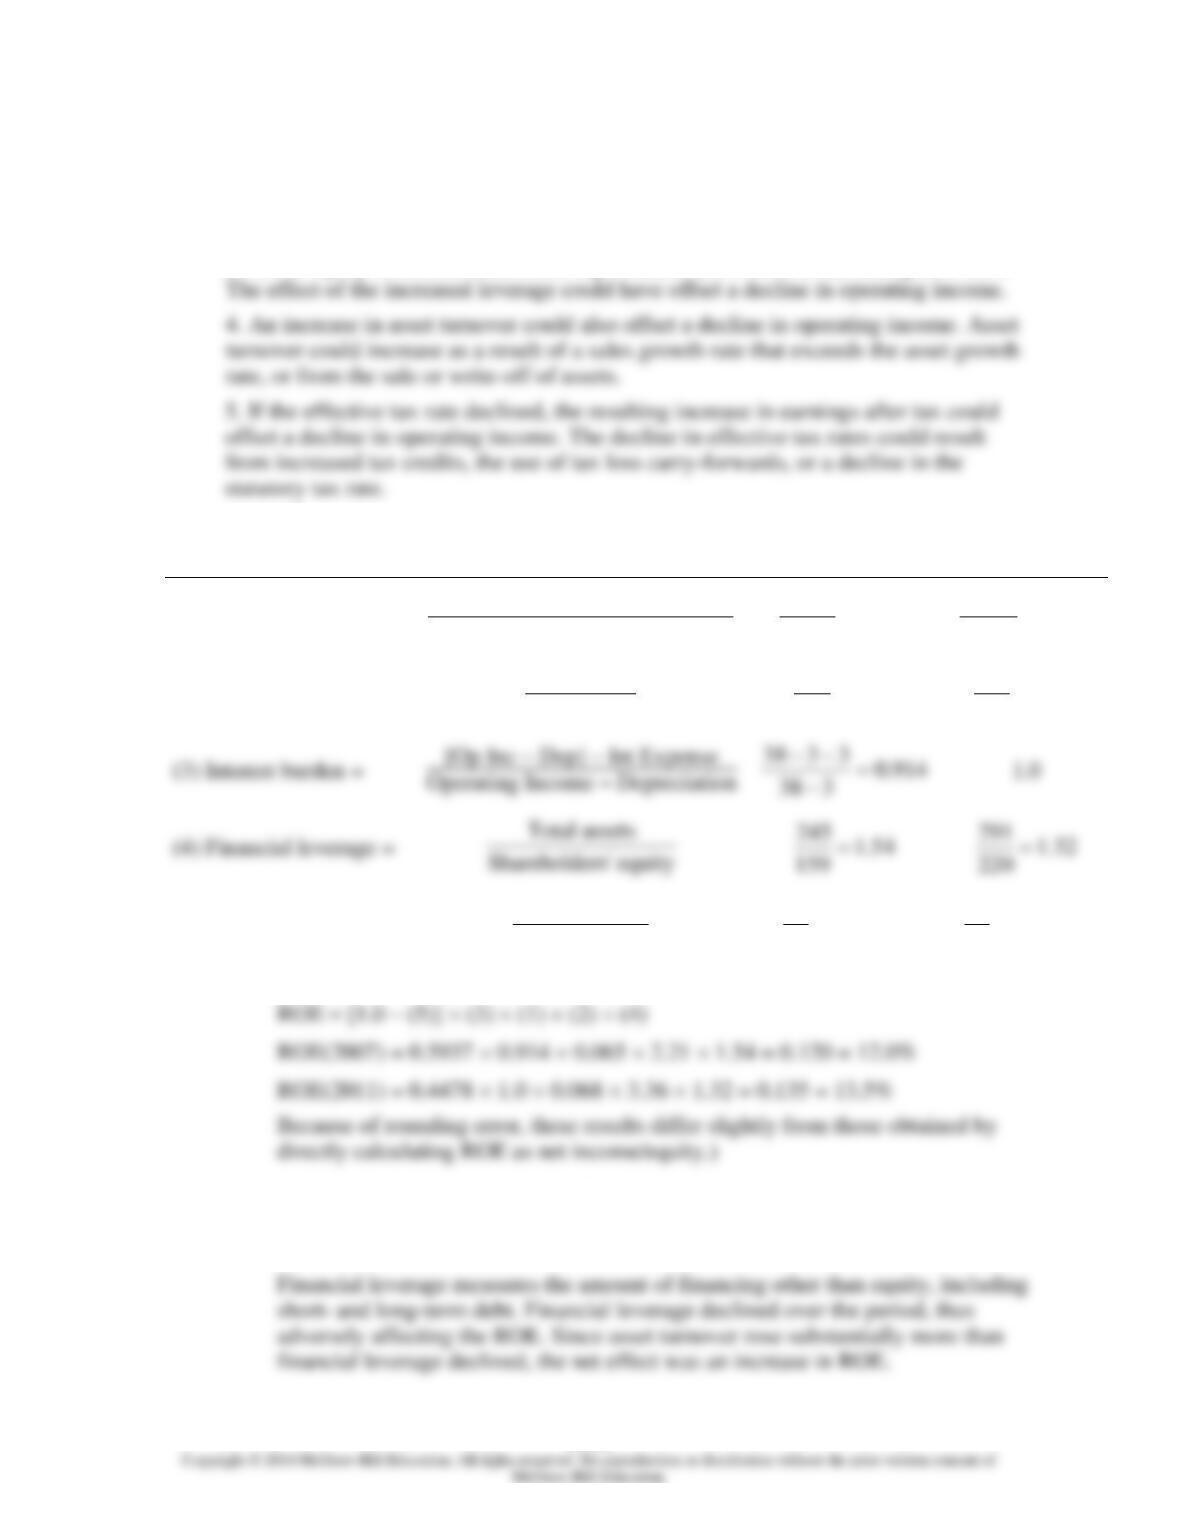
13. a.
2010
2014
(1) Operating margin =
Operating income – Depreciation
Sales
%5.6
542
338 =
−
%8.6
979
976 =
−
(2) Asset turnover =
Sales
Total assets
21.2
245
542 =
36.3
291
979 =
(5) Income tax rate =
Income taxes
Pretax income
%63.40
32
13 =
%22.55
67
37 =
Using the Du Pont formula:
b. Asset turnover measures the ability of a company to minimize the level of assets
(current or fixed) to support its level of sales. The asset turnover increased
substantially over the period, thus contributing to an increase in the ROE.