Chapter 19 – Financial Statement Analysis
19-1
CHAPTER 19: FINANCIAL STATEMENT ANALYSIS
PROBLEM SETS
1. The major difference in approach of international financial reporting standards and
U.S. GAAP accounting stems from the difference between ‘principles’ and ‘rules.’ U.S.
GAAP accounting is rules-based, with extensive detailed rules to be followed in the
2. Earnings management should not matter in a truly efficient market, where all publicly
available information is reflected in the price of a share of stock. Investors can see
3. Both credit rating agencies and stock market analysts are likely to be more or less
interested in all of the ratios discussed in this chapter (as well as many other ratios and
4. ROA = ROS ATO
5. ABC’s Asset turnover must be above the industry average.
Chapter 19 – Financial Statement Analysis
19-2
6. ROE = (1 – Tax rate) [ROA + (ROA – Interest rate)Debt/Equity]
CFA PROBLEMS
1. ROE = Net profits/Equity = Net profits/Sales Sales/Assets Assets/Equity
= Net profit margin Asset turnover Leverage ratio
2. SmileWhite has higher quality of earnings for the following reasons:
• SmileWhite amortizes its goodwill over a shorter period than does QuickBrush.
SmileWhite therefore presents more conservative earnings because it has greater
• SmileWhite depreciates its property, plant and equipment using an accelerated
depreciation method. This results in recognition of depreciation expense sooner
3. a.
Equity
Assets
Assets
Sales
Sales
profitsNet
Equity
profitsNet
ROE ==
= Net profit margin Total asset turnover Assets/equity
%92.90992.0
140,5
510
Sales
profitsNet ===
66.1
100,3
140,5
Assets
Sales ==
41.1
200,2
100,3
Equity
Assets ==
Chapter 19 – Financial Statement Analysis
19-3
200,2
100,3
100,3
140,5
140,5
510
60.096.1
−
4.
a.
Palomba Pizza Stores
Statement of Cash Flows
For the year ended December 31
Cash Flows from Operating Activities
Cash Collections from Customers
$250,000
Cash Payments to Suppliers
(85,000)
Cash Payments for Salaries
(45,000)
Cash Payments for Interest
(10,000)
Net Cash Provided by Operating Activities
$110,000
Cash Flows from Investing Activities
Sale of Equipment
38,000
Purchase of Equipment
(30,000)
Purchase of Land
(14,000)
Net Cash Used in Investing Activities
Cash Flows from Financing Activities
(6,000)
Retirement of Common Stock
(25,000)
Payment of Dividends
(35,000)
Net Cash Used in Financing Activities
(60,000)
Net Increase in Cash
44,000
Cash at Beginning of Year
50,000
Cash at End of Year
$94,000
b. Cash flow from operations (CFO) focuses on measuring the cash flow generated
by operations and not on measuring profitability. If used as a measure of
performance, CFO is less subject to distortion than the net income figure. Analysts
use CFO as a check on the quality of earnings. CFO then becomes a check on the
reported net earnings figure, but is not a substitute for net earnings. Companies
Chapter 19 – Financial Statement Analysis
19-4
Cash flow from investing activities (CFI) is an indication of how the firm is
investing its excess cash. The analyst must consider the ability of the firm to
continue to grow and to expand activities, and CFI is a good indication of the
attitude of management in this area. Analysis of this component of total cash flow
5. a. CF from operating activities = $260 – $85 – $12 – $35 = $128
6. a. QuickBrush has had higher sales and earnings growth (per share) than SmileWhite.
Margins are also higher. But this does not mean that QuickBrush is necessarily a
better investment. SmileWhite has a higher ROE, which has been stable, while
QuickBrush’s ROE has been declining. We can see the source of the difference in
ROE using DuPont analysis:
Component
Definition
QuickBrush
SmileWhite
Tax burden (1 – t)
Net profits/pretax profits
67.4%
66.0%
Interest burden
Pretax profits/EBIT
1.000
0.955
Profit margin
EBIT/Sales
8.5%
6.5%
Asset turnover
Sales/Assets
1.42
3.55
Leverage
Assets/Equity
1.47
1.48
ROE
Net profits/Equity
12.0%
21.4%
While tax burden, interest burden, and leverage are similar, profit margin and asset
turnover differ. Although SmileWhite has a lower profit margin, it has a far higher
asset turnover.
Chapter 19 – Financial Statement Analysis
19-5
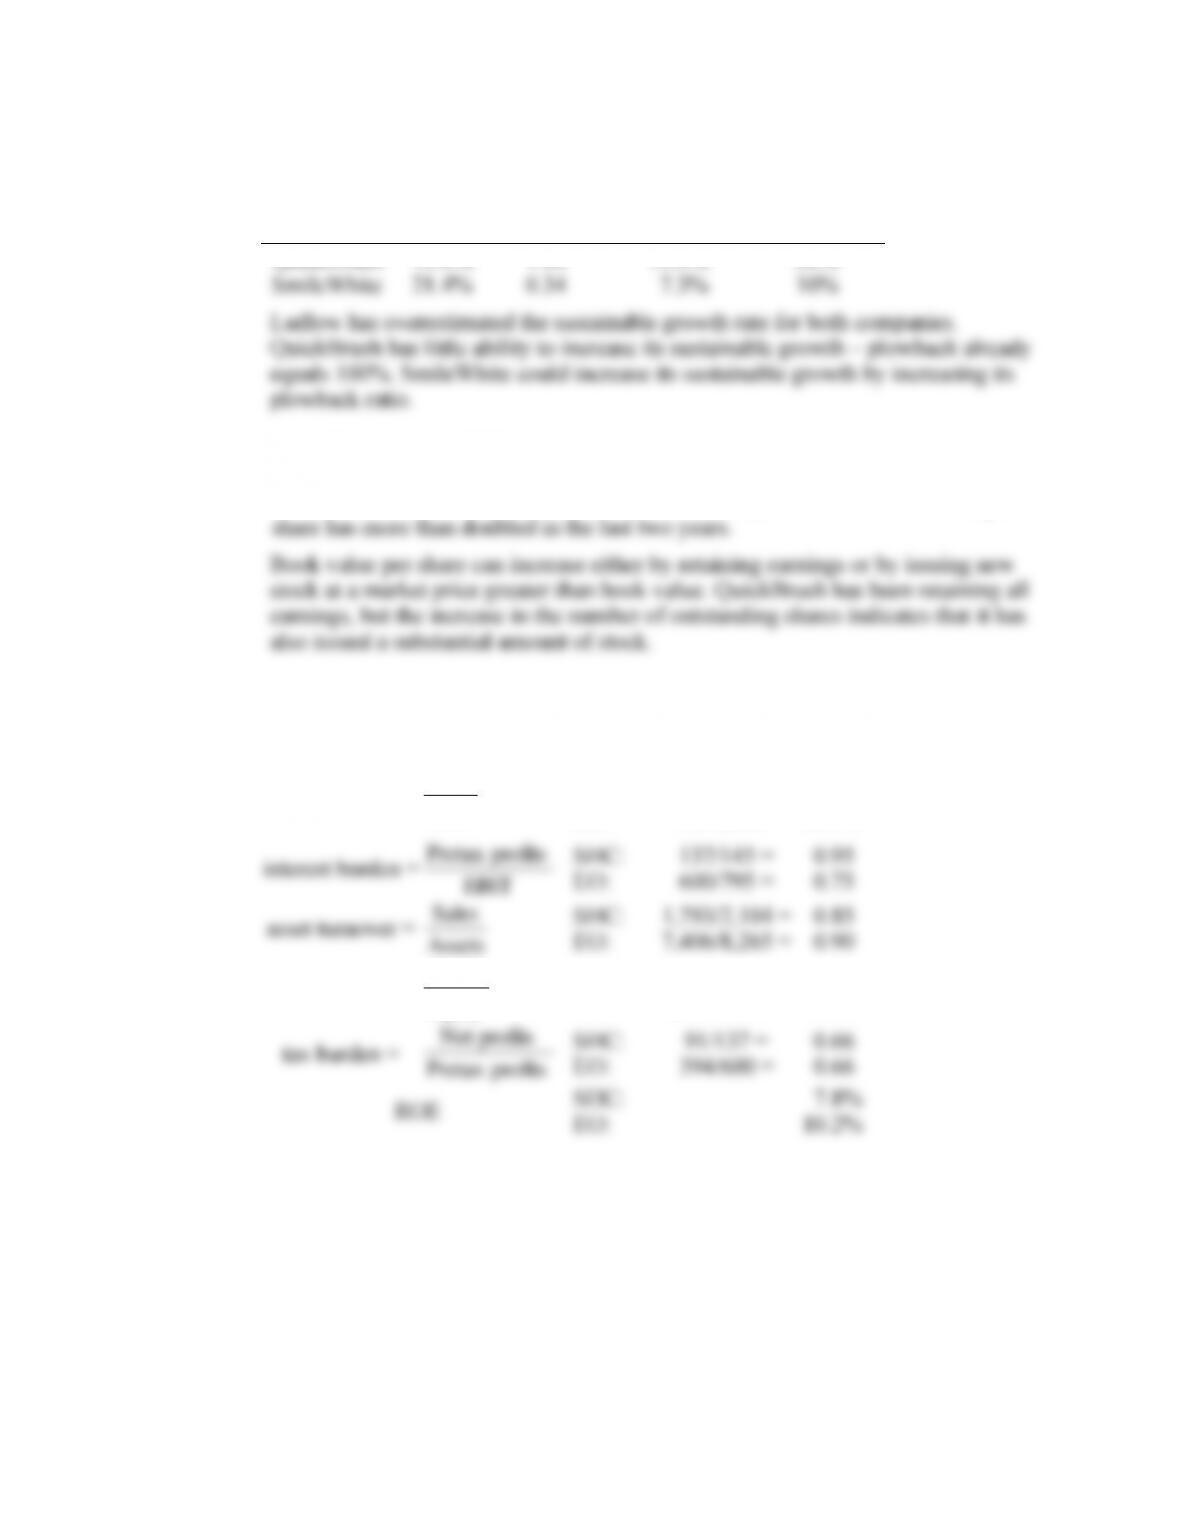
Sustainable growth = ROE plowback ratio
ROE
Plowback
ratio
Sustainable
growth rate
Ludlow’s
estimate of
growth rate
QuickBrush
12.0%
1.00
12.0%
30%
SmileWhite
21.4%
0.34
7.3%
10%
b. QuickBrush’s recent EPS growth has been achieved by increasing book value per
share, not by achieving greater profits per dollar of equity. A firm can increase EPS
even if ROE is declining as is true of QuickBrush. QuickBrush’s book value per
7. a. ROE = operating margin interest burden asset turnover leverage tax burden
ROE for Eastover (EO) and for Southampton (SHC) in 2007 are found as follows:
profit margin =
Sales
EBIT
SHC:
EO:
145/1,793 =
795/7,406 =
8.1%
10.7%
interest burden =
EBIT
profitsPretax
SHC:
EO:
137/145 =
600/795 =
0.95
0.75
asset turnover =
Assets
Sales
SHC:
EO:
1,793/2,104 =
7,406/8,265 =
0.85
0.90
leverage =
Equity
Assets
SHC:
EO:
2,140/1,167 =
8,265/3,864 =
1.80
2.14
tax burden =
profitsPretax
profitsNet
SHC:
EO:
91/137 =
394/600 =
0.66
0.66
ROE
SHC:
EO:
7.8%
10.2%
Chapter 19 – Financial Statement Analysis
19-6
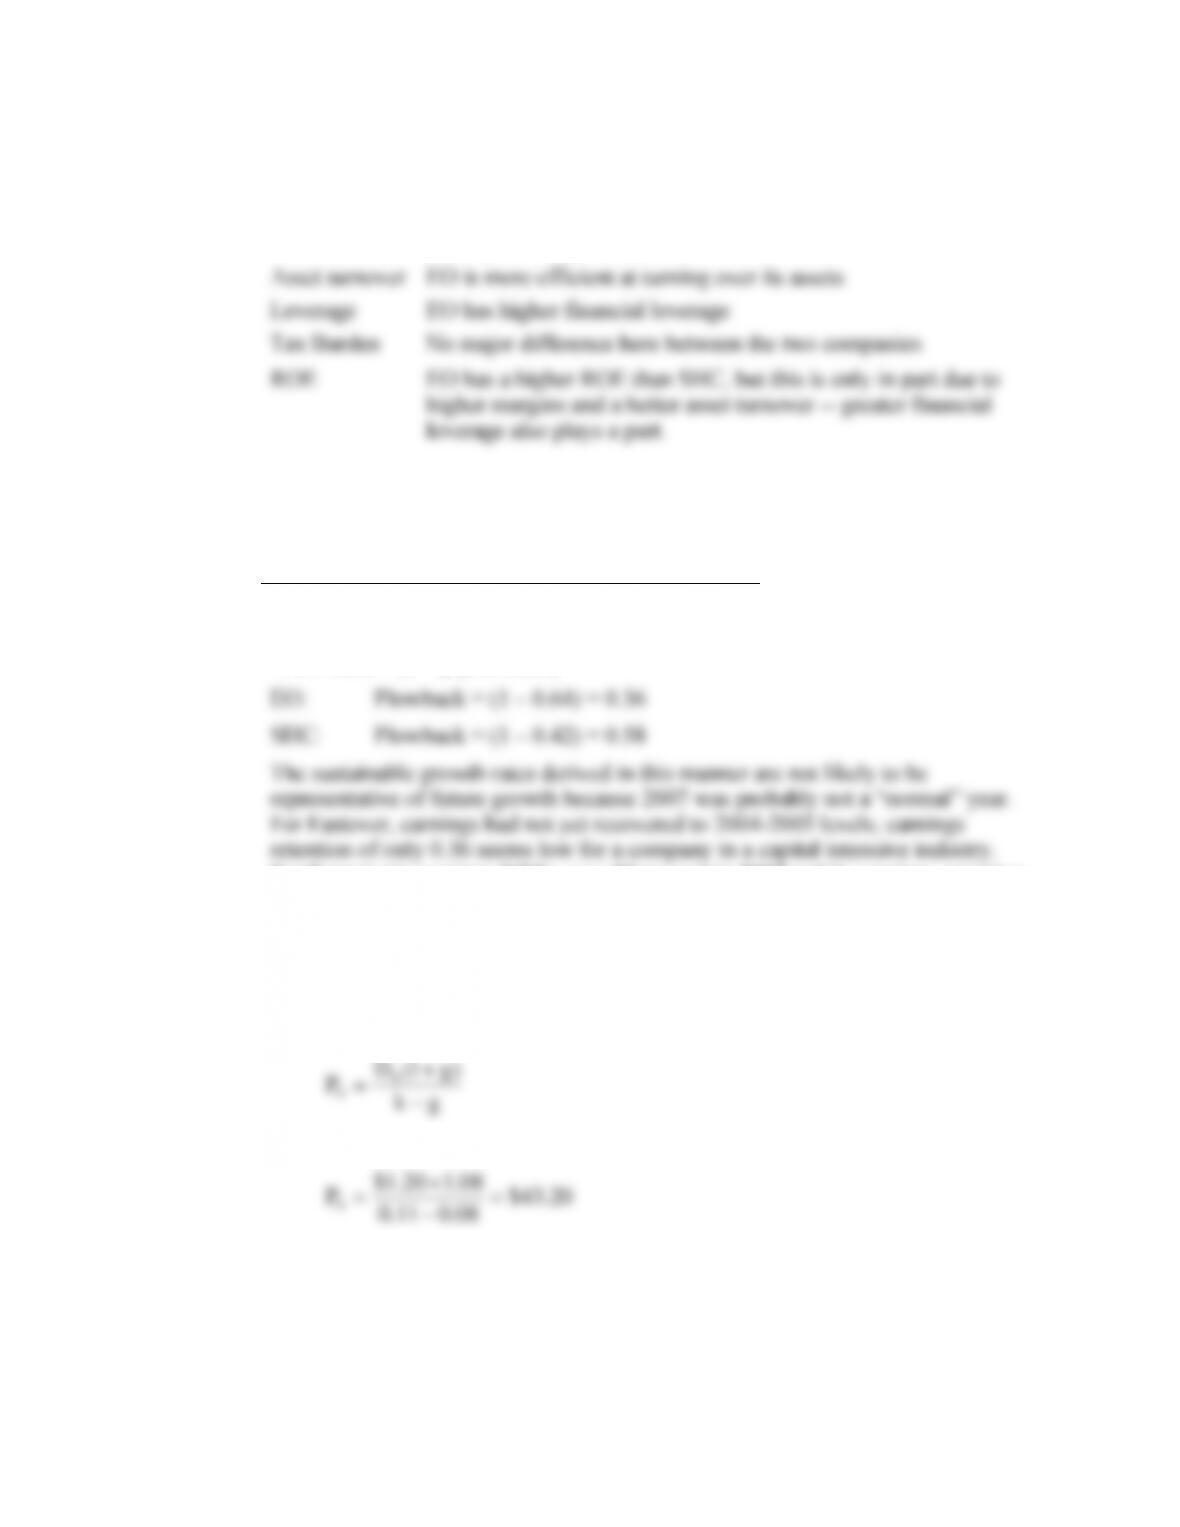
b. The differences in the components of ROE for Eastover and Southampton are:
Profit margin EO has a higher margin
Interest burden EO has a higher interest burden because its pretax profits are a
lower percentage of EBIT
c. The sustainable growth rate can be calculated as: ROE times plowback ratio. The
sustainable growth rates for Eastover and Southampton are as follows:
ROE
Plowback
ratio*
Sustainable
growth rate
Eastover
10.2%
0.36
3.7%
Southampton
7.8%
0.58
4.5%
*Plowback = (1 – payout ratio)
Southampton’s earnings fell by over 50 percent in 2007 and its earnings retention
will probably be higher than 0.58 in the future. There is a danger, therefore, in
basing a projection on one year’s results, especially for companies in a cyclical
industry such as forest products.
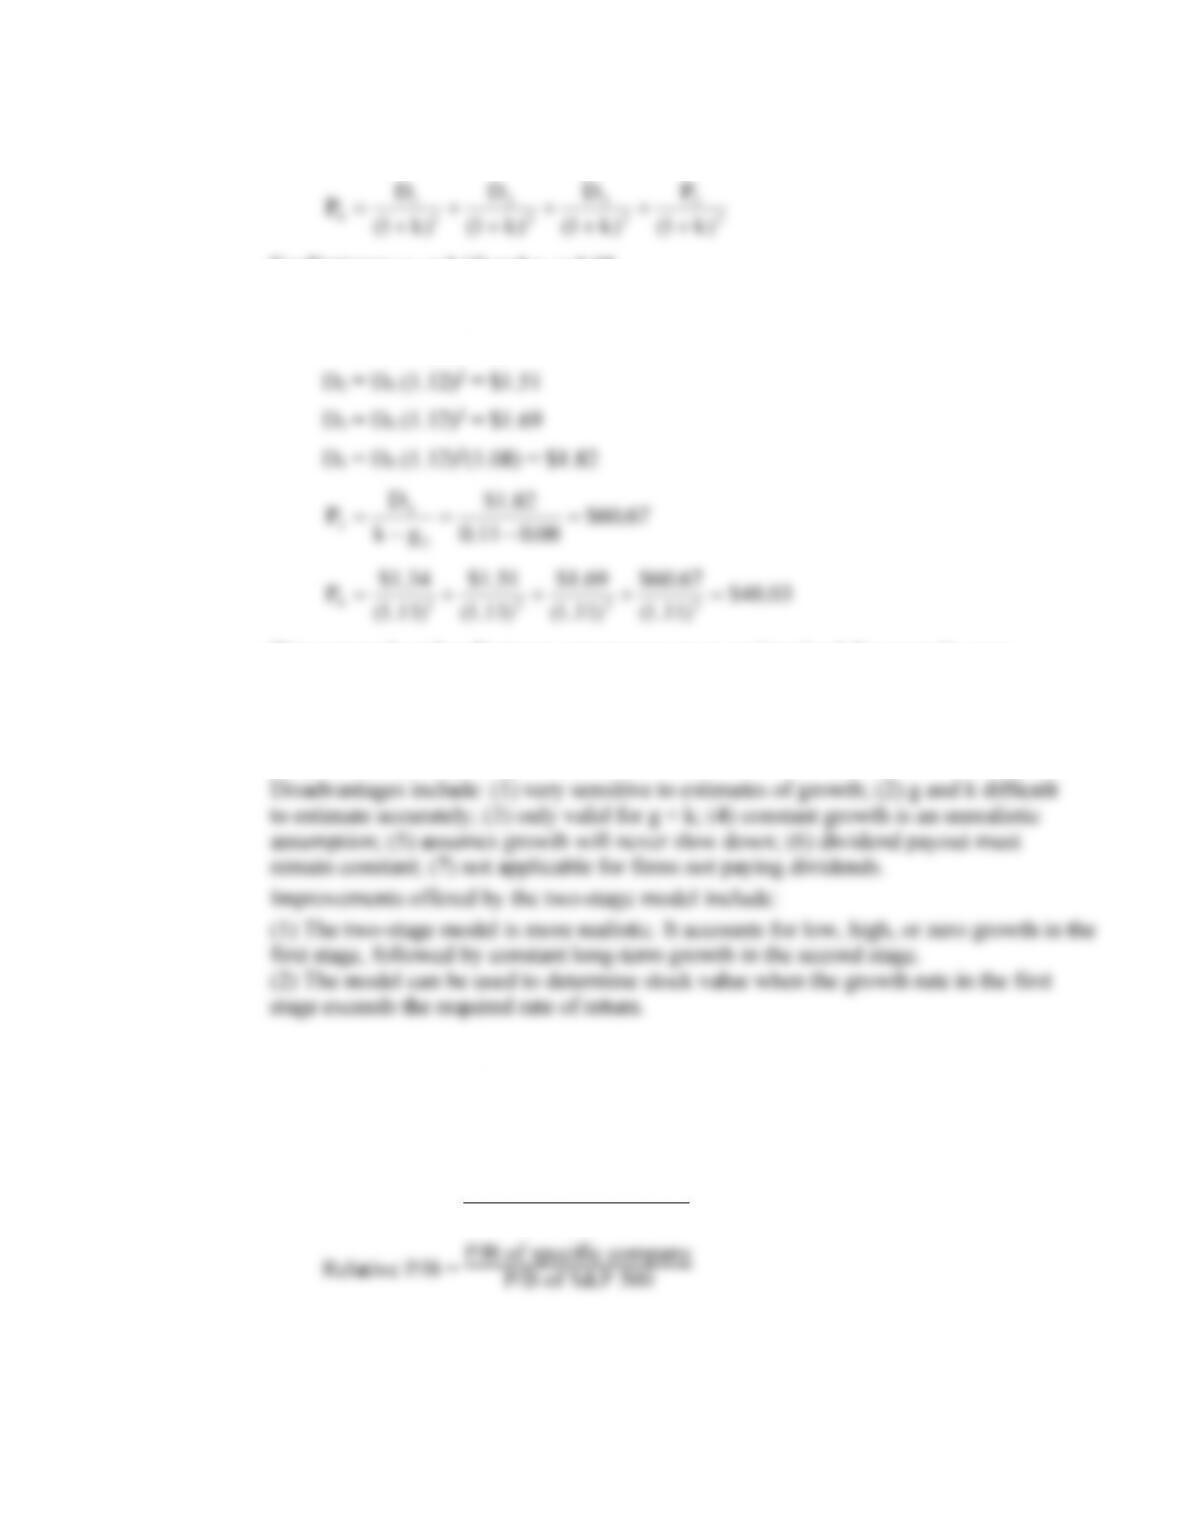
8. a. The formula for the constant growth discounted dividend model is:
gk
)g1(D
P0
0−
+
=
For Eastover:
20.43$
08.011.0
08.120.1$
P0=
−
=
This compares with the current stock price of $28. On this basis, it appears that
Eastover is undervalued.
Chapter 19 – Financial Statement Analysis
19-7
b. The formula for the two-stage discounted dividend model is:
3
3
3
3
2
2
1
1
0)k1(
P
)k1(
D
)k1(
D
)k1(
D
P+
+
+
+
+
+
+
=
For Eastover: g1 = 0.12 and g2 = 0.08
D0 = 1.20
D1 = D0 (1.12)1 = $1.34
)11.1(
)11.1(
)11.1(
)11.1(
0=+++=
This approach makes Eastover appear even more undervalued than was the case
using the constant growth approach.
c. Advantages of the constant growth model include: (1) logical, theoretical basis; (2)
simple to compute; (3) inputs can be estimated.
9. a. In order to determine whether a stock is undervalued or overvalued, analysts often
compute price-earnings ratios (P/Es) and price-book ratios (P/Bs); then, these
ratios are compared to benchmarks for the market, such as the S&P 500 index. The
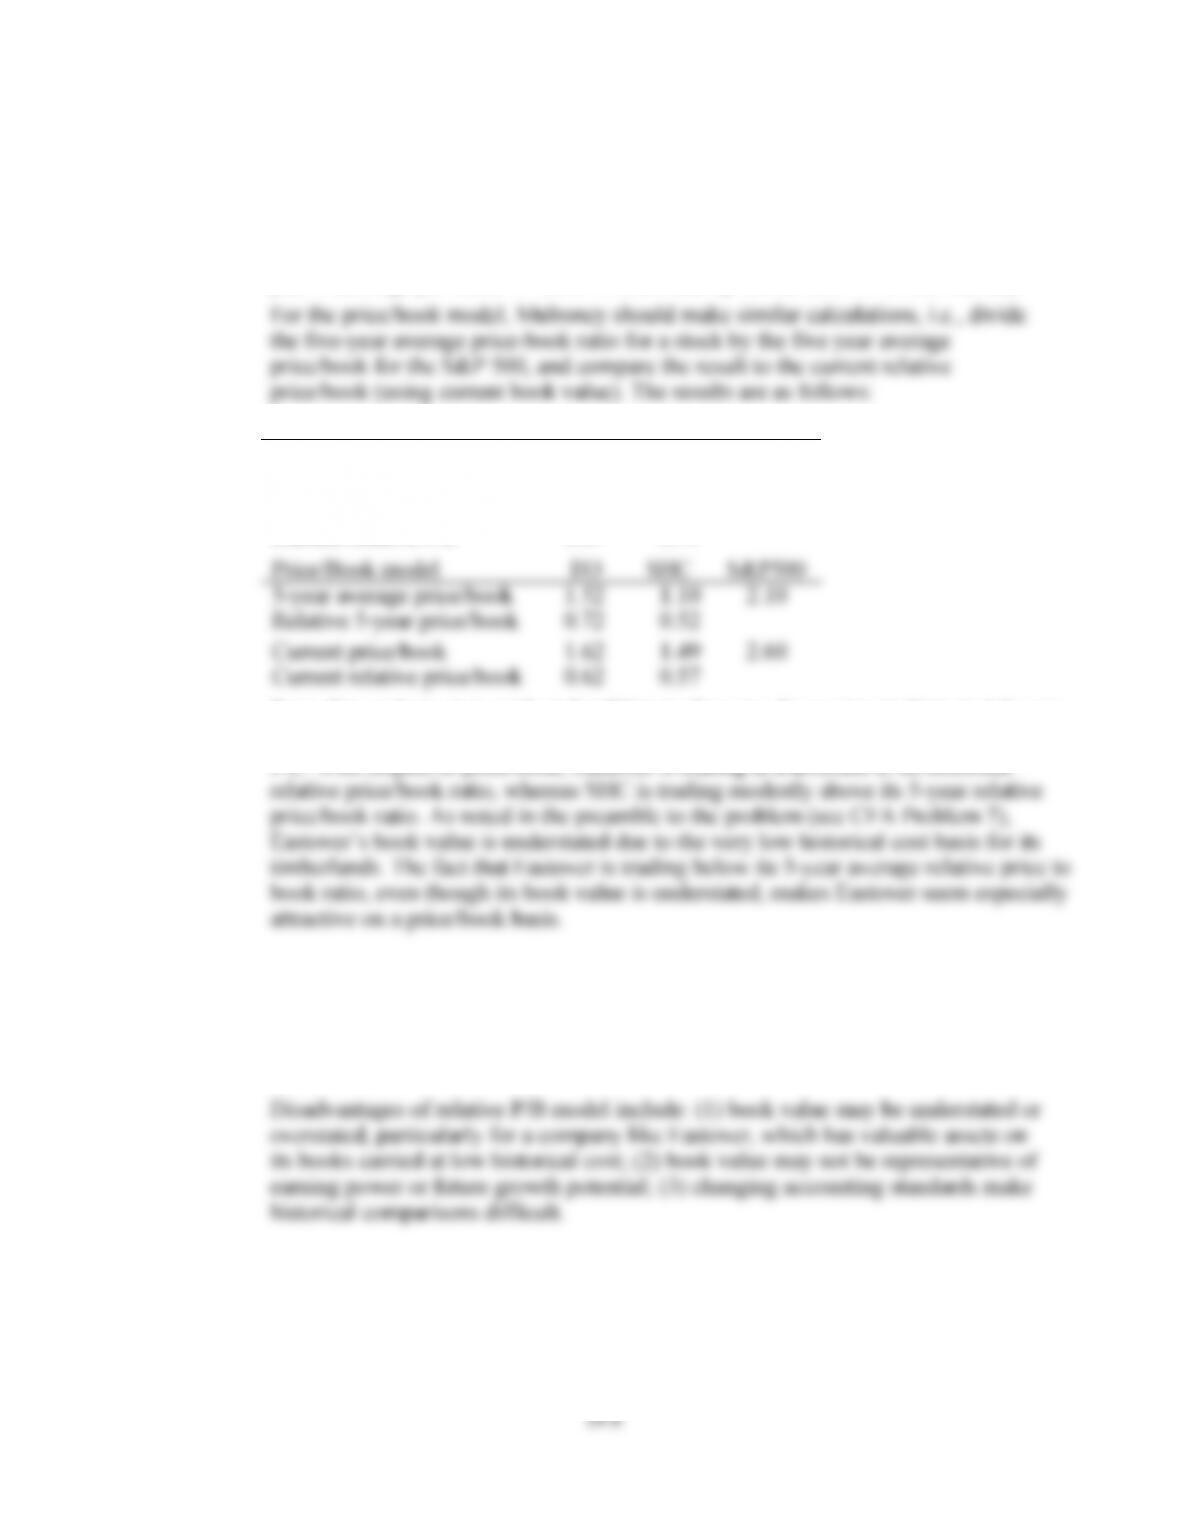
formulas for these calculations are:
Relative P/E = P/E of specific company
P/E of S&P 500
Chapter 19 – Financial Statement Analysis
To evaluate EO and SHC using a relative P/E model, Mulroney can calculate the five-
year average P/E for each stock, and divide that number by the 5-year average P/E for
the S&P 500 (shown in the last column of Table 19E). This gives the historical
average relative P/E. Mulroney can then compare the average historical relative P/E to
the current relative P/E (i.e., the current P/E on each stock, using the estimate of this
year’s earnings per share in Table 19F, divided by the current P/E of the market).
P/E model
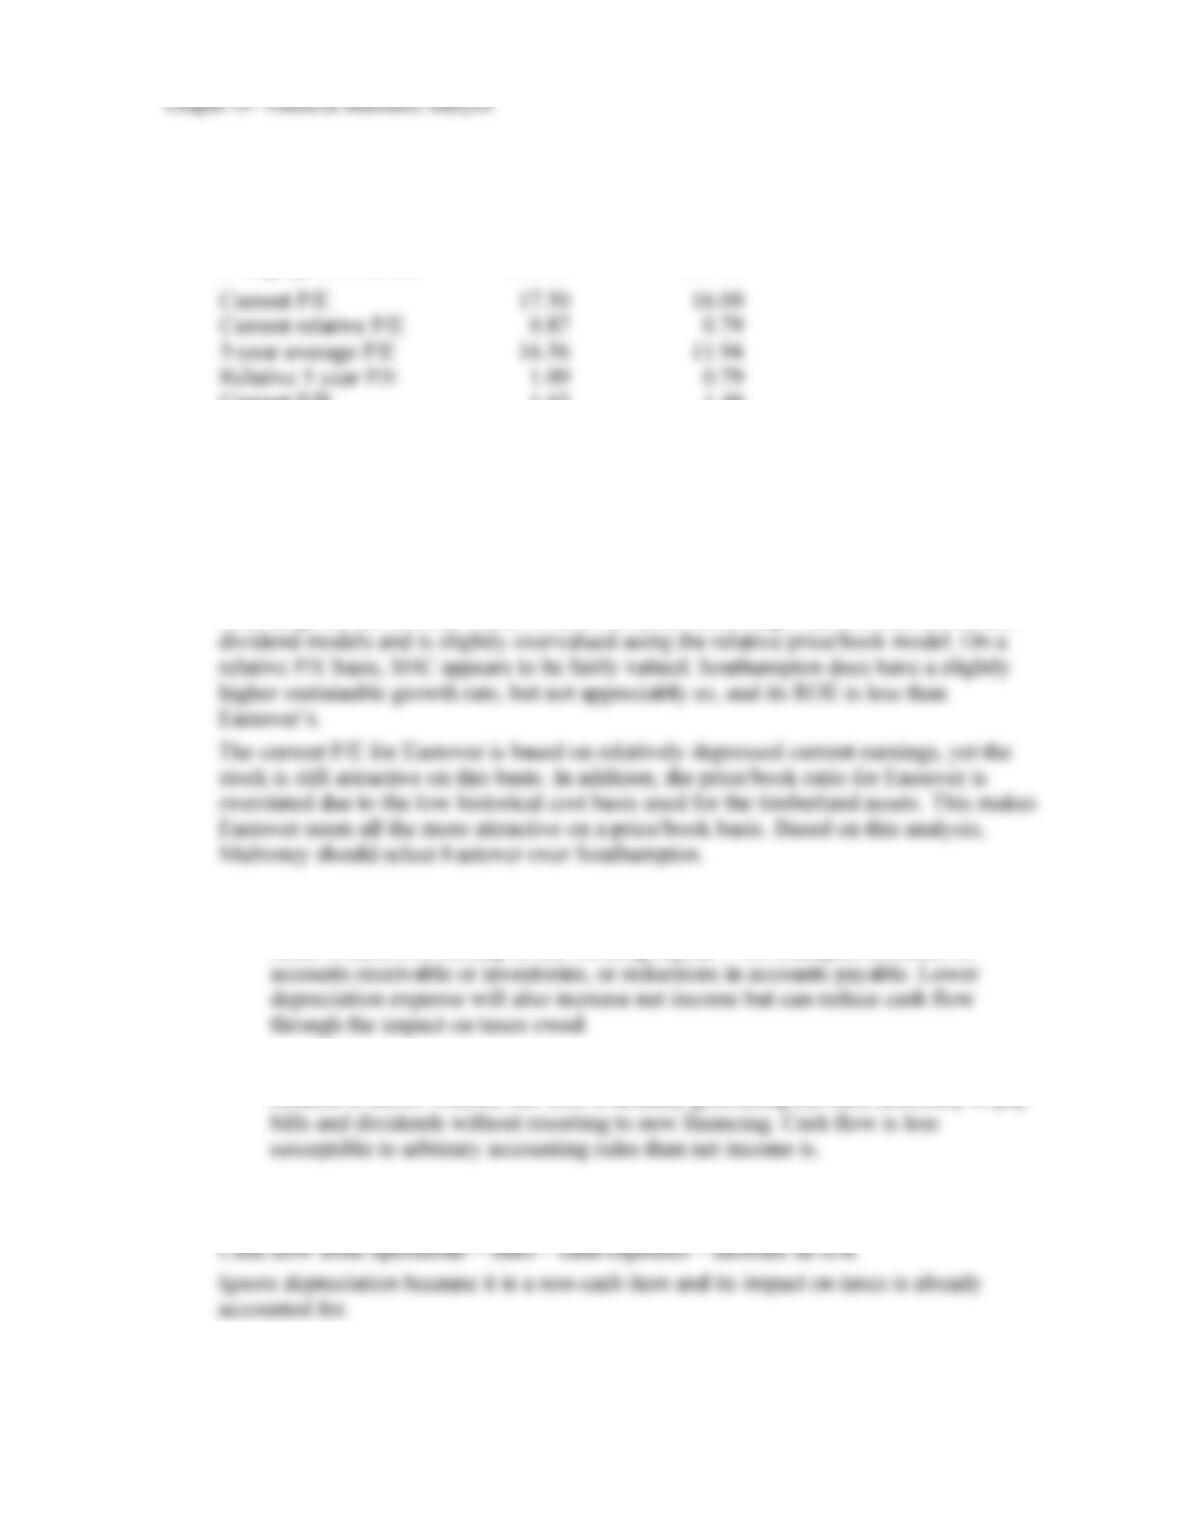
EO
SHC
S&P500
5-year average P/E
16.56
11.94
15.20
Relative 5-year P/E
1.09
0.79
Current P/E
17.50
16.00
20.20
Current relative P/E
0.87
0.79
Price/Book model
EO
SHC
S&P500
5-year average price/book
1.52
1.10
2.10
Relative 5-year price/book
0.72
0.52
Current price/book
1.62
1.49
2.60
Current relative price/book
0.62
0.57
From this analysis, it is evident that EO is trading at a discount to its historical 5-year
relative P/E ratio, whereas Southampton is trading right at its historical 5-year relative
P/E. With respect to price/book, Eastover is trading at a discount to its historical
b. Disadvantages of the relative P/E model include: (1) the relative P/E measures
only relative, rather than absolute, value; (2) the accounting earnings estimate for
the next year may not equal sustainable earnings; (3) accounting practices may not
be standardized; (4) changing accounting standards may make historical
comparisons difficult.
19-9
10. The following table summarizes the valuation and ROE for Eastover and Southampton:
Eastover
Southampton
Stock Price
$28.00
$48.00
Constant-growth model
$43.20
$29.00
2-stage growth model
$48.03
$35.50
Current P/E
17.50
16.00
Current relative P/E
0.87
0.79
5-year average P/E
16.56
11.94
Relative 5 year P/E
1.09
0.79
Current P/B
1.62
1.49
Current relative P/B
0.62
0.57
5-year average P/B
1.52
1.10
Relative 5 year P/B
0.72
0.52
Current ROE
10.2%
7.8%
Sustainable growth rate
3.7%
4.5%
Eastover seems to be undervalued according to each of the discounted dividend models.
Eastover also appears to be cheap on both a relative P/E and a relative P/B basis.
Southampton, on the other hand, looks overvalued according to each of the discounted
11. a. Net income can increase even while cash flow from operations decreases. This can
occur if there is a buildup in net working capital — for example, increases in
b. Cash flow from operations might be a good indicator of a firm’s quality of earnings
because it shows whether the firm is actually generating the cash necessary to pay
12. $1,200
Chapter 19 – Financial Statement Analysis
19–10
13. a Both current assets and current liabilities will decrease by equal amounts. But this
1. Declining operating income could have been offset by an increase in non-operating income
2. Another offset to declining operating income could have been declining interest rates on
3. Leverage could have increased as a result of a decline in equity from: (a) writing down an
4. An increase in asset turnover could also offset a decline in operating income. Asset
5. If the effective tax rate declined, the resulting increase in earnings after tax could
Chapter 19 – Financial Statement Analysis
19–11
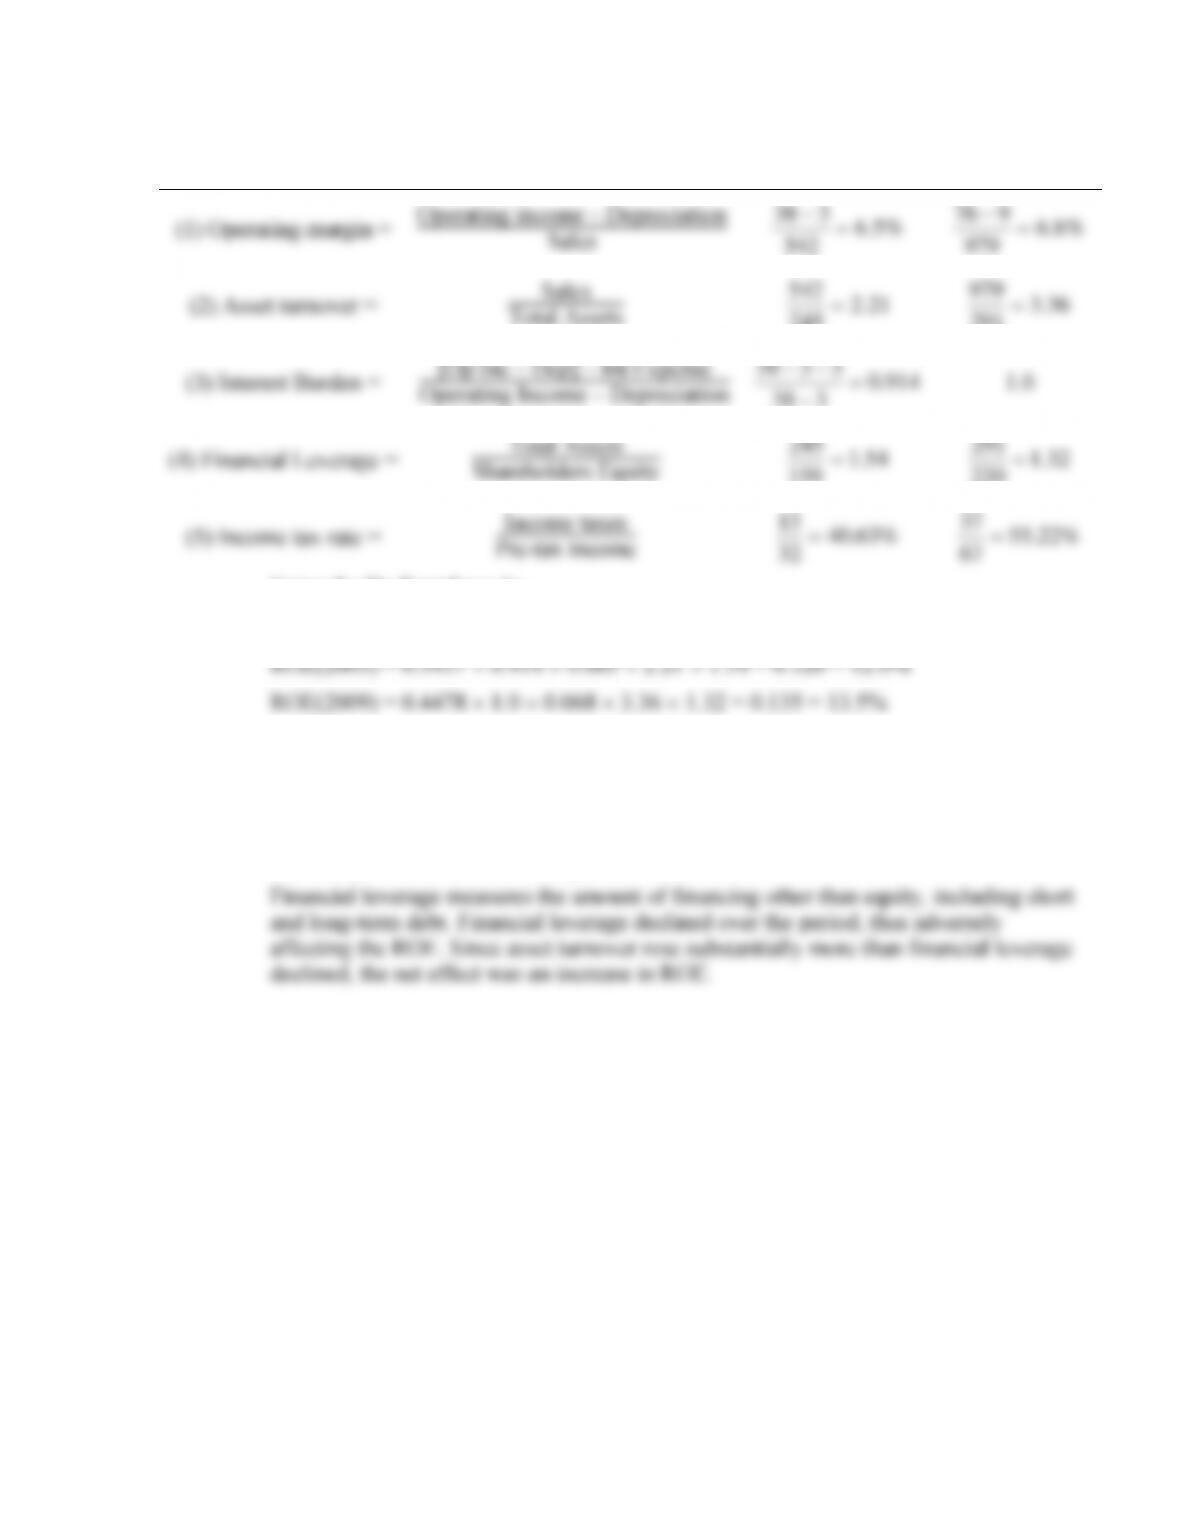
17. a.
2005
2009
(1) Operating margin =
Operating income – Depreciation
Sales
%5.6
542
338 =
−
%8.6
979
976 =
−
(2) Asset turnover =
Sales
Total Assets
21.2
245
542 =
36.3
291
979 =
(3) Interest Burden =
[Op Inc – Dep] – Int Expense
Operating Income – Depreciation
914.0
338
3338 =
−
−−
1.0
(4) Financial Leverage =
Total Assets
Shareholders Equity
54.1
159
245 =
32.1
220
291 =
(5) Income tax rate =
Income taxes
Pre-tax income
%63.40
32
13 =
%22.55
67
37 =
Using the Du Pont formula:
ROE = [1.0 – (5)] (3) (1) (2) (4)
(Because of rounding error, these results differ slightly from those obtained by
directly calculating ROE as net income/equity.)
b. Asset turnover measures the ability of a company to minimize the level of assets
(current or fixed) to support its level of sales. The asset turnover increased substantially
over the period, thus contributing to an increase in the ROE.