Chapter 18 – Equity Valuation Models
CHAPTER 18: EQUITY VALUATION MODELS
PROBLEM SETS
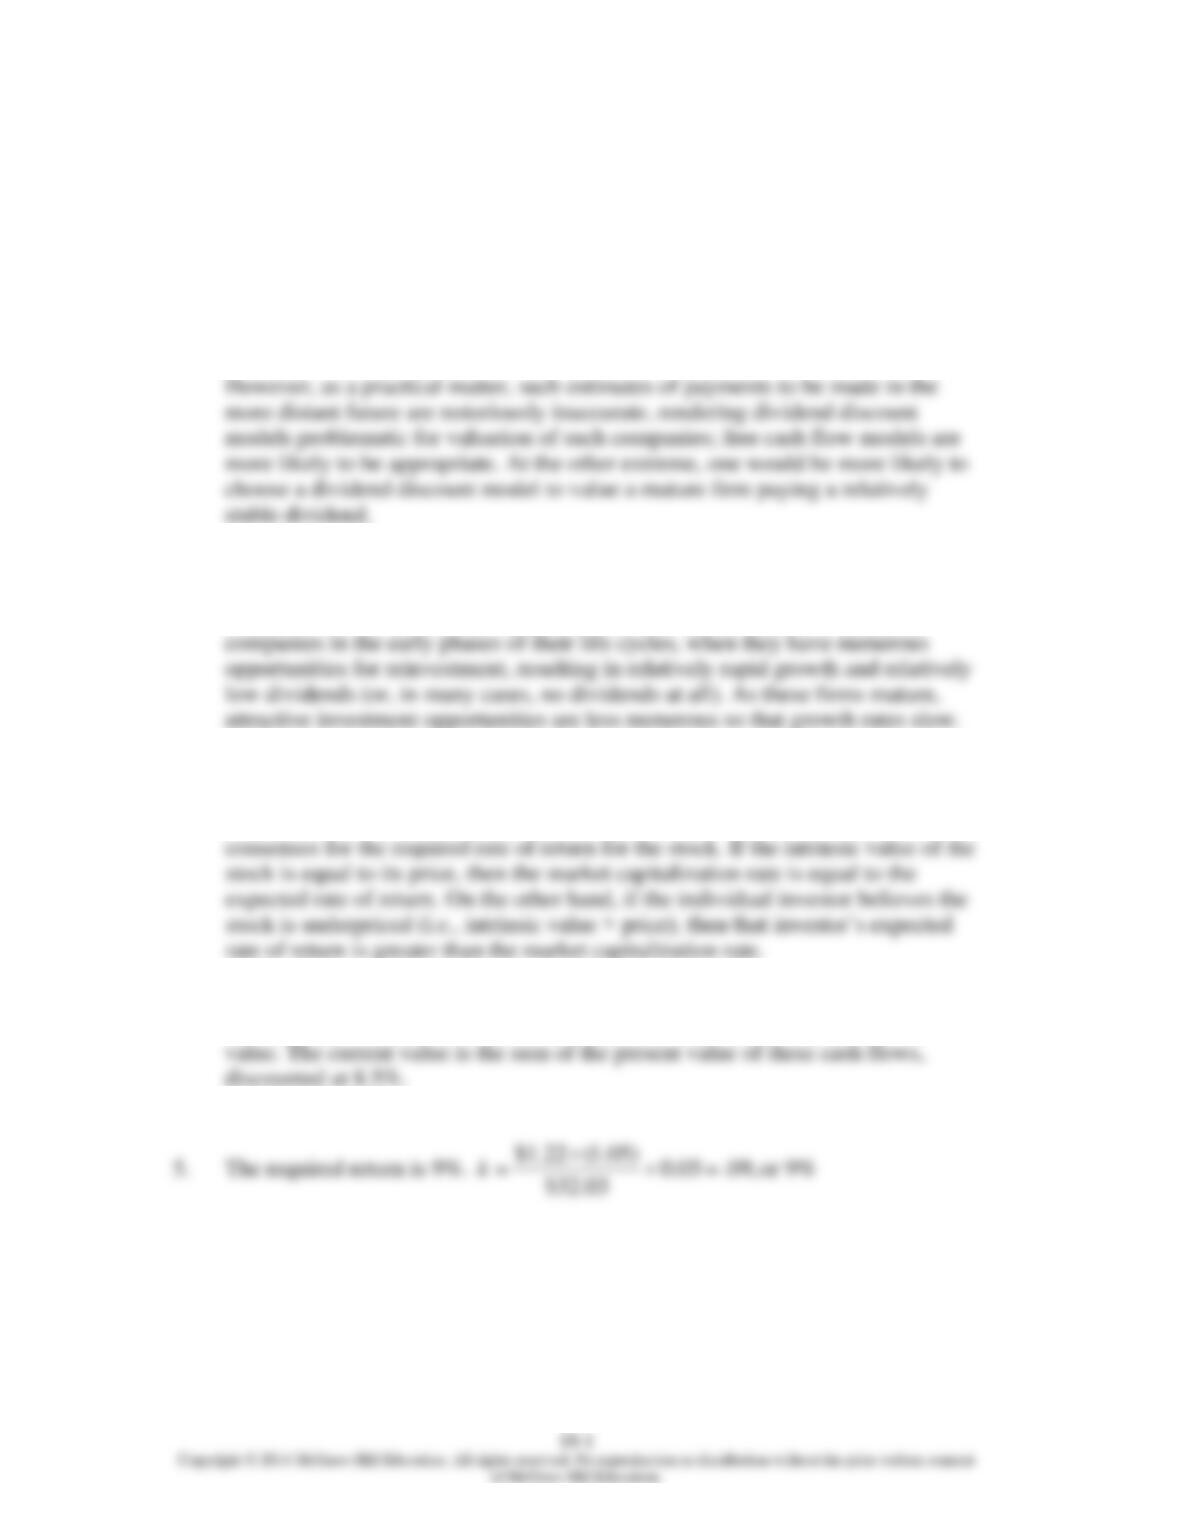
1. Theoretically, dividend discount models can be used to value the stock of rapidly
growing companies that do not currently pay dividends; in this scenario, we
would be valuing expected dividends in the relatively more distant future.
2. It is most important to use multistage dividend discount models when valuing
companies with temporarily high growth rates. These companies tend to be
3. The intrinsic value of a share of stock is the individual investor’s assessment of
the true worth of the stock. The market capitalization rate is the market
4. First estimate the amount of each of the next two dividends and the terminal
6. The Gordon DDM uses the dividend for period (t+1) which would be 1.05.
Chapter 18 – Equity Valuation Models
18-2
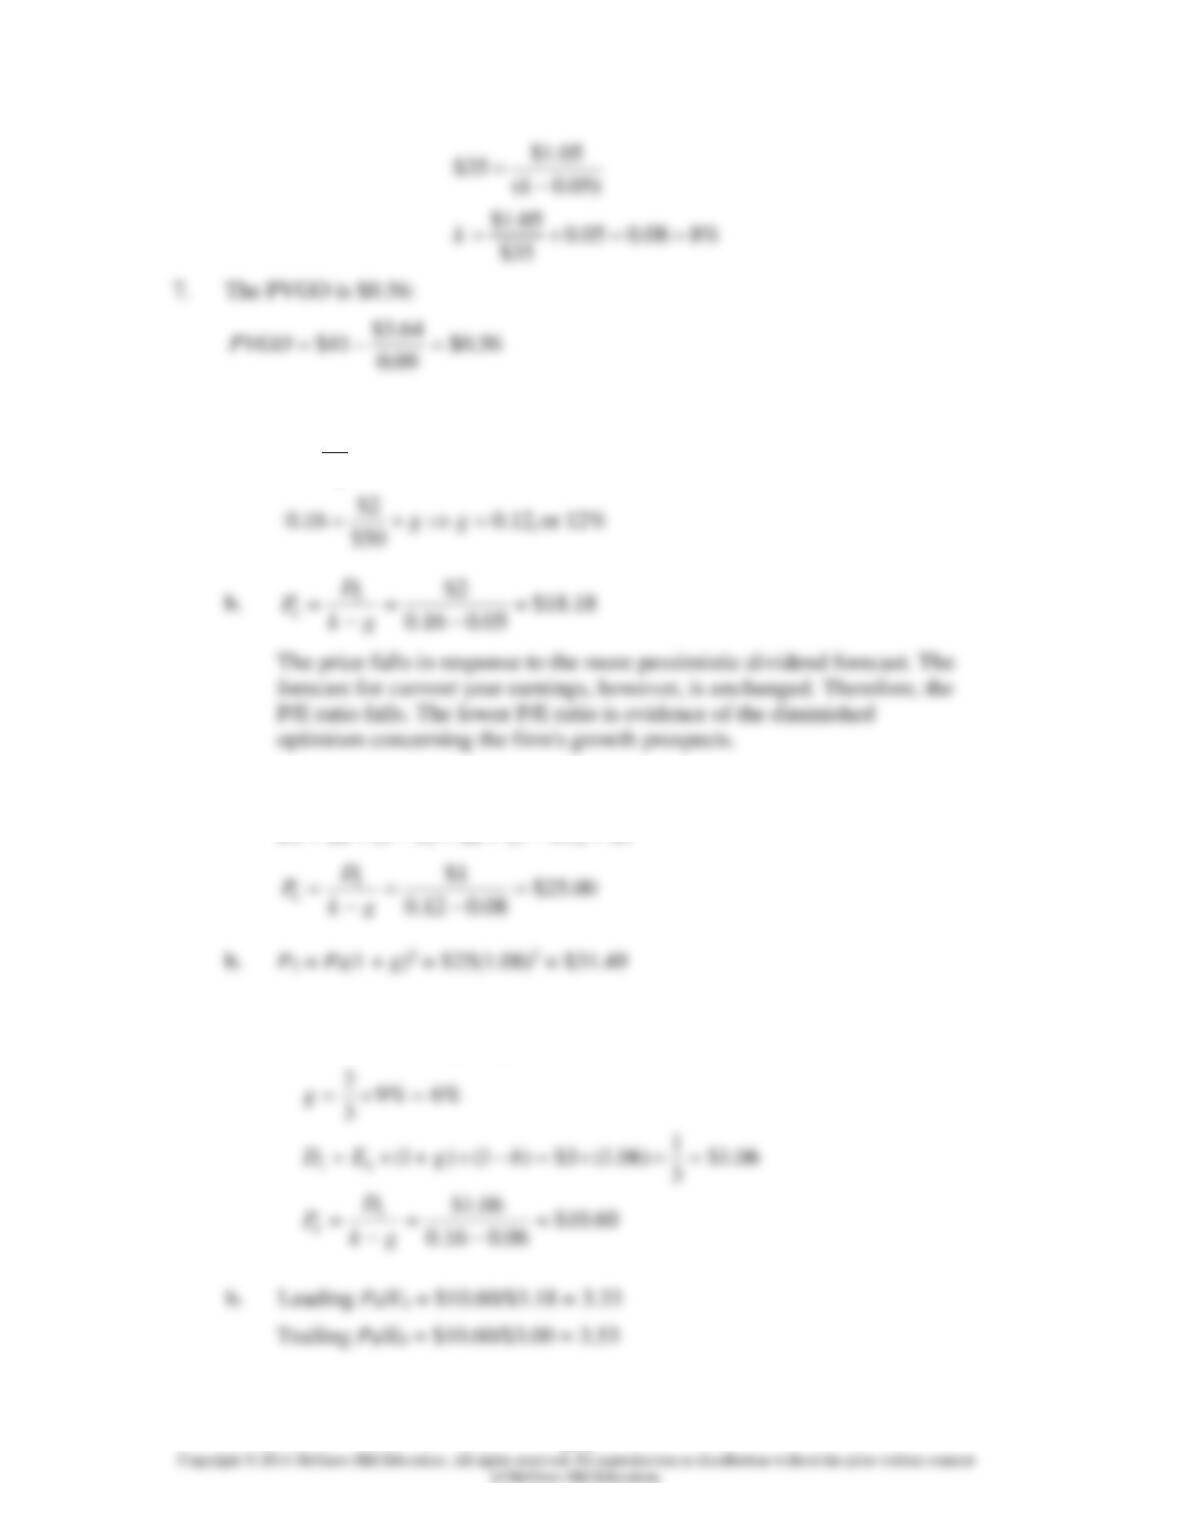
8. a.
9. a. g = ROE b = 16% 0.5 = 8%
D1 = $2 (1 – b) = $2 (1 – 0.5) = $1
10. a.
1
0
D
kg
P
=+
[ ( ) ] 6% 1.25 (14% 6%) 16%
f m f
k r E r r
= + − = + − =
Chapter 18 – Equity Valuation Models
18-3
11. a.
1
0
$8 $160
0.10 0.05
D
Pkg
= = =
−−
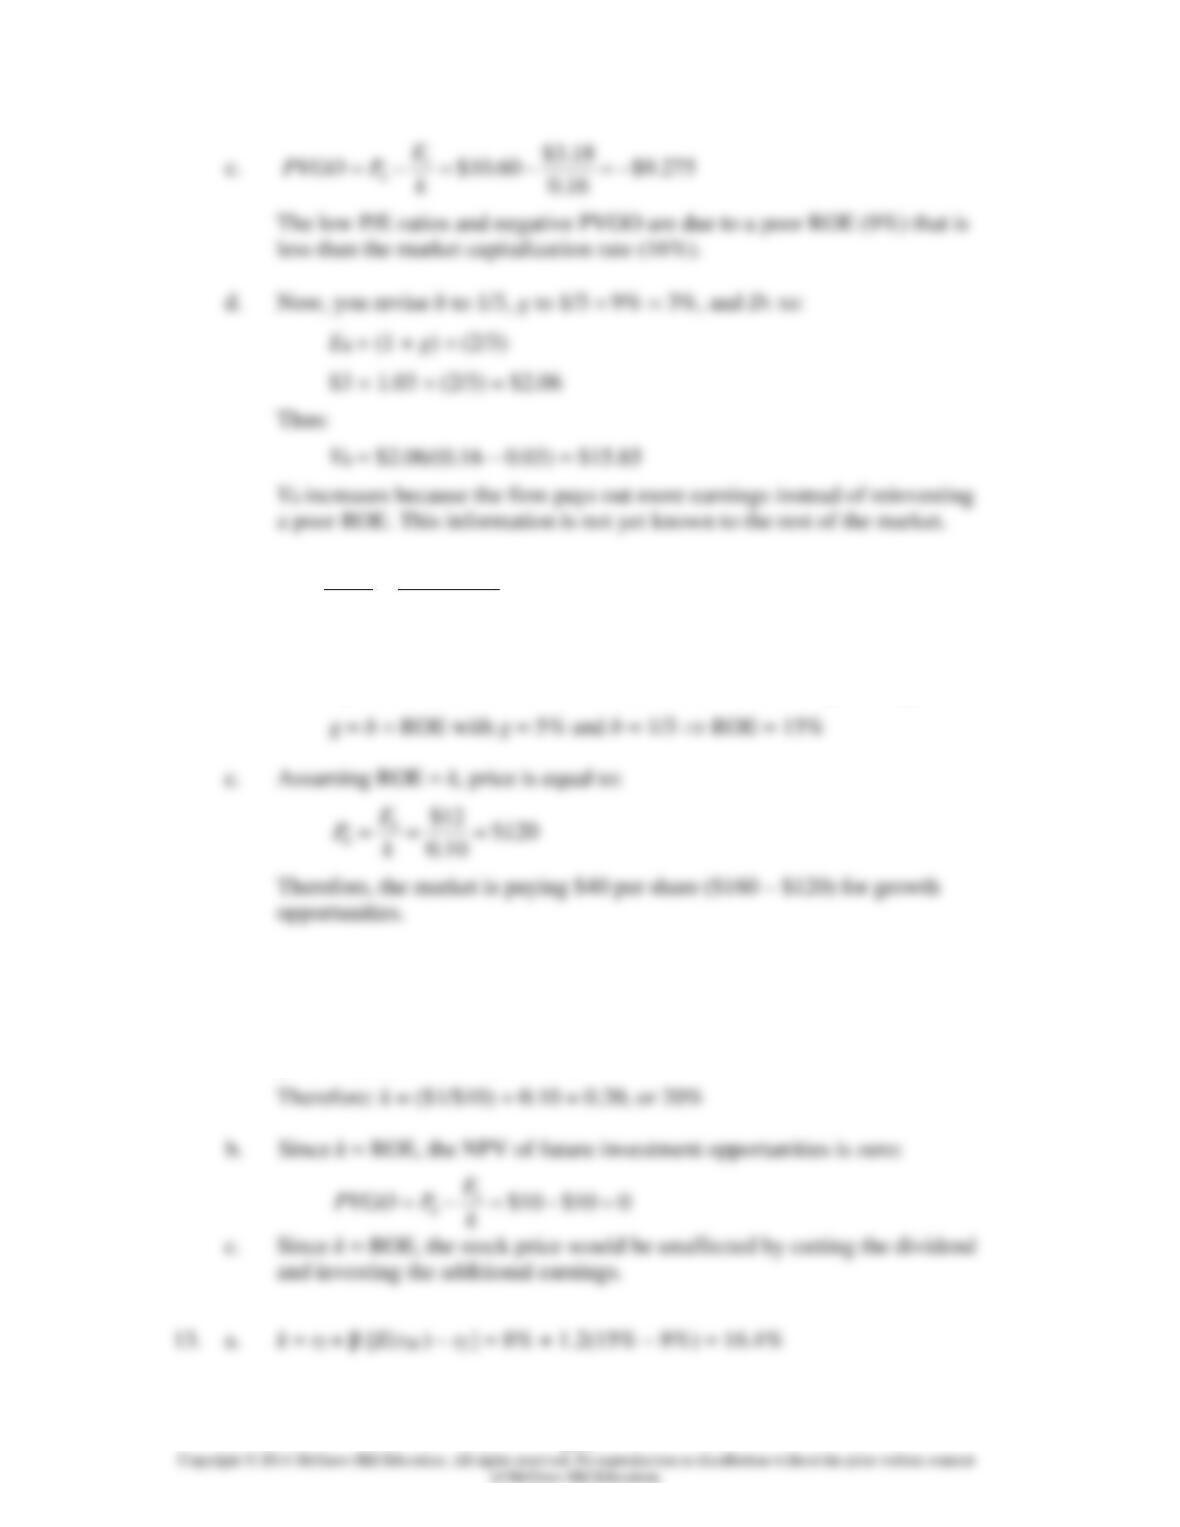
b. The dividend payout ratio is 8/12 = 2/3, so the plowback ratio is b = 1/3.
The implied value of ROE on future investments is found by solving:
12. a. k = D1/P0 + g
D1 = 0.5 $2 = $1
g = b ROE = 0.5 0.20 = 0.10
Chapter 18 – Equity Valuation Models
18-4
b. P1 = V1 = V0(1 + g) = $101.82 1.12 = $114.04
1 1 0
0
$4.48 $114.04 $100
( ) 0.1852,or 18.52%
$100
D P P
Er P
−++−
= = =
14.
Time:
0
1
5
6
The year-6 earnings estimate is based on growth rate of 0.15 × (1-.0.40) = 0.09.
a.
6
5
$10.85 $180.82
0.15 0.09
D
Vkg
= = =
−−
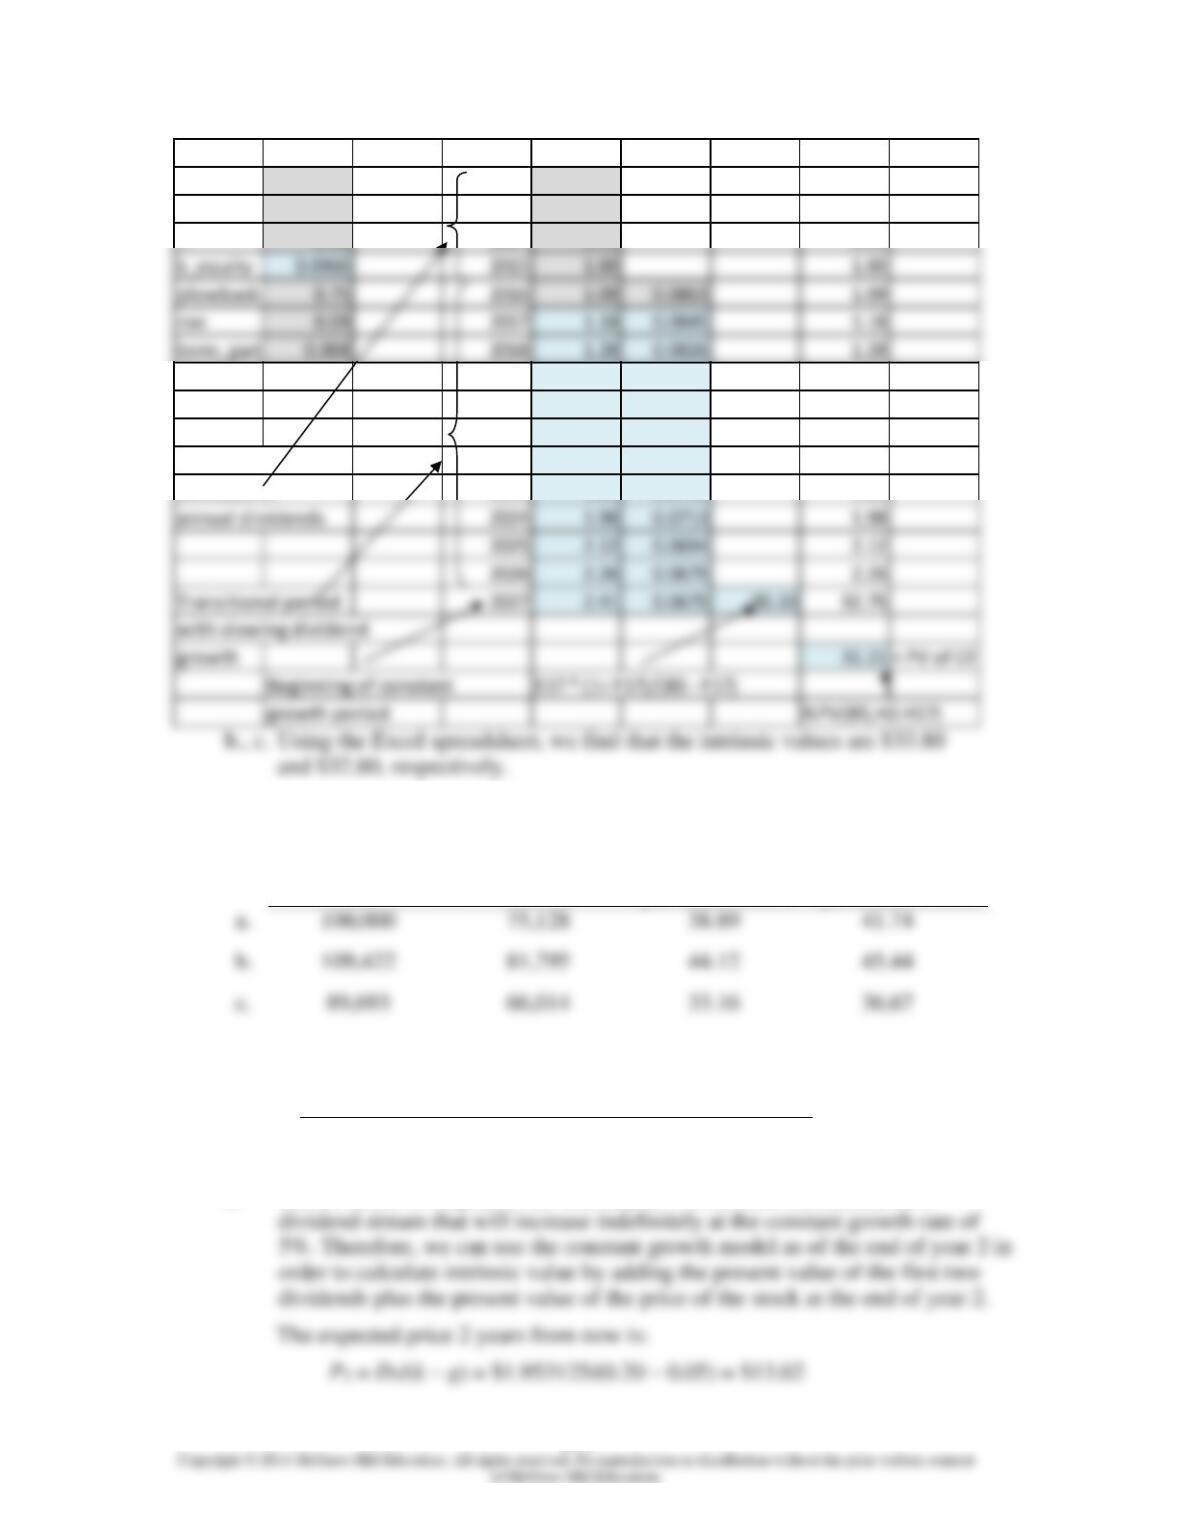
15. a. The solution is shown in the Excel spreadsheet below:
Chapter 18 – Equity Valuation Models
18-5
Inputs Year Dividend
Div growth
Term value
Investor CF
beta 0.95 2012 0.78 0.78
mkt_prem
term_gwth
0.08 2013 0.85 0.85
rf 0.02 2014 0.93 0.93
2019 1.38 0.0807 1.38
2020 1.49 0.0788 1.49
2021 1.60 0.0769 1.60
Value line 2022 1.72 0.0750 1.72
forecasts of 2023 1.85 0.0732 1.85
16. The solutions derived from Spreadsheet 18.2 are as follows:
Intrinsic Value:
FCFF
Intrinsic Value:
FCFE
Intrinsic Value
per Share: FCFF
Intrinsic Value
per Share: FCFE
17.
Time:
0
1
2
3
D t
$1.0000
$1.2500
$1.5625
$1.953
g
25.0%
25.0%
25.0%
5.0%
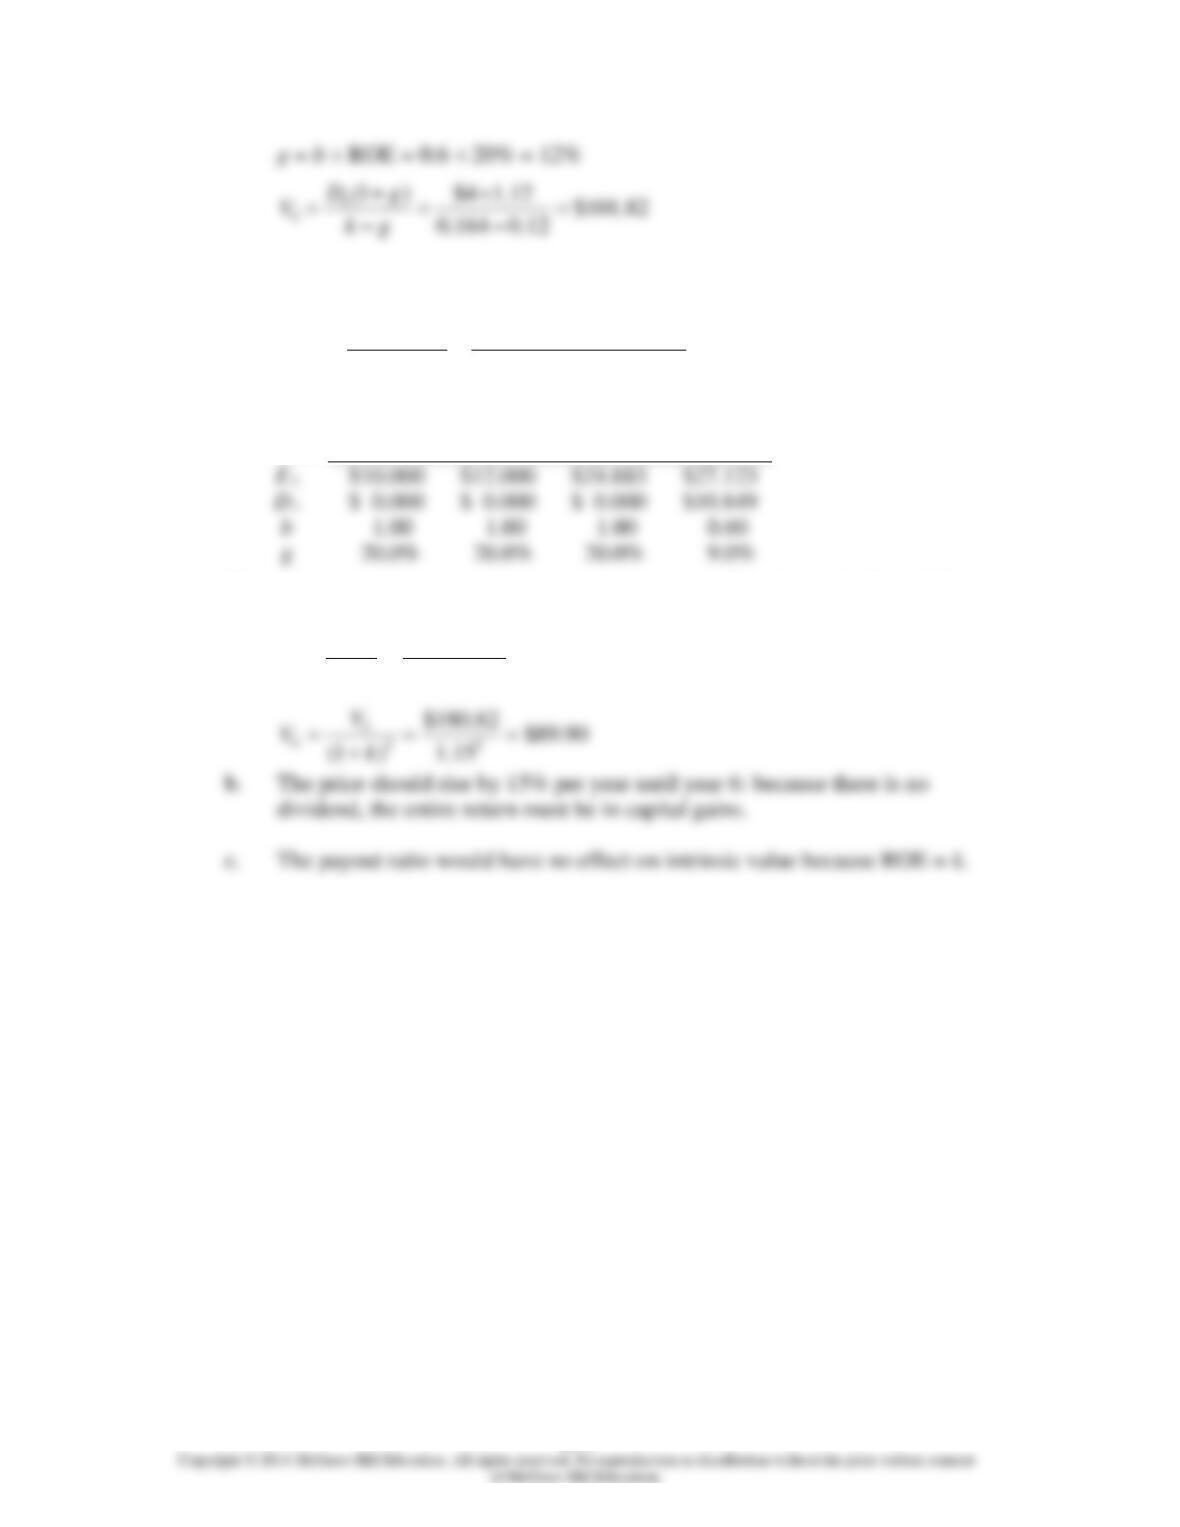
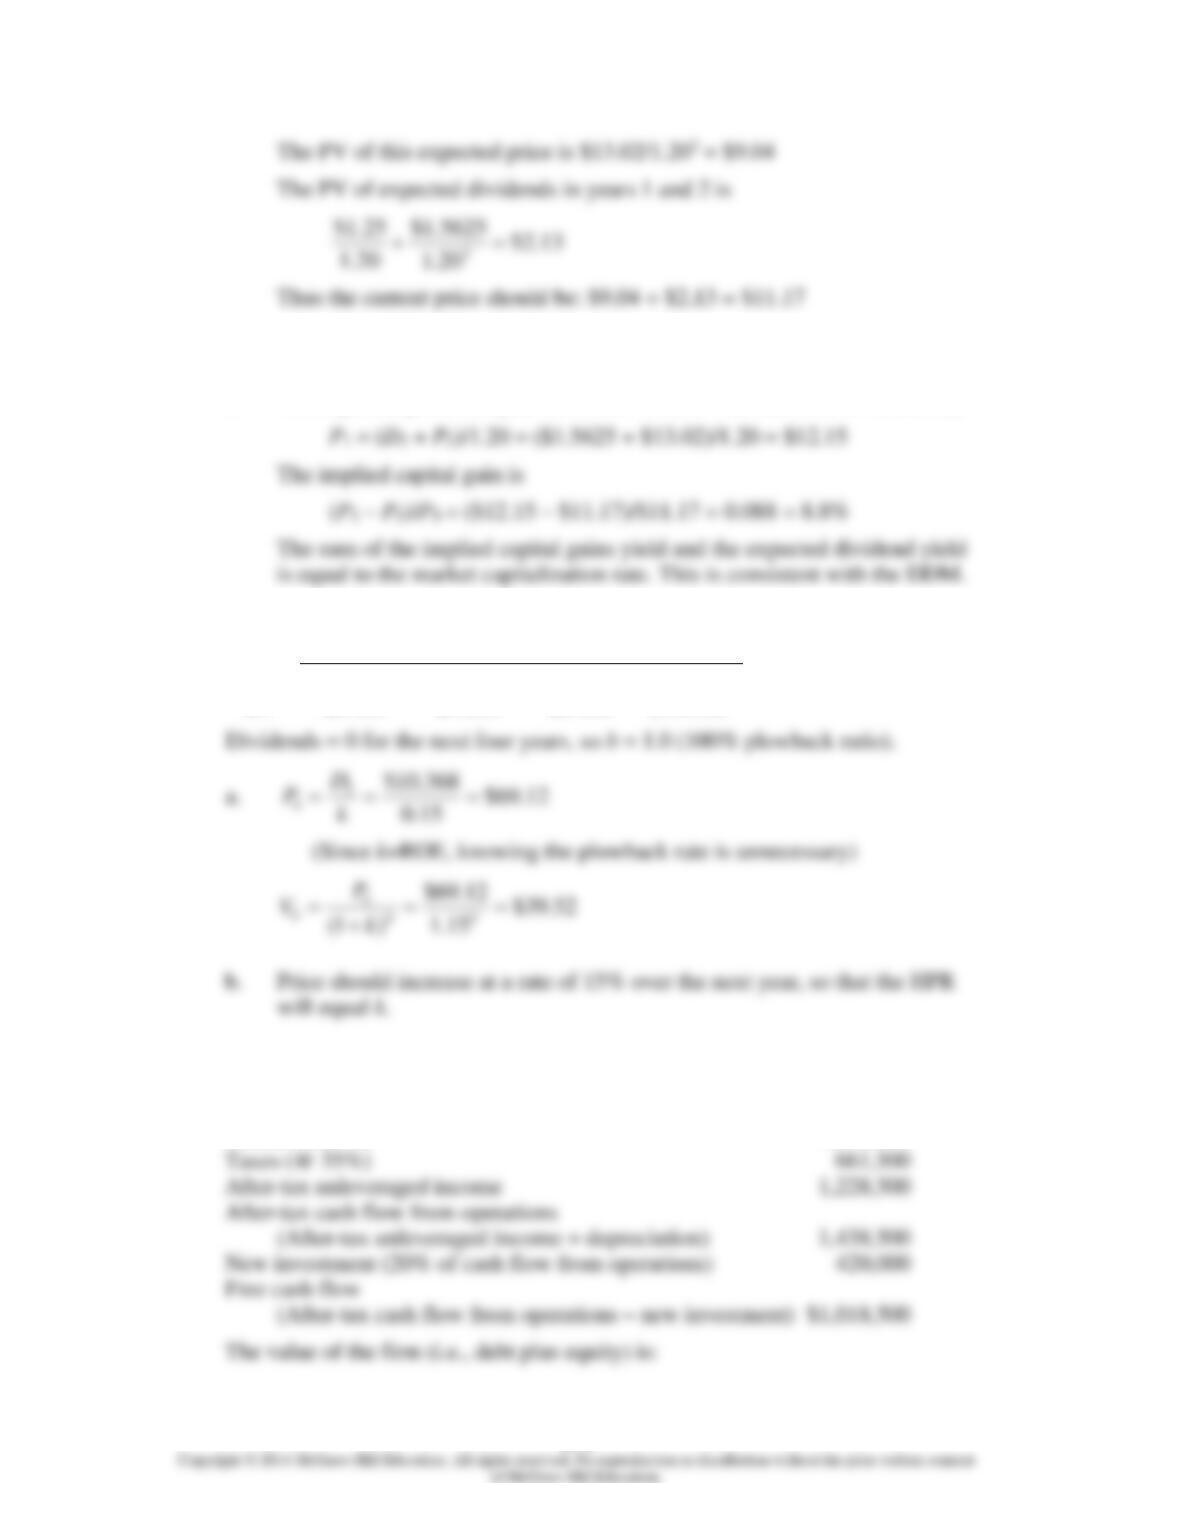
a. The dividend to be paid at the end of year 3 is the first installment of a
Chapter 18 – Equity Valuation Models
18-6
b. Expected dividend yield = D1/P0 = $1.25/$11.17 = 0.112, or 11.2%
c. The expected price one year from now is the PV at that time of P2 and D2:
18.
Time:
0
1
4
5
E t
$5.000
$6.000
$10.368
$10.368
D t
$0.000
$0.000
$0.000
$10.368
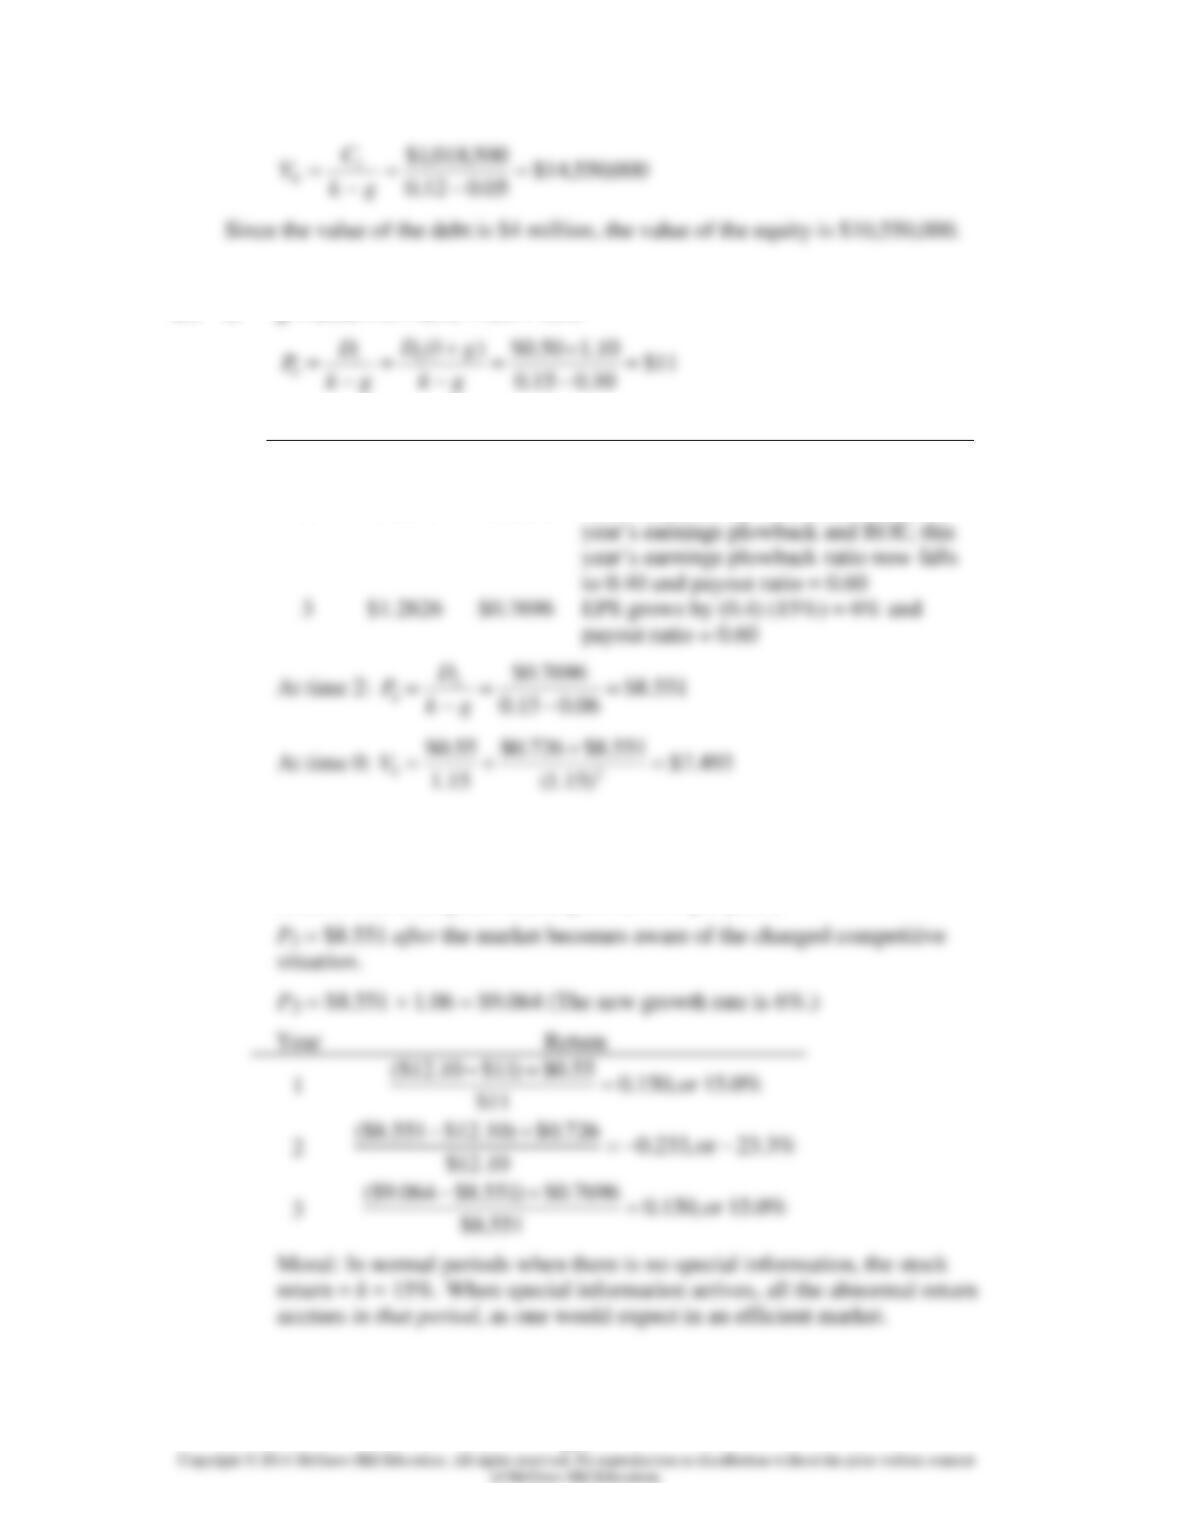
19. Before-tax cash flow from operations $2,100,000
Depreciation 210,000
Taxable Income 1,890,000
Chapter 18 – Equity Valuation Models
18-7
20. a. g = ROE b = 20% 0.5 = 10%
b.
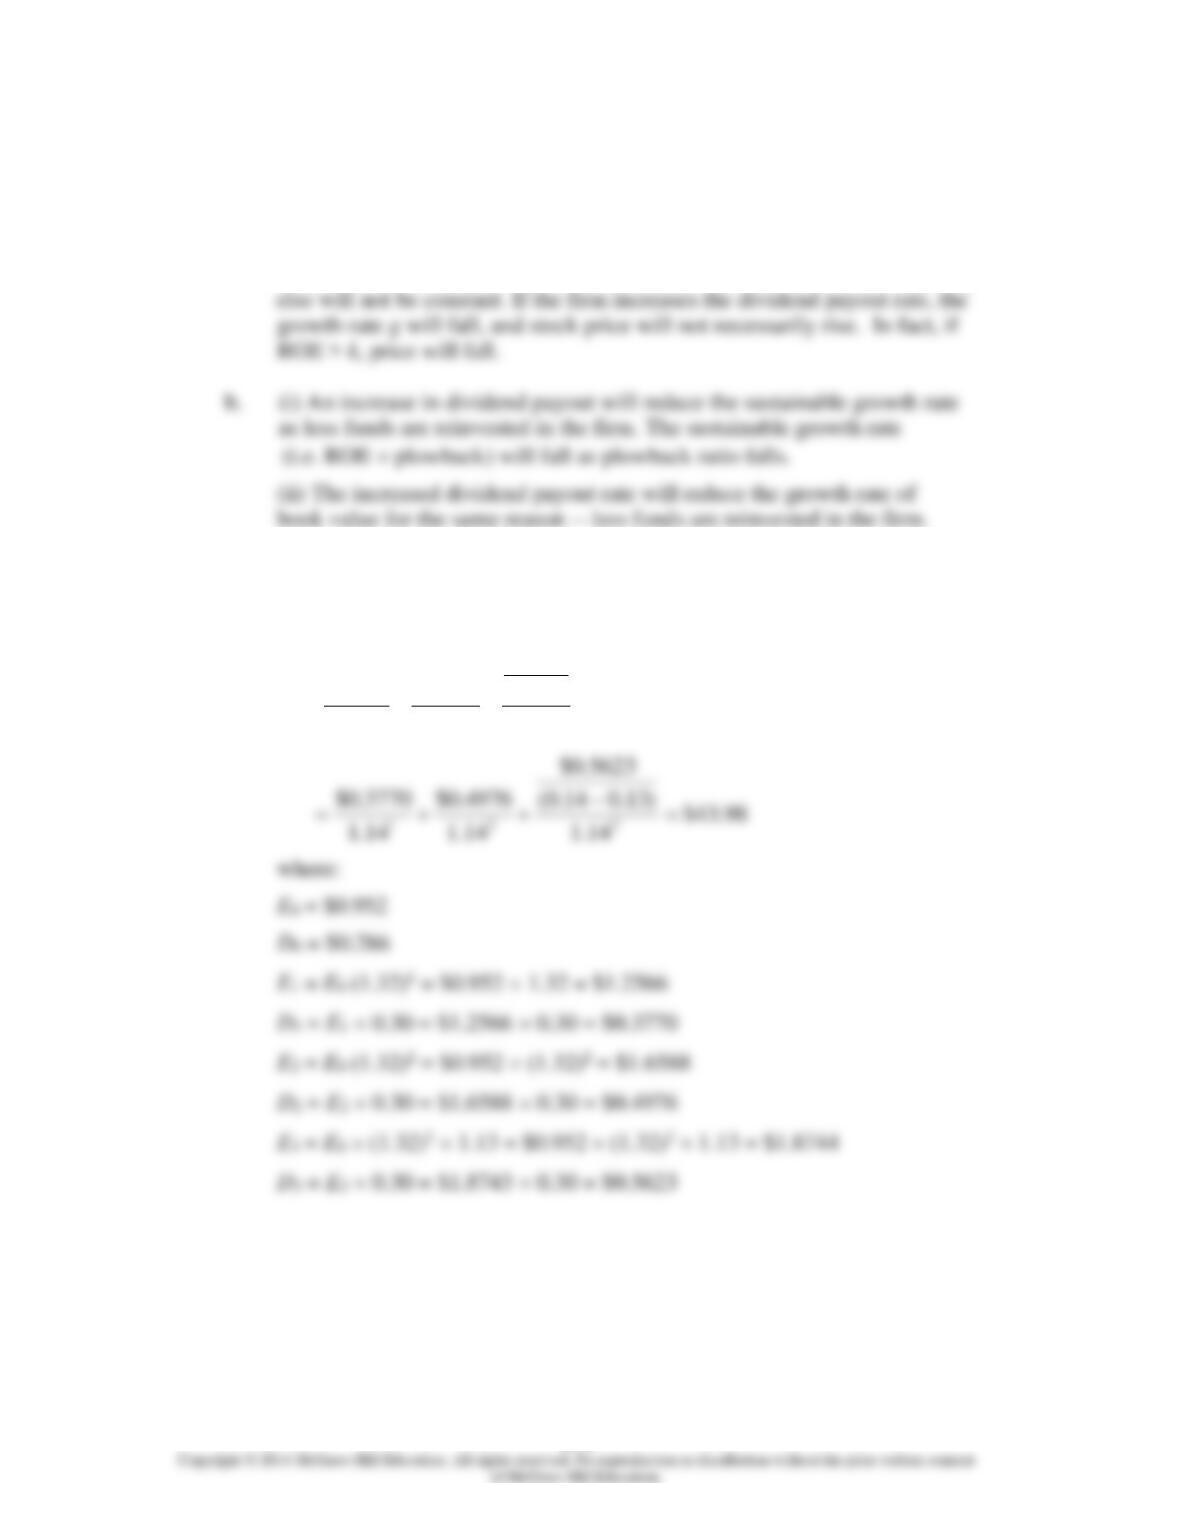
Time
EPS
Dividend
Comment
0
$1.0000
$0.5000
1
1.1000
0.5500
g = 10%, plowback = 0.50
2
1.2100
0.7260
to 0.40 and payout ratio = 0.60
payout ratio = 0.60
EPS has grown by 10% based on last
Year
c. P0 = $11 and P1 = P0(1 + g) = $12.10
(Because the market is unaware of the changed competitive situation, it
believes the stock price should grow at 10% per year.)
Chapter 18 – Equity Valuation Models
18-8
CFA PROBLEMS
1. a. This director is confused. In the context of the constant growth model
[i.e., P0 = D1/ k – g)], it is true that price is higher when dividends are higher
holding everything else including dividend growth constant. But everything
2. Using a two-stage dividend discount model, the current value of a share of
Sundanci is calculated as follows.
3
12
01 2 2
()
(1 ) (1 ) (1 )
D
DD
kg
Vk k k
−
= + +
+ + +
Chapter 18 – Equity Valuation Models
18-9
3. a. Free cash flow to equity (FCFE) is defined as the cash flow remaining after
meeting all financial obligations (including debt payment) and after
covering capital expenditure and working capital needs. The FCFE is a
measure of how much the firm can afford to pay out as dividends but, in a
given year, may be more or less than the amount actually paid out.
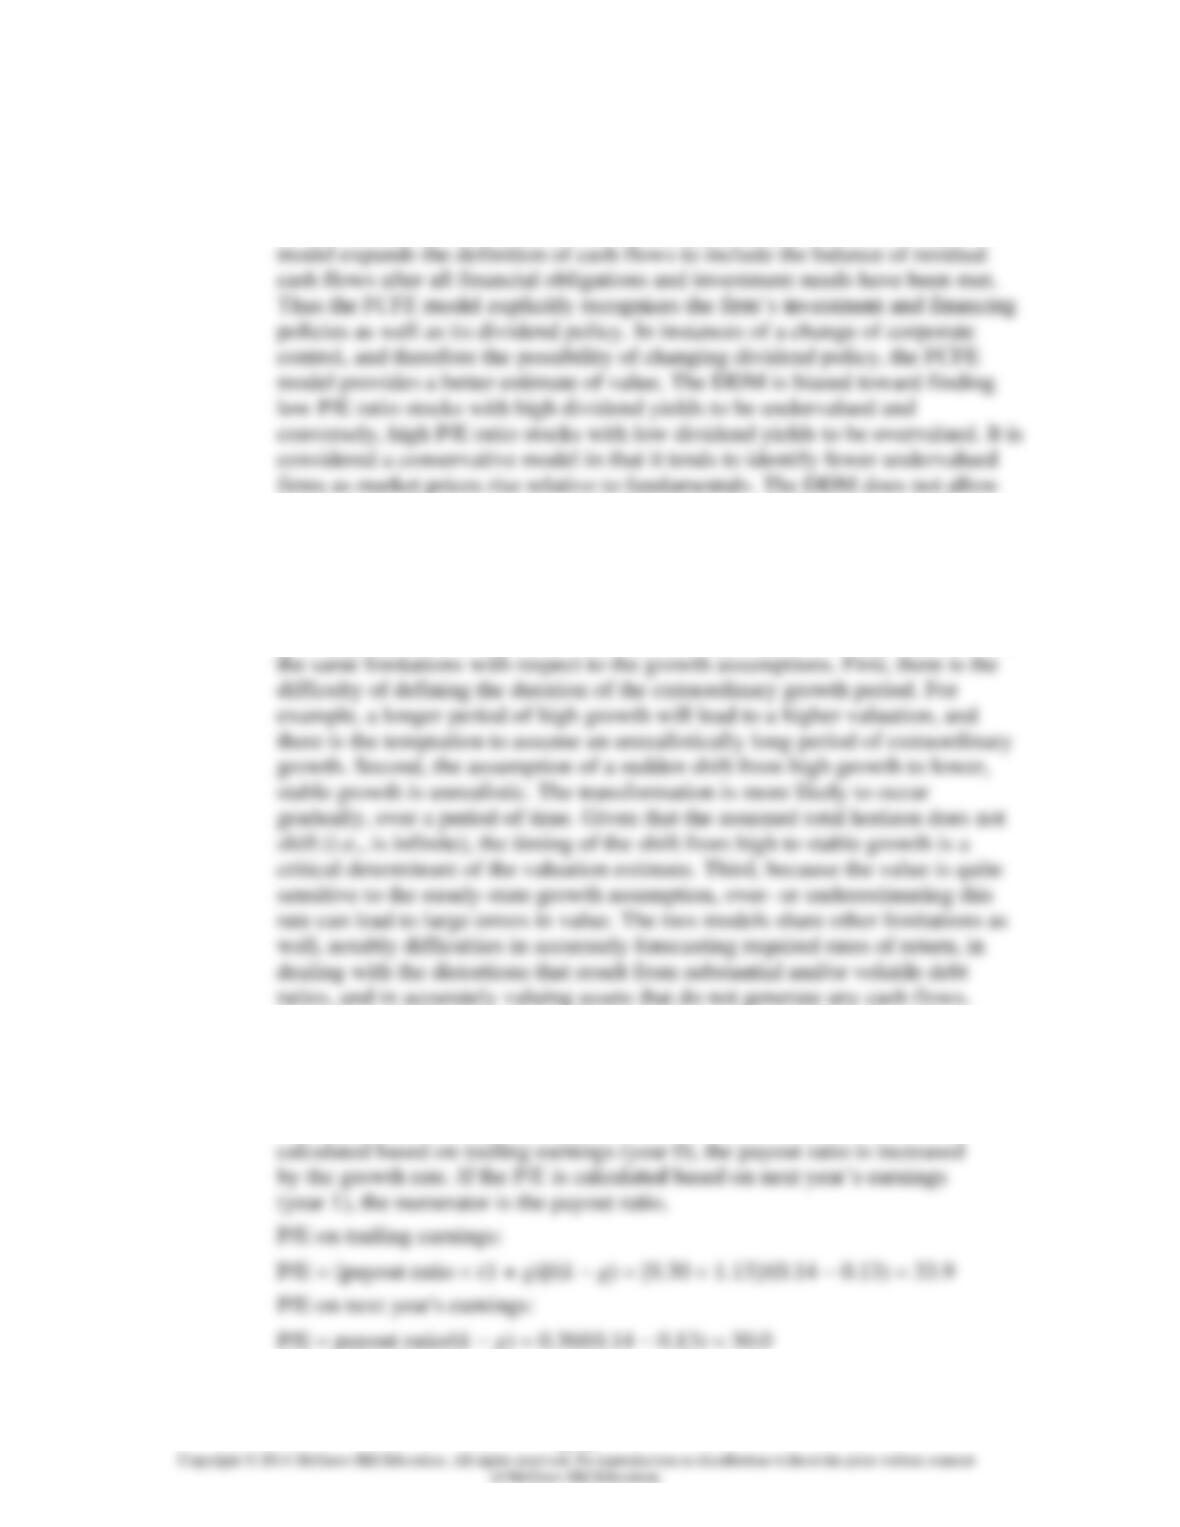
Sundanci’s FCFE for the year 2008 is computed as follows:
b. The FCFE model requires forecasts of FCFE for the high growth years
(2012 and 2013) plus a forecast for the first year of stable growth (2014) in
order to allow for an estimate of the terminal value in 2013 based on
FCFE Base Assumptions
Shares outstanding: 84 million, k = 14%
Actual
2011
Projected
2012
Projected
2013
Projected
2014
Growth rate (g)
27%
27%
13%
Total
Per Share
Earnings after tax
$80
$0.952
$1.2090
$1.5355
$1.7351
Plus: Depreciation expense
23
0.274
0.3480
0.4419
$0.4994
Less: Increase in net working capital
0.6198
Equals: FCFE
0.3632
Total cash flows to equity
Discounted value
Chapter 18 – Equity Valuation Models
18–10
c. i. The DDM uses a strict definition of cash flows to equity, i.e. the expected
dividends on the common stock. In fact, taken to its extreme, the DDM cannot
be used to estimate the value of a stock that pays no dividends. The FCFE
for the potential tax disadvantage of high dividends relative to the capital gains
achievable from retention of earnings.
ii. Both two-stage valuation models allow for two distinct phases of growth, an
initial finite period where the growth rate is abnormal, followed by a stable
growth period that is expected to last indefinitely. These two-stage models share
4. a. The formula for calculating a price earnings ratio (P/E) for a stable growth
firm is the dividend payout ratio divided by the difference between the
required rate of return and the growth rate of dividends. If the P/E is
Chapter 18 – Equity Valuation Models
b. The P/E ratio is a decreasing function of riskiness; as risk increases, the P/E
5. a. The sustainable growth rate is equal to:
Plowback ratio × Return on equity = b × ROE
b. i. The increased retention ratio increased the sustainable growth rate.
Retention ratio =
[Net income – (Dividend per share Shares outstanding)]
Net income
Retention ratio increased from 0.6154 in 2010 to 0.7091 in 2013.
This increase in the retention ratio directly increased the sustainable growth
rate because the retention ratio is one of the two factors determining the
sustainable growth rate.
Chapter 18 – Equity Valuation Models
18–12
6. a. The formula for the Gordon model is
0
0
(1 )Dg
Vkg
+
=−
where:
b. Use of the Gordon growth model would be inappropriate to value
Dynamic’s common stock, for the following reasons:
i. The Gordon growth model assumes a set of relationships about the growth
rate for dividends, earnings, and stock values. Specifically, the model
7. a. The industry’s estimated P/E can be computed using the following model:
Chapter 18 – Equity Valuation Models
18–13
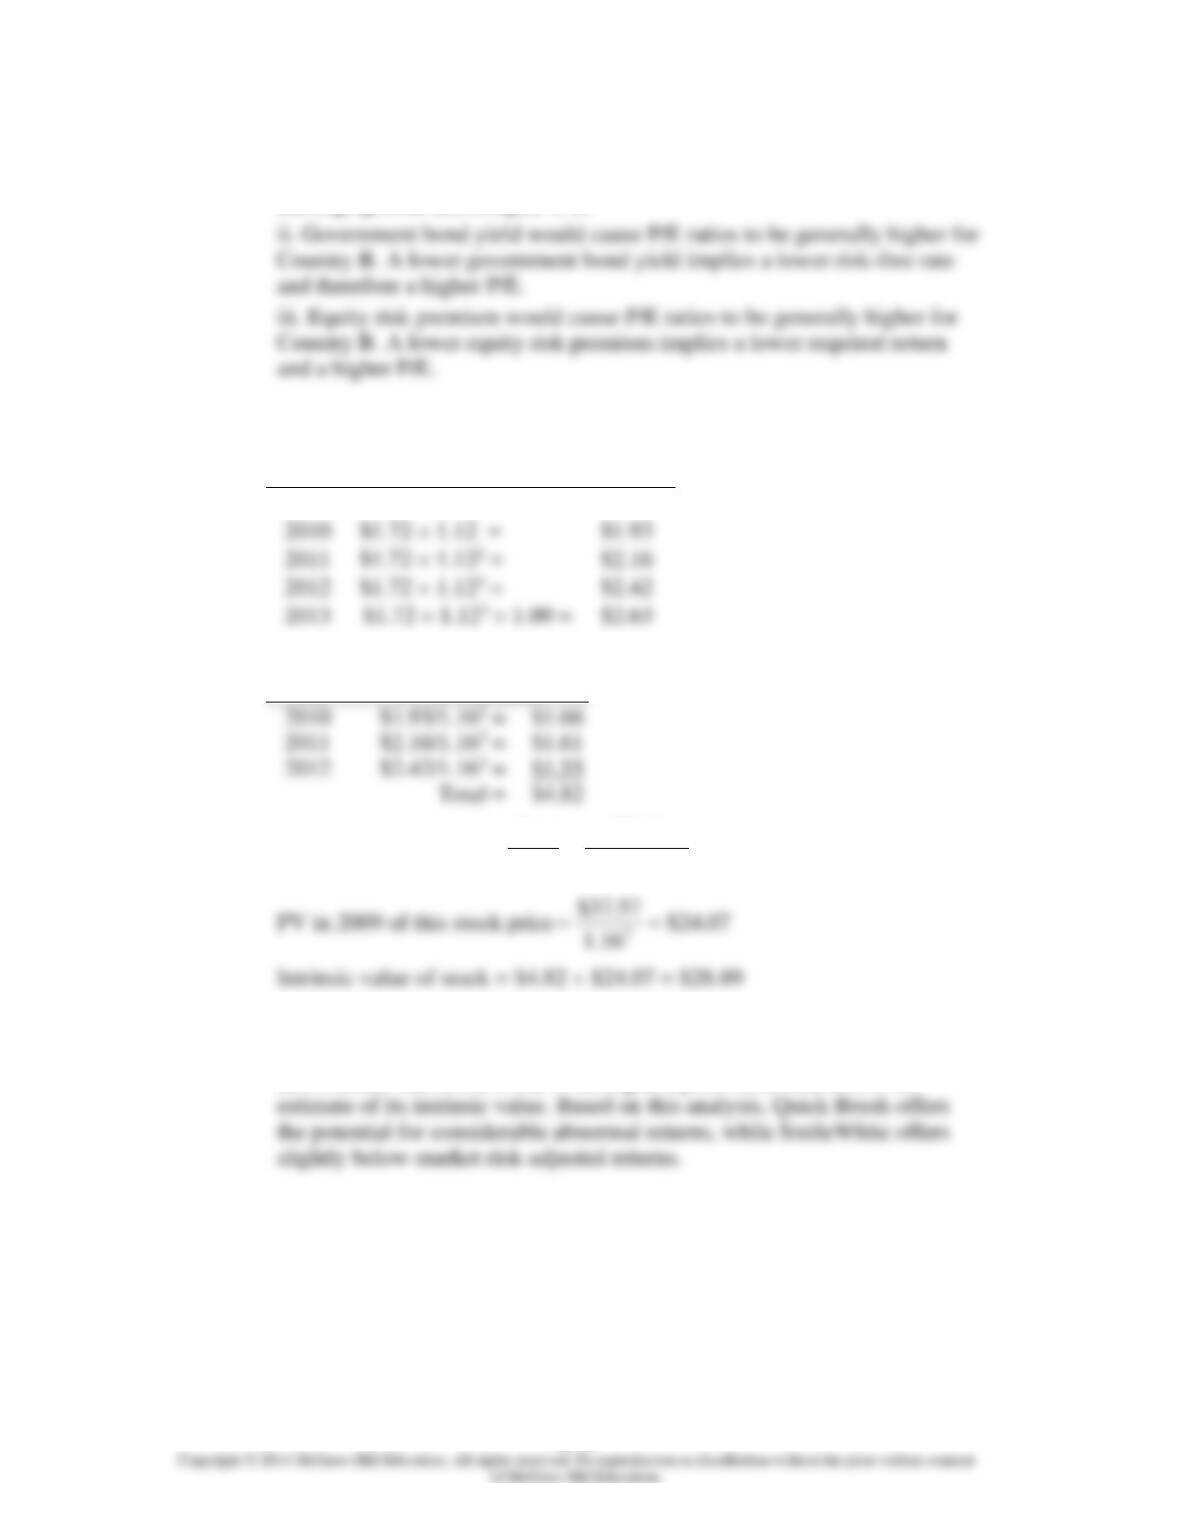
b. i. Forecast growth in real GDP would cause P/E ratios to be generally
higher for Country A. Higher expected growth in GDP implies higher
earnings growth and a higher P/E.
8. a. k = rf + β (kM – rf) = 4.5% + 1.15(14.5% − 4.5%) = 16%
b.
Year
Dividend
2009
$1.72
2010
$1.72 1.12 =
$1.93
2011
$2.16
2012
$2.42
2013
$2.63
Present value of dividends paid in 2010 – 2012:
Year
PV of Dividend
2010
$1.66
2011
$1.61
2012
$1.55
Price at year-end 2012
57.37$
09.016.0
63.2$2013 =
−
=
−
=gk
D
c. The data in the problem indicate that Quick Brush is selling at a price
substantially below its intrinsic value, while the calculations above
demonstrate that SmileWhite is selling at a price somewhat above the
Chapter 18 – Equity Valuation Models
18–14
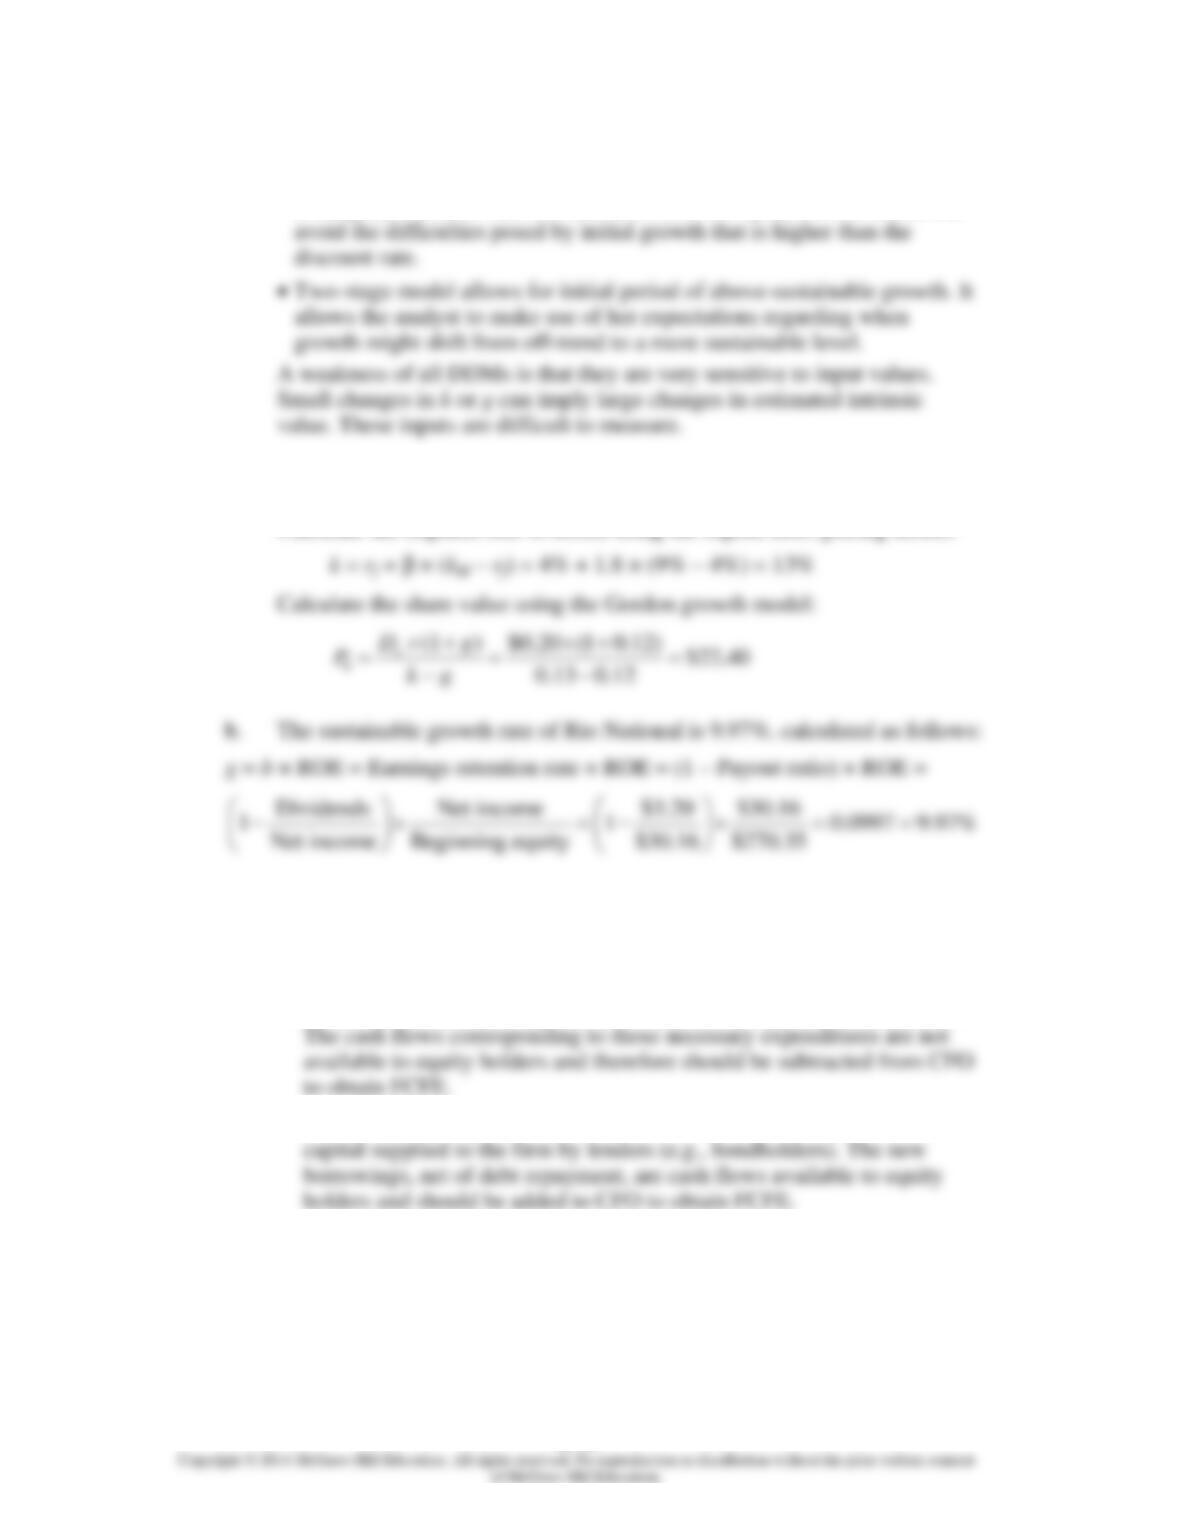
d. Strengths of two-stage versus constant growth DDM:
• Two-stage model allows for separate valuation of two distinct periods in
a company’s future. This can accommodate life-cycle effects. It also can
9. a. The value of a share of Rio National equity using the Gordon growth model
and the capital asset pricing model is $22.40, as shown below.
Calculate the required rate of return using the capital asset pricing model:
10. a. To obtain free cash flow to equity (FCFE), the two adjustments that Shaar
should make to cash flow from operations (CFO) are:
1. Subtract investment in fixed capital: CFO does not take into account the
investing activities in long-term assets, particularly plant and equipment.
2. Add net borrowing: CFO does not take into account the amount of
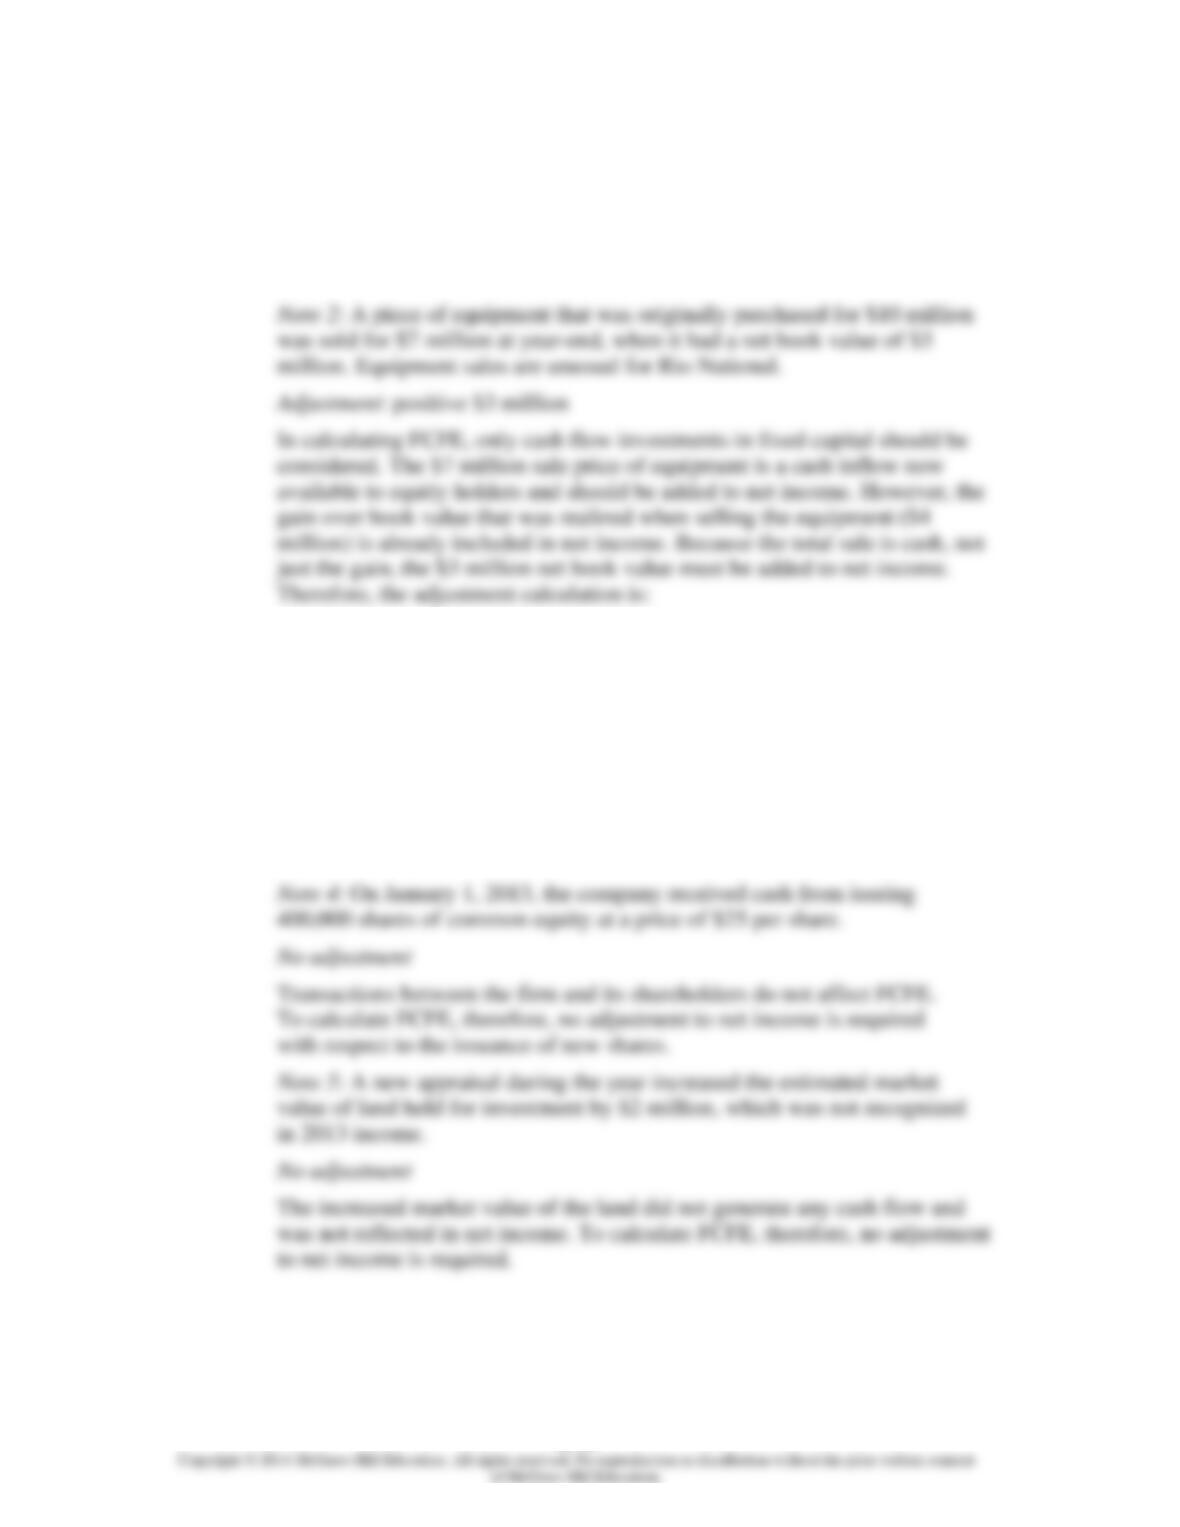
Chapter 18 – Equity Valuation Models
18–15
b. Note 1: Rio National had $75 million in capital expenditures during the year.
Adjustment: negative $75 million
The cash flows required for those capital expenditures (–$75 million) are
no longer available to the equity holders and should be subtracted from net
income to obtain FCFE.
$7 million in cash received – $4 million of gain recorded in net income =
$3 million additional cash received added to net income to obtain FCFE.
Note 3: The decrease in long-term debt represents an unscheduled principal
repayment; there was no new borrowing during the year.
Adjustment: negative $5 million
The unscheduled debt repayment cash flow (–$5 million) is an amount no
longer available to equity holders and should be subtracted from net income
to determine FCFE.
Chapter 18 – Equity Valuation Models
18–16
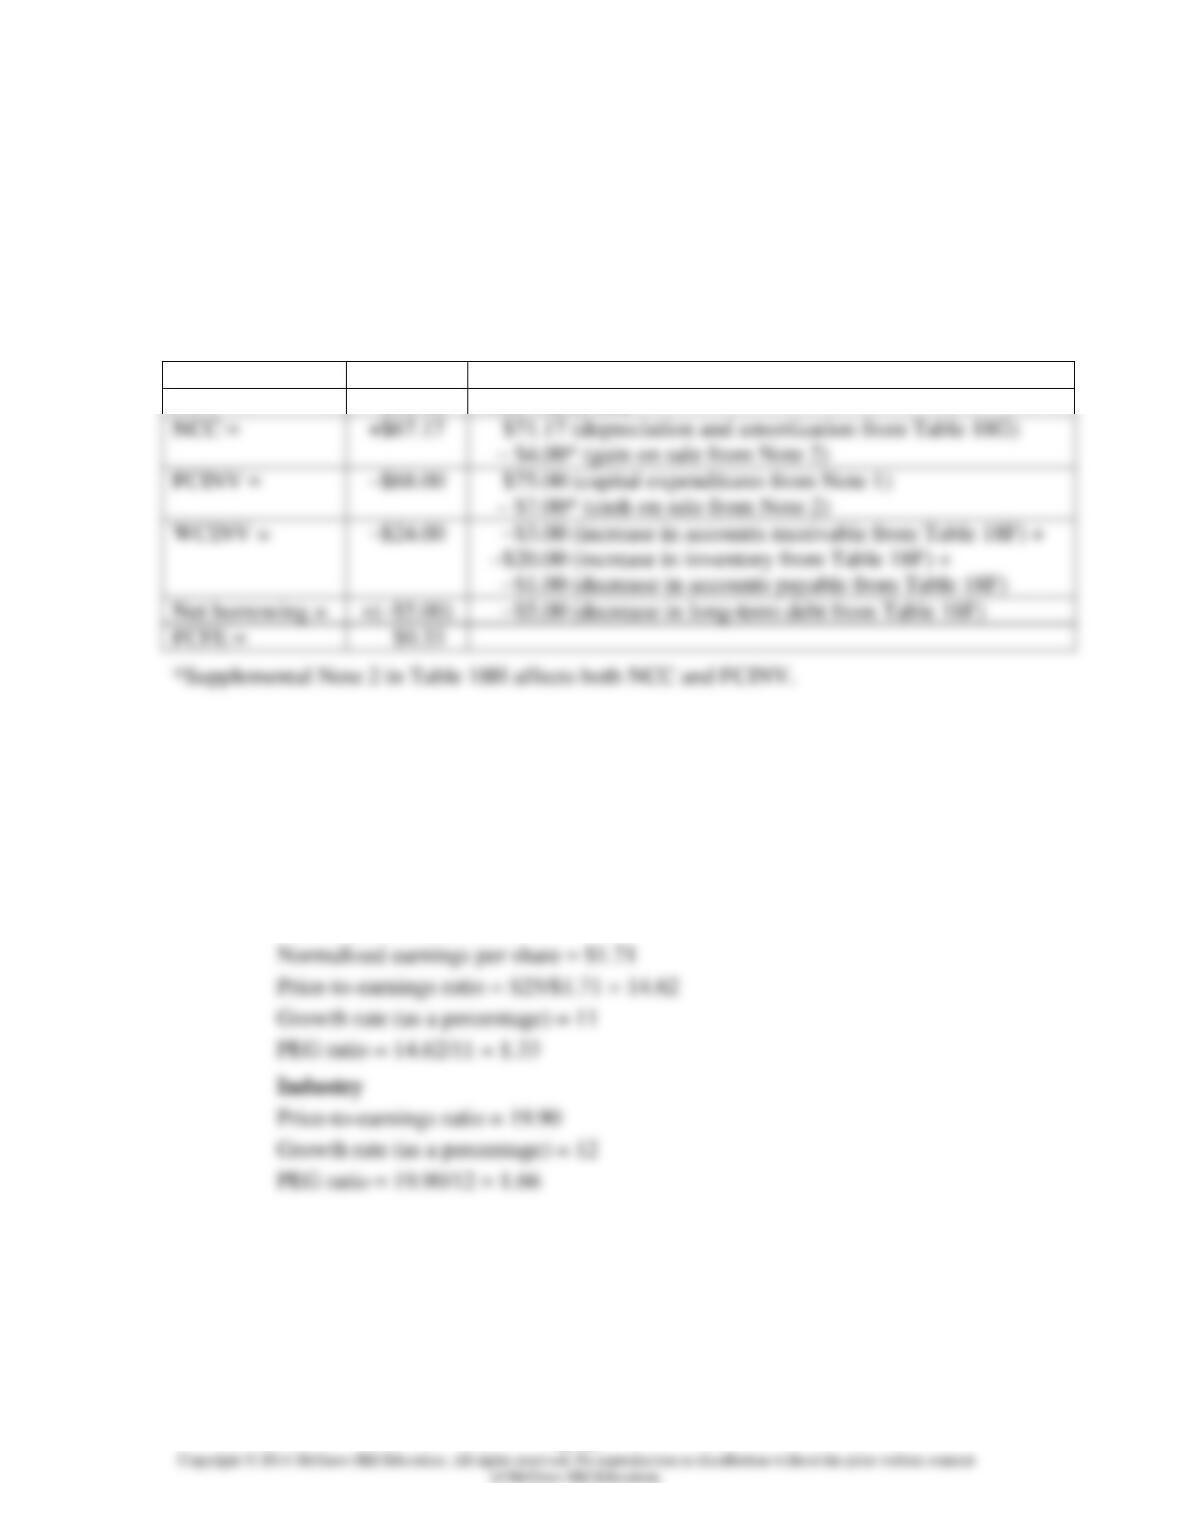
c. Free cash flow to equity (FCFE) is calculated as follows:
FCFE = NI + NCC – FCINV – WCINV + Net borrowing
where:
NCC = Noncash charges
FCINV = Investment in fixed capital
WCINV = Investment in working capital
Million $
Explanation
NI =
$30.16
From Table 18G
Net borrowing =
FCFE =
11. Rio National’s equity is relatively undervalued compared to the industry on a P/E-to–
growth (PEG) basis. Rio National’s PEG ratio of 1.33 is below the industry PEG
ratio of 1.66. The lower PEG ratio is attractive because it implies that the growth rate
at Rio National is available at a relatively lower price than is the case for the
industry. The PEG ratios for Rio National and the industry are calculated below:
Rio National
Current price = $25.00