
Chapter 18 – Portfolio Performance Evaluation
CHAPTER EIGHTEEN
PORTFOLIO PERFORMANCE EVALUATION
CHAPTER OVERVIEW
This chapter presents various performance measures that are used for evaluation of portfolios.
The process of decomposing portfolio returns into the various components of the portfolio-
building process is presented. Performance measures of market timing, security selection and
adding securities to a diversified portfolio are introduced.
LEARNING OBJECTIVES
After studying this chapter, the student should be able to calculate various risk-adjusted return
measures, including Jensen’s alpha, the Sharpe and Treynor ratios, the M2 measure, and the
information ratio and know when to use each. The students should be able to decompose excess
returns into components attributable to asset allocation and security selection. Students should
also understand market timing, timing performance measures and the problems that timing
causes in performance measurement.
CHAPTER OUTLINE
1. Risk-Adjusted Returns
PPT 18-2 through PPT 18-17
Passive management consists of choosing a capital allocation between cash and the risky
portfolio and choosing the asset allocation within the risky portfolio. However, how passive the
management actually is varies from, “set it and forget it,” to changing allocations in according to
perceptions of risk to keep current with portfolio goals. Active management is a step beyond.
Active management involves forecasting future rates of return on either/both asset classes and
The purpose of performance evaluation is to ascertain whether the returns earned are worth the
risk and the fees charged. The average return by itself is an insufficient measure of performance
Chapter 18 – Portfolio Performance Evaluation
What is needed is a measure of abnormal performance. One can get more return in bull markets
by taking on more risk, this doesn’t mean the managers are adding value; can they generate good
returns consistently through time across different market cycles? It takes measures that
incorporate risk and it requires statistical work to make us believe the results are not just due to
chance.
How can managers generate abnormal performance? There are several means:
• Successful across asset allocations (time the market)
Obtaining an accurate estimate of risk-adjusted performance for a portfolio manager is difficult
for several reasons. First, in order to measure abnormal performance one needs an accurate
model of normal performance. Is a single index model an adequate measure of expected
performance or should a multi–index model be used? Second, most of the sound measures of
Basic performance measurement compares portfolio performance to some benchmark portfolio.
The comparison to the benchmark is only appropriate if the risk is the same. Comparison groups
Jensen’s alpha is a very widely understood measure of abnormal performance. It can be
calculated from a single index model:
Alpha is a measure of abnormal return, but we must establish the statistical significance via
regression
ptPMtPPt eαRβR++=
PMtPP α)E(Rβ)E(R +=
M
P
P
PRβ–Rα=

Chapter 18 – Portfolio Performance Evaluation
The Treynor measure also calculates the excess return to variability ratio but it uses the portfolio
beta as the risk measure. The Sharpe and the Treynor measures should result in similar rankings
for most widely diversified portfolios. With portfolios that are widely diversified, most of the
risk will be systematic.
One may want to compare the reward to risk ratios where risk is measured as solely systematic
risk.
This measure asks the question, “How much excess return does one get for the level of risk?” In
a well diversified portfolio systematic risk will be the only remaining risk. This measure might
still be useful if we are analyzing a non-diversified portfolio such as a sector fund that is held in
conjunction with other funds that in total are diversified. This is an important point to stress to
the students.
Chapter 18 – Portfolio Performance Evaluation
When evaluating a portfolio to be mixed with a position in the passive benchmark portfolio one
must draw on insights of the Treynor-Black (TB) Model (See Chapter 6 for this model.)
If you are a fund manager you may try to analyze several companies. If a manager has the ability
to find undervalued stocks, what strategy should a portfolio manager use in investing in those
stocks? The percentage of funds allocated to undervalued stocks depends, in part, on the ability

Chapter 18 – Portfolio Performance Evaluation
Summary of measures and usage
Performance
Measure Definition Application
Sharpe p
R/ s
as the
When choosing
among portfolios
competing
optimal risky portfolio
Treynor Rp/
When ranking many
portfolios that will be
mixed to form the
optimal risky portfolio
Information
ratio p
/ se
When evaluating a
portfolio to be mixed
with a position in the
passive benchmark
portfolio
→
This edition of the text goes much further in explaining alpha and its relationship to other
performance measures.
= Correlation between RP & RM
A positive alpha does not guarantee a higher Sharpe than the benchmark because SM(r-1) < 0.
Thus a positive alpha is a necessary but not a sufficient condition for net performance
improvement.
A positive alpha does not guarantee a higher square of the information ratio because a higher
alpha may come with higher residual risk.
Alpha Capture & Transport
P
P
MMP )1(SSS s
+−=−
Chapter 18 – Portfolio Performance Evaluation
If an analyst finds an undervalued security and invests in it, market moves may still wipe out any
gains. Remember this is called fundamental risk. However, one can hedge out market risk via
shorting a stock index or stock index futures to establish a market neutral position. Recall that
ETFs can be shorted.
This should eliminate any systematic risk and leave the investor with the stock’s positive alpha.
The process to establish a zero beta or market neutral position is called alpha capture or alpha
transport.
When short positions and leverage are allowed a significant non-zero alpha is a sufficient
condition for an improvement in the Sharpe and information ratio. Because this hedge portfolio
establishes a zero beta portfolio, the Treynor measure is undefined. Note that the evidence
indicates that it is difficult to find positive alphas, although it may be easier to find negative
alphas.
Evidence indicates one should use a multi-index model such as the Fama-French model (FF)
(See Chapter 7) to establish the expected return:
Chapter 18 – Portfolio Performance Evaluation
2. Style Analysis
PPT 18-18 through PPT 18-22
In recent years style analysis has become popular with the investment industry. The initial work
3. Morningstar’s Risk-Adjusted Rating
PPT 18-23 through PPT 18-24
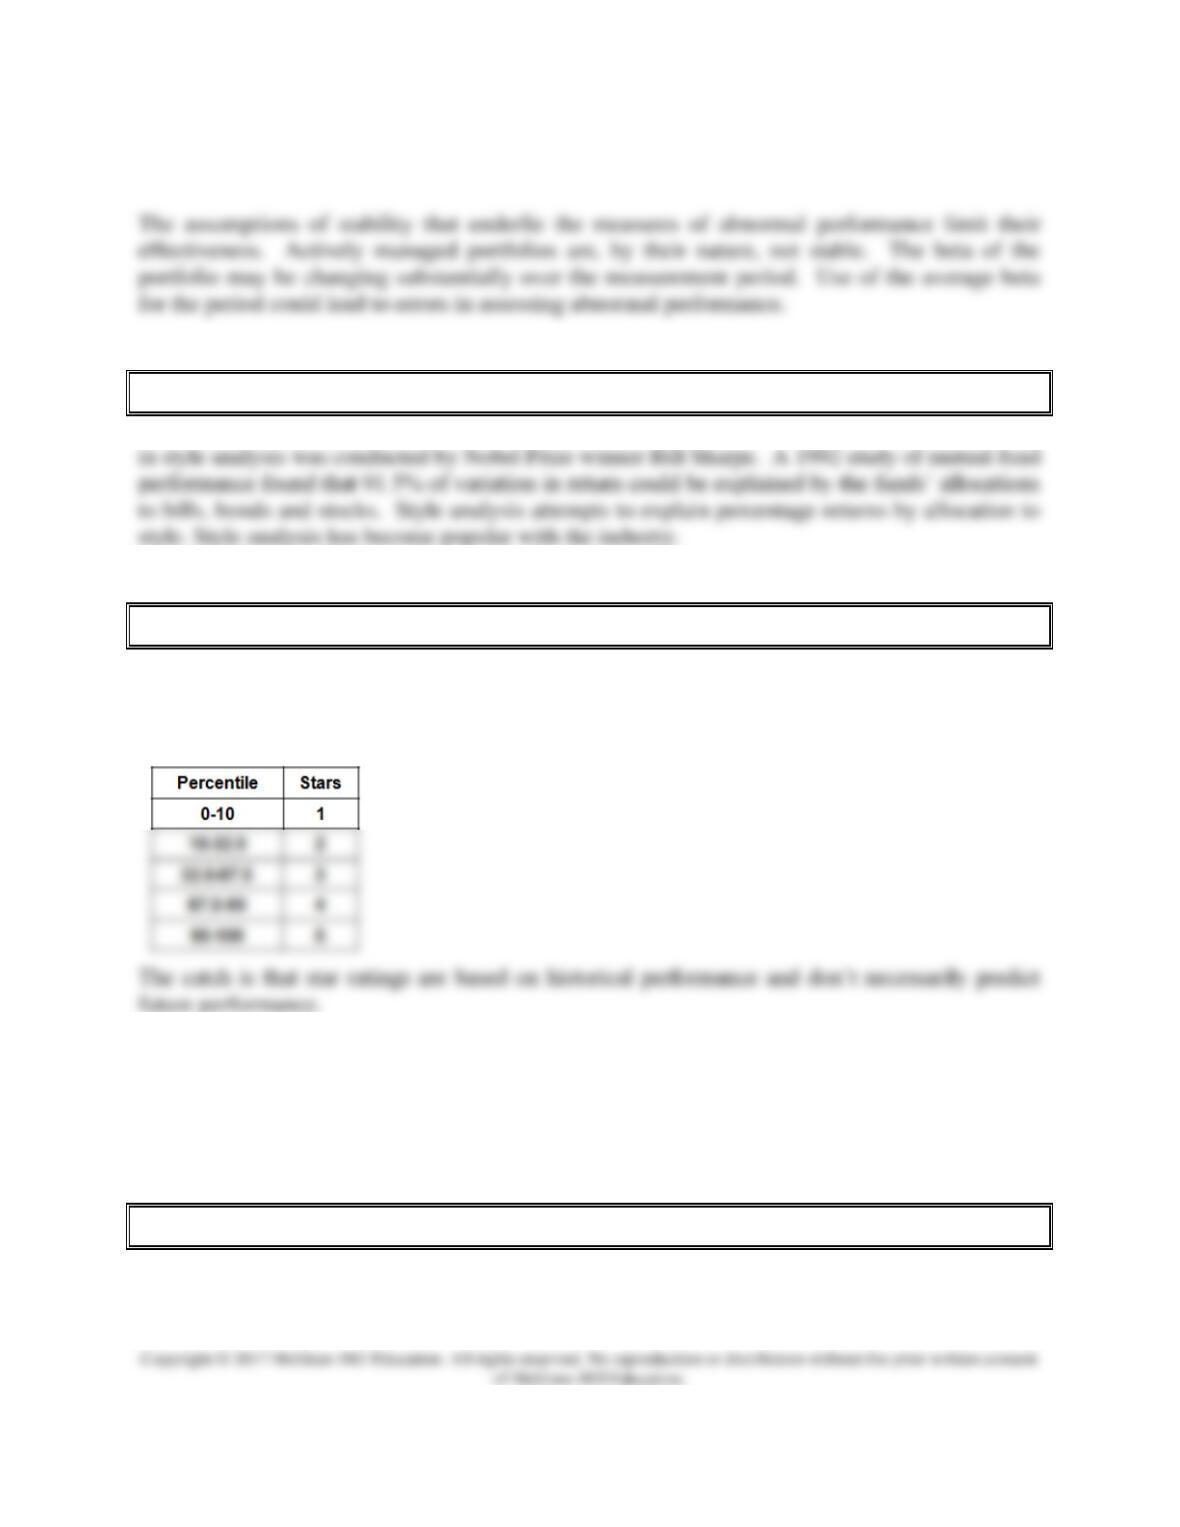
The Morning Star Rating System has also become very popular with the investment community.
The risk adjusted returns they report are very highly correlated with the Sharpe Ratio. The Star
System ranks funds within peer groups based on percentiles as follows:
4. Risk Adjustment with Changing Portfolio Composition
PPT 18-25 through PPT 18-26
Chapter 18 – Portfolio Performance Evaluation
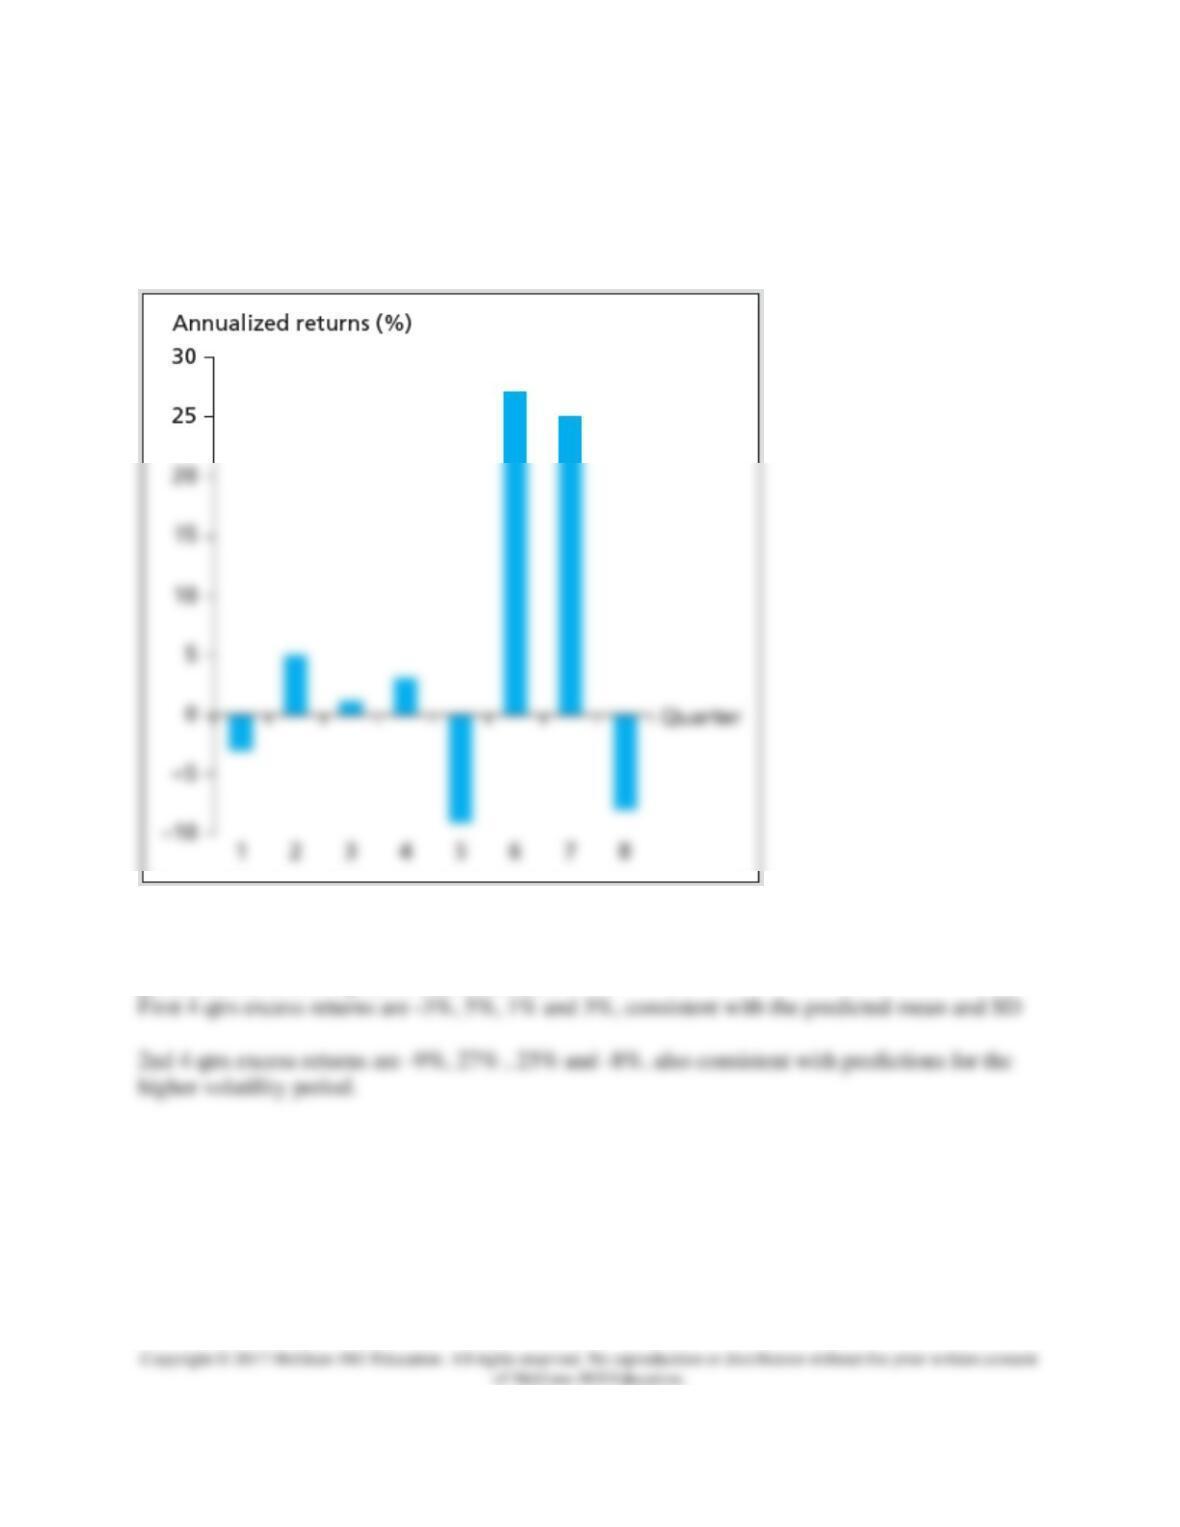
Performance measures assume a fund maintains a constant level of risk. This assumption is
violated for most funds and is particularly problematic for funds that engage in active asset
allocation. To see how this affects performance the text constructs a simple example that
students readily grasp and is reproduced here:
Suppose the Sharpe of the benchmark M = 0.4. We want to know if the active portfolio returns
depicted in the graph generated a superior Sharpe ratio. The fund used a low risk strategy for the
first four quarters and then switched to a high risk strategy for the final four quarters and
generated the following set of excess returns:
Chapter 18 – Portfolio Performance Evaluation
5. Performance Attribution Procedures
PPT 18-27 through PPT 18-31
Decomposing overall performance into components allows the analyst to determine what aspects
of portfolio choices contributed to good or bad performance.
Major performance determinants include the broad asset allocation among types of securities,
industry weighting in equity portfolio, security choice, and the timing of purchases and sales.
We would like to be able to ascertain the effects of these choices on portfolio performance.
The process begins with setting up a benchmark or ‘bogey’ portfolio. Indexes are used for each
component in the bogey and a target weight structure is applied to the bogey. The returns on the
‘bogey’ and on the managed portfolio are calculated. In the PPT example the “bogey” is a
benchmark portfolio comprised of three component indices for bonds, equity and cash. The
6. Market Timing
Chapter 18 – Portfolio Performance Evaluation
PPT 18-32 through PPT 18-36
If a portfolio manager could time general movements in the market, the performance would be
similar to a call option. When market returns are lower than money market instruments, the
manager would switch out of equities and into money markets. When stock returns will be
higher than money market instruments, all of the funds would be invested in stock. The result
would be higher returns and a smaller standard deviation. A graphical display of perfect market
timing is displayed in the PPT. With less than perfect timing ability, the problem of identifying a
superior market timer becomes a much more difficult task. A long horizon is needed to measure
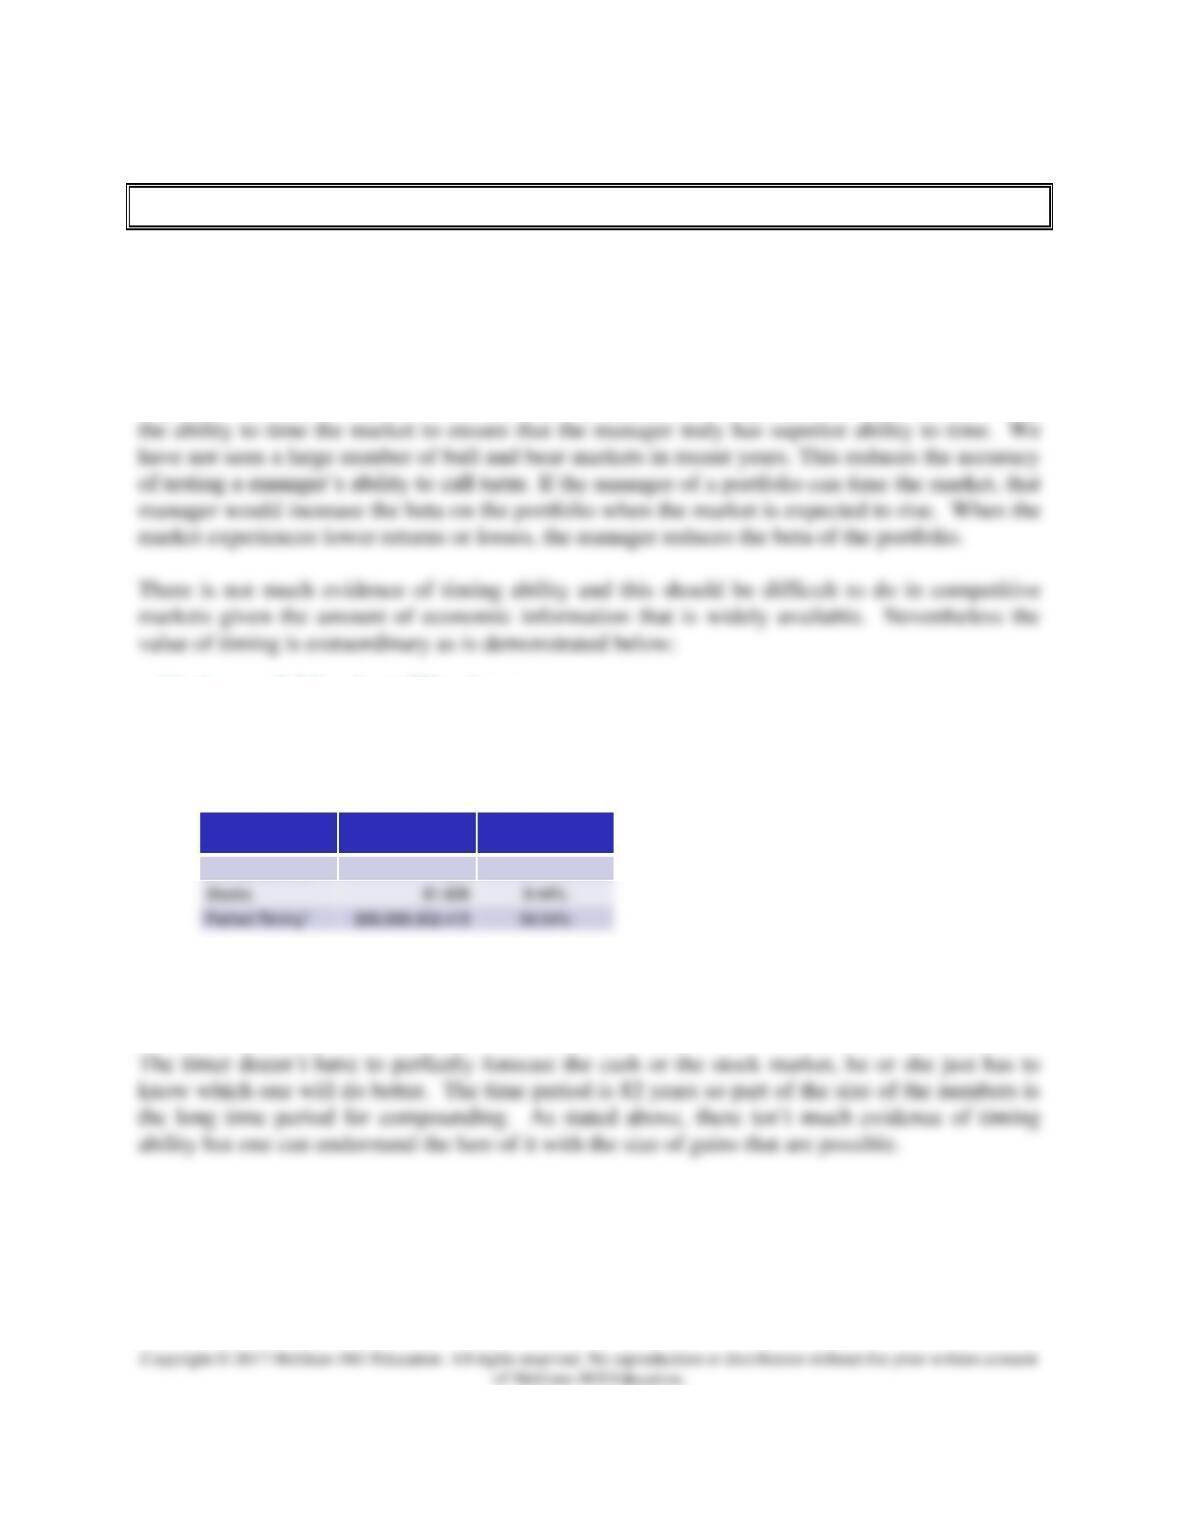
Value of Market Timing
Invest $1 on December 1, 1926
*Perfect Timing: Every month 100% of the funds are
placed in either stocks or cash based on which would
have the higher return.
Strategy Value in 2008 Geom Avg.
Return
Money Markets $20 3.71%
Excel Applications