Chapter 16 – Managing Bond Portfolios
16-1
CHAPTER 16: MANAGING BOND PORTFOLIOS
PROBLEM SETS
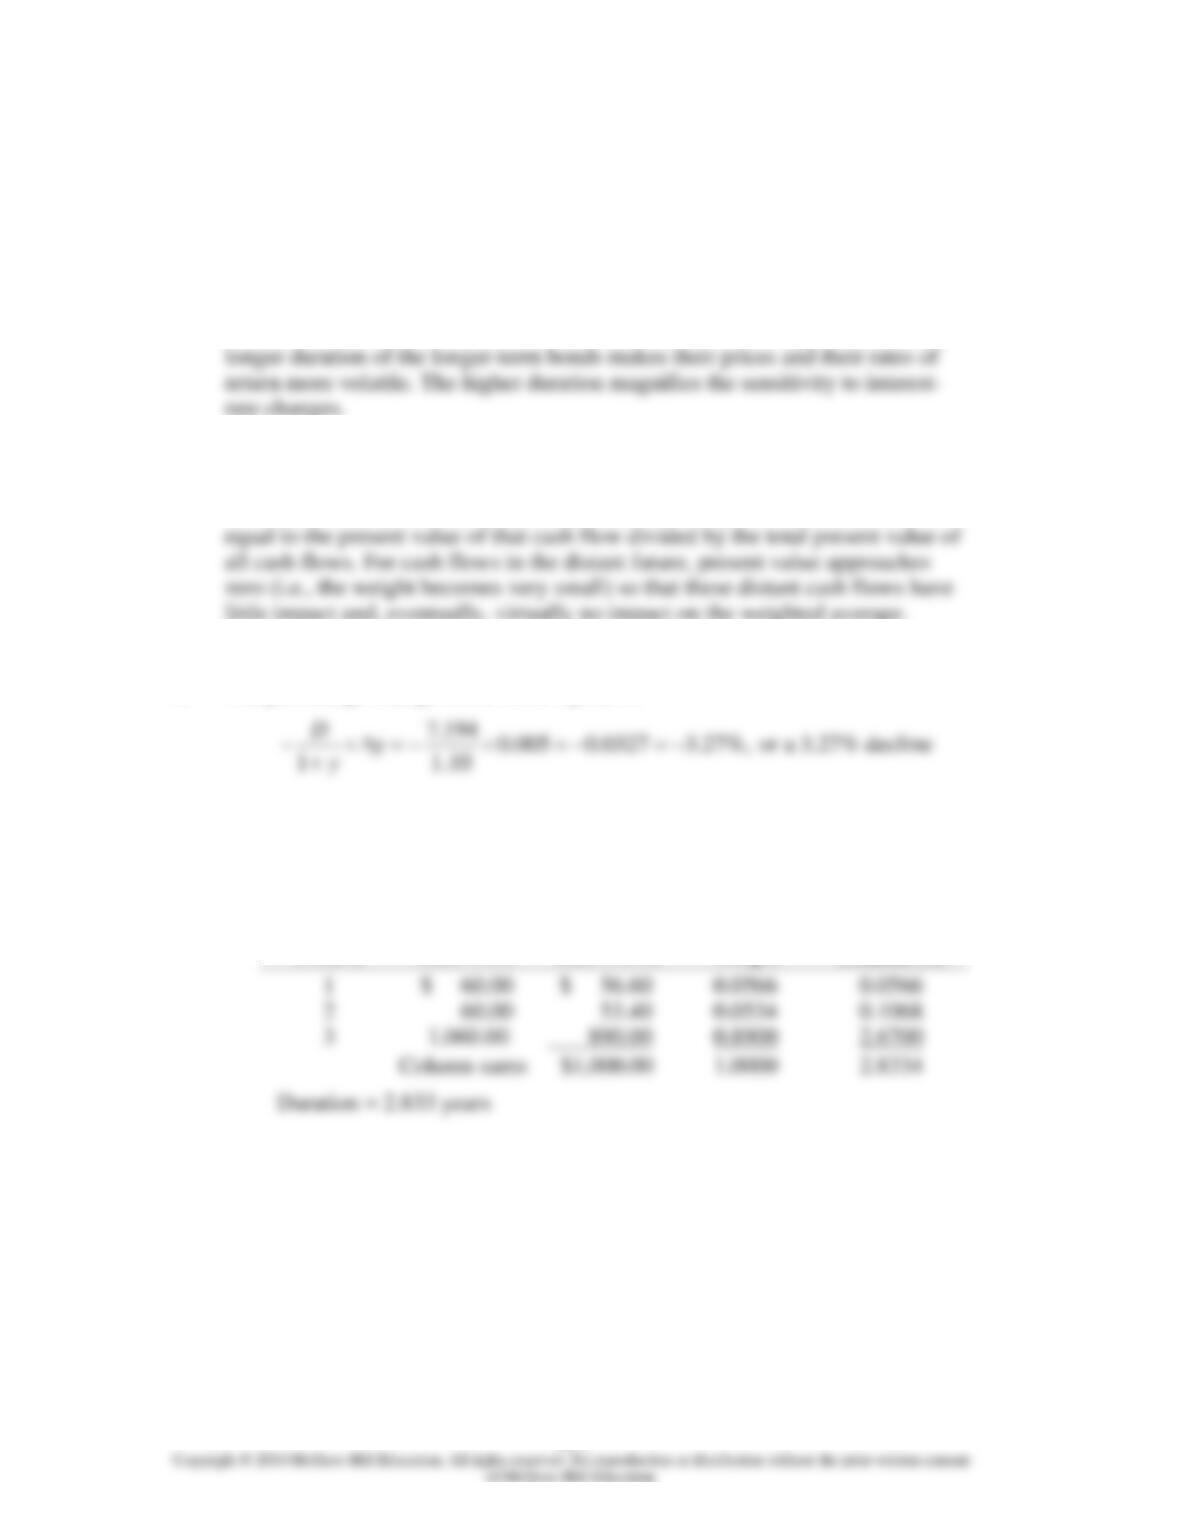
1. While it is true that short-term rates are more volatile than long-term rates, the
2. Duration can be thought of as a weighted average of the maturities of the cash
flows paid to holders of the perpetuity, where the weight for each cash flow is
3. The percentage change in the bond’s price is:
4. a. YTM = 6%
(1)
(2)
(3)
(4)
(5)
Time until
Payment
(Years)
Cash Flow
PV of CF
(Discount
Rate = 6%)
Weight
Column (1)
Column (4)
1
2
3
Chapter 16 – Managing Bond Portfolios
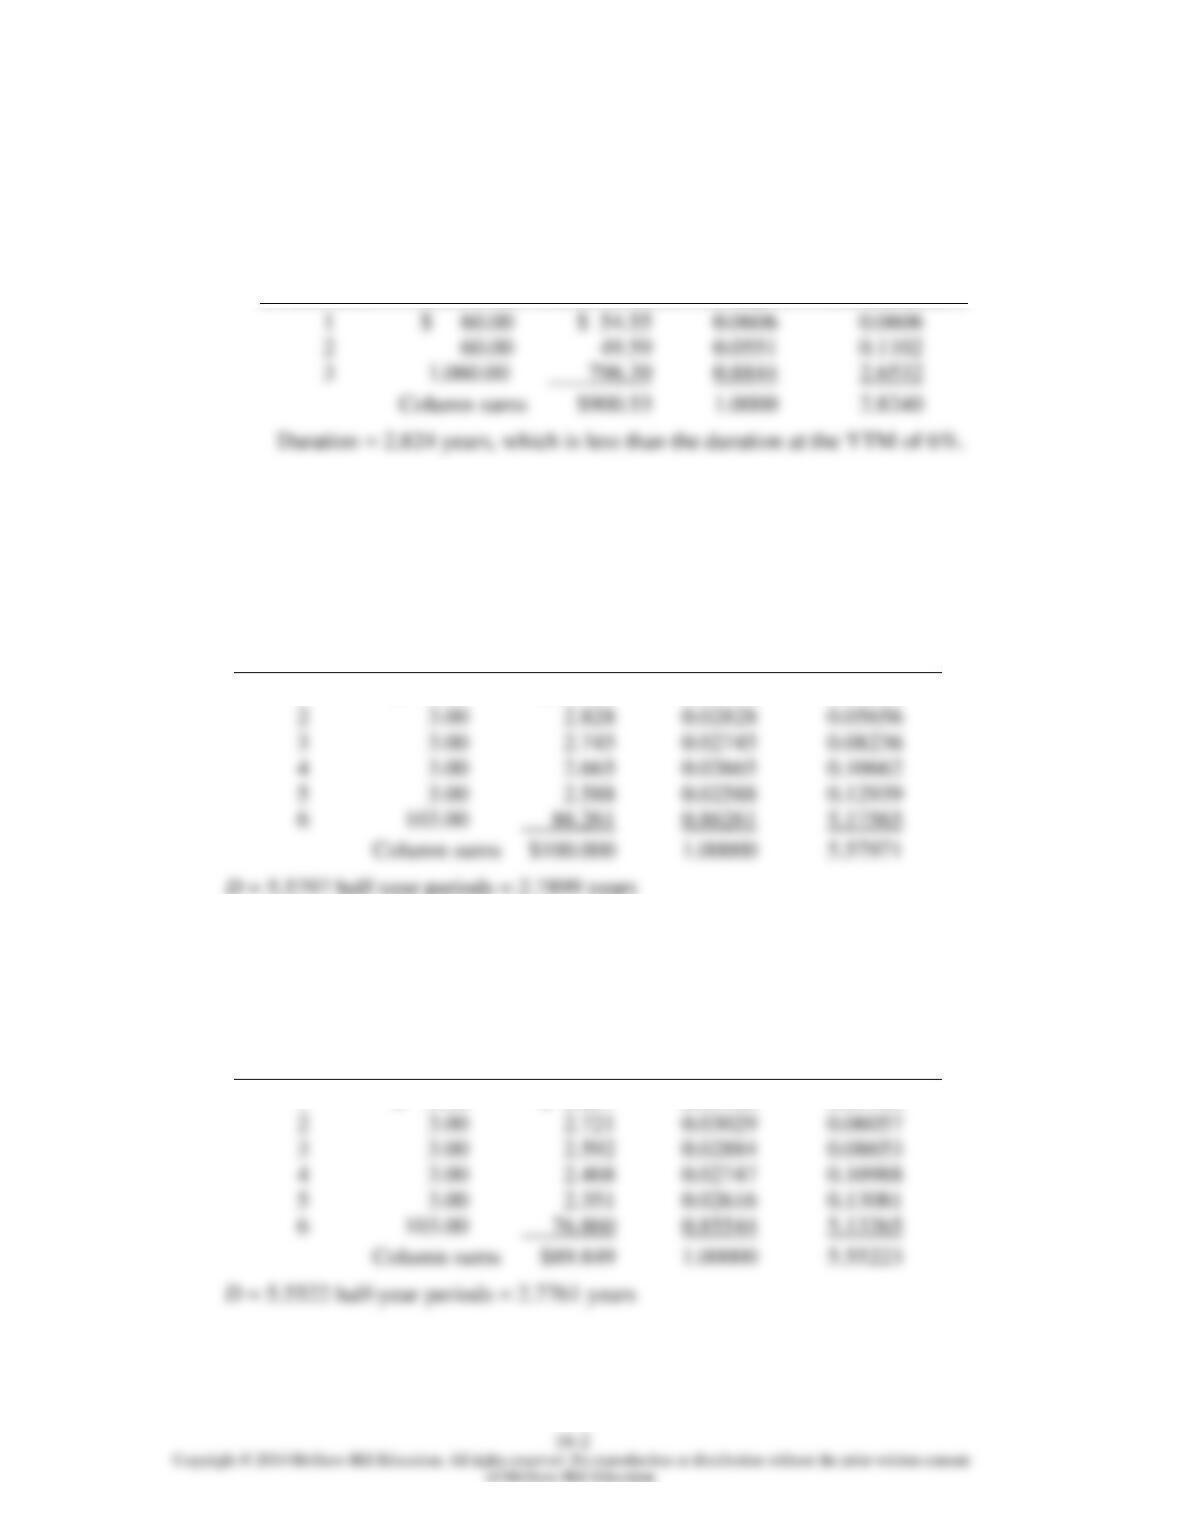
b. YTM = 10%
(1)
(2)
(3)
(4)
(5)
Time until
Payment
(Years)
Cash Flow
PV of CF
(Discount
Rate = 10%)
Weight
Column (1)
Column (4)
1
$ 60.00
$ 54.55
0.0606
2
60.00
49.59
0.0551
3
796.39
0.8844
$900.53
1.0000
5. For a semiannual 6% coupon bond selling at par, we use the following parameters:
coupon = 3% per half-year period, y = 3%, T = 6 semiannual periods.
(1)
(2)
(3)
(4)
(5)
Time until
Payment
(Years)
Cash Flow
PV of CF
(Discount
Rate = 3%)
Weight
Column (1)
Column (4)
1
$ 3.00
$ 2.913
0.02913
0.02913
2
3.00
2.828
0.02828
0.05656
3
3.00
2.745
0.02745
0.08236
4
3.00
2.665
0.02665
0.10662
5
3.00
2.588
0.02588
0.12939
6
103.00
86.261
0.86261
5.17565
$100.000
1.00000
5.57971
D = 5.5797 half-year periods = 2.7899 years
If the bond’s yield is 10%, use a semiannual yield of 5% and semiannual
coupon of 3%:
(1)
(2)
(3)
(4)
(5)
Time until
Payment
(Years)
Cash Flow
PV of CF
(Discount
Rate = 5%)
Weight
Column (1)
Column (4)
1
$ 3.00
$ 2.857
0.03180
0.03180
2
3.00
2.721
0.03029
0.06057
3
3.00
2.592
0.02884
0.08653
4
3.00
2.468
0.02747
0.10988
5
3.00
2.351
0.02616
0.13081
6
103.00
76.860
0.85544
5.13265
$89.849
1.00000
5.55223
Chapter 16 – Managing Bond Portfolios
16-3
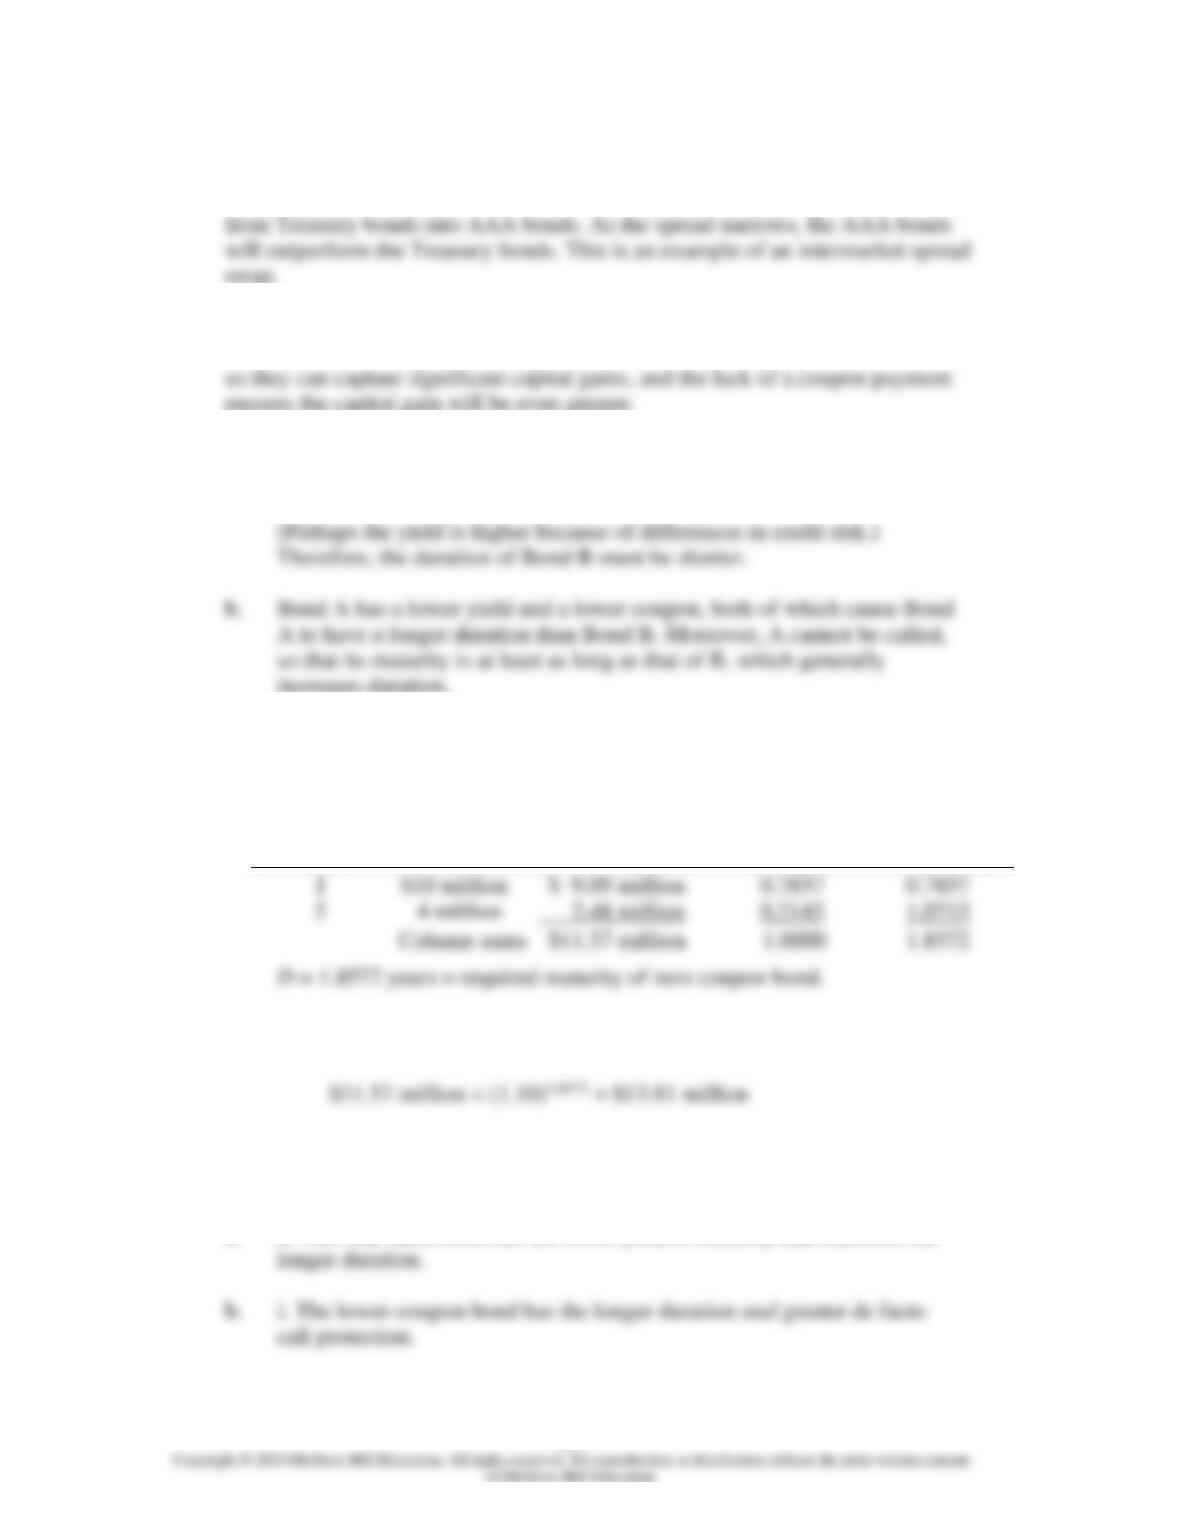
6. If the current yield spread between AAA bonds and Treasury bonds is too wide
compared to historical yield spreads and is expected to narrow, you should shift
7. D. Investors tend to purchase longer term bonds when they expect yields to fall
8. a. Bond B has a higher yield to maturity than bond A since its coupon
payments and maturity are equal to those of A, while its price is lower.
9. a.
(1)
(2)
(3)
(4)
(5)
Time until
Payment
(Years)
Cash Flow
PV of CF
(Discount Rate =
10%)
Weight
Column (1)
Column (4)
1
5
b. The market value of the zero must be $11.57 million, the same as the
market value of the obligations. Therefore, the face value must be:
10 In each case, choose the longer-duration bond in order to benefit from a
rate decrease.
a. ii. The Aaa-rated bond has the lower yield to maturity and therefore the
Chapter 16 – Managing Bond Portfolios
16-4
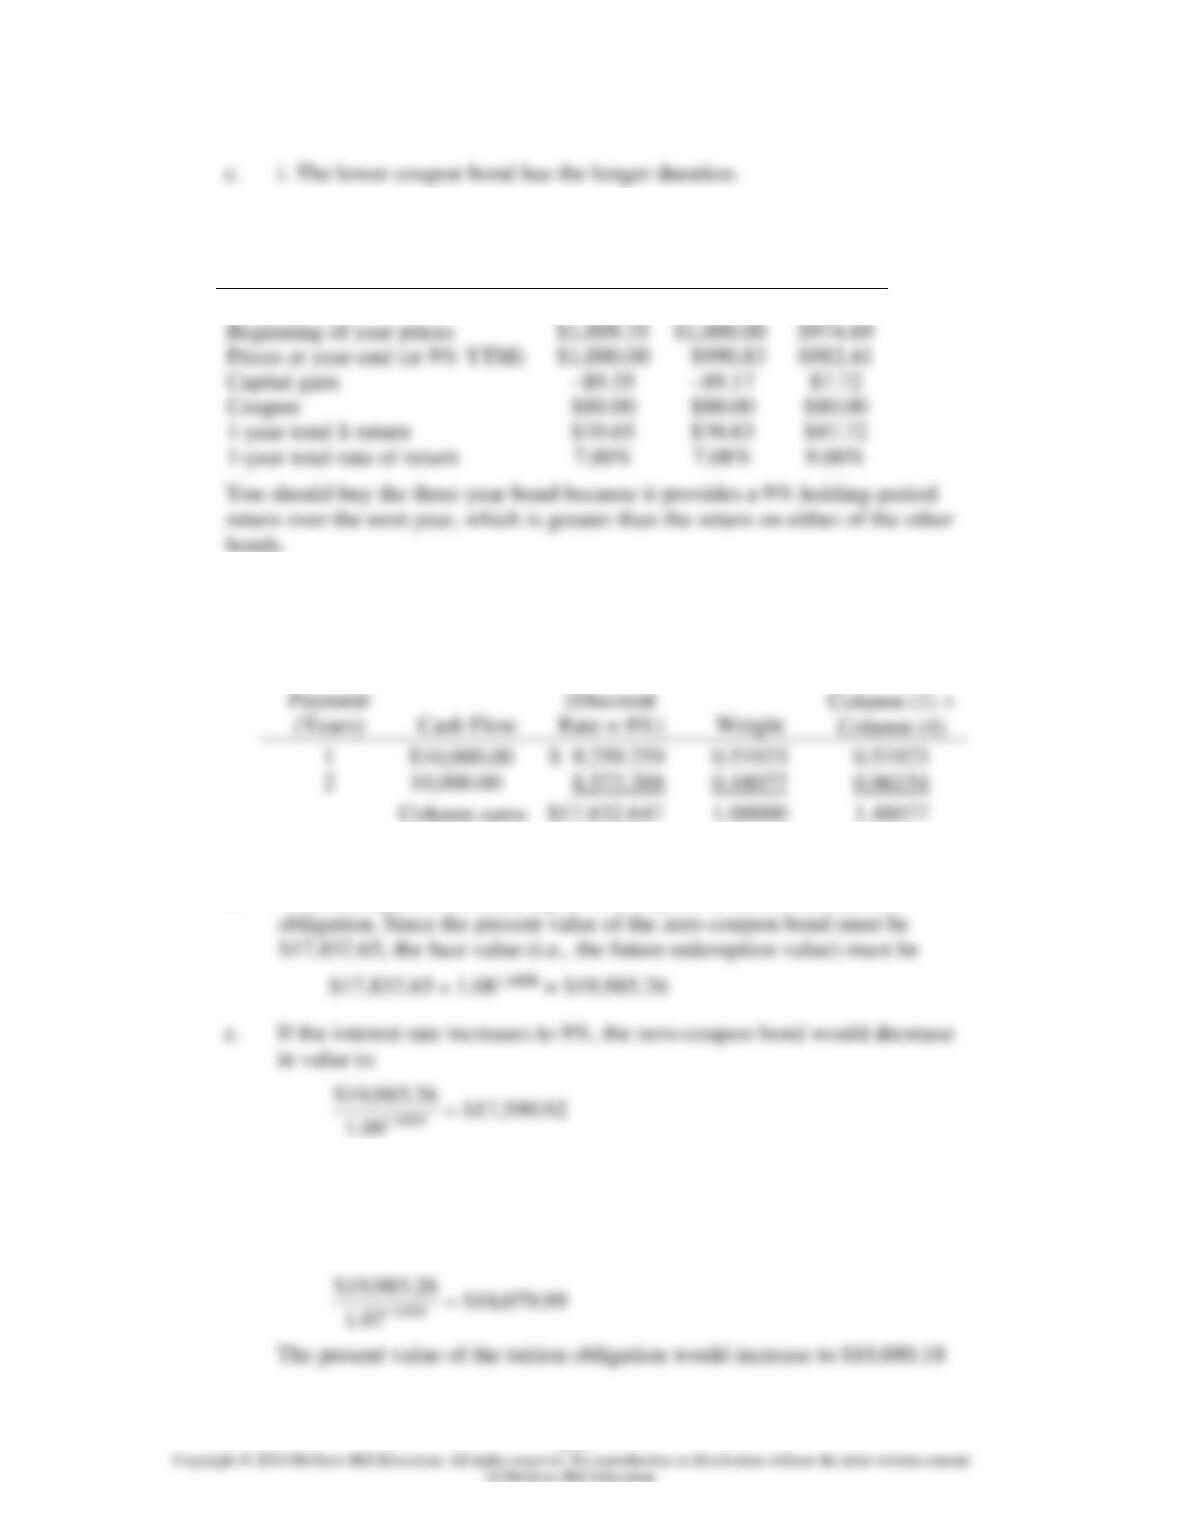
11. The table below shows the holding period returns for each of the three bonds:
Maturity
1 Year
2 Years
3 Years
YTM at beginning of year
7.00%
8.00%
9.00%
12. a. PV of the obligation = $10,000 Annuity factor (8%, 2) = $17,832.65
(1)
(2)
(3)
(4)
(5)
1
$10,000.00
2
10,000.00
$17,832.647
Time until
PV of CF
D = 1.4808 years
b. A zero-coupon bond maturing in 1.4808 years would immunize the
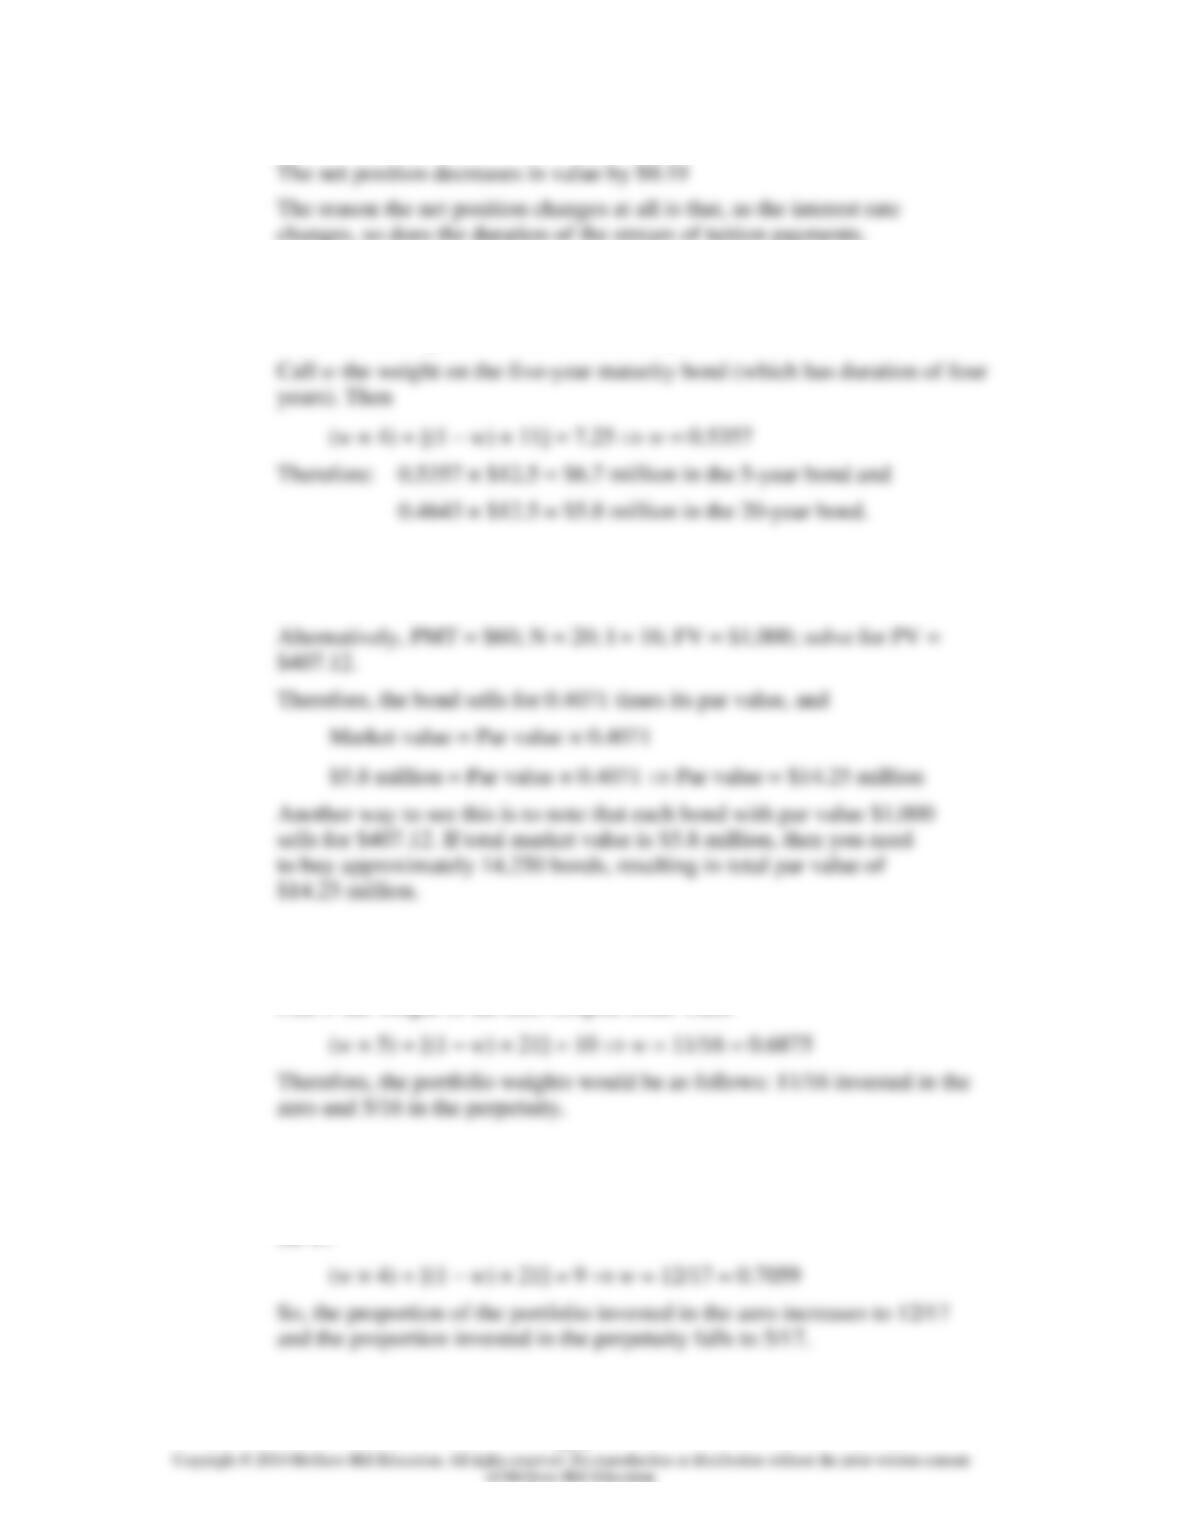
The present value of the tuition obligation would decrease to $17,591.11
The net position decreases in value by $0.19
If the interest rate decreases to 7%, the zero-coupon bond would increase
in value to
Chapter 16 – Managing Bond Portfolios
16-5
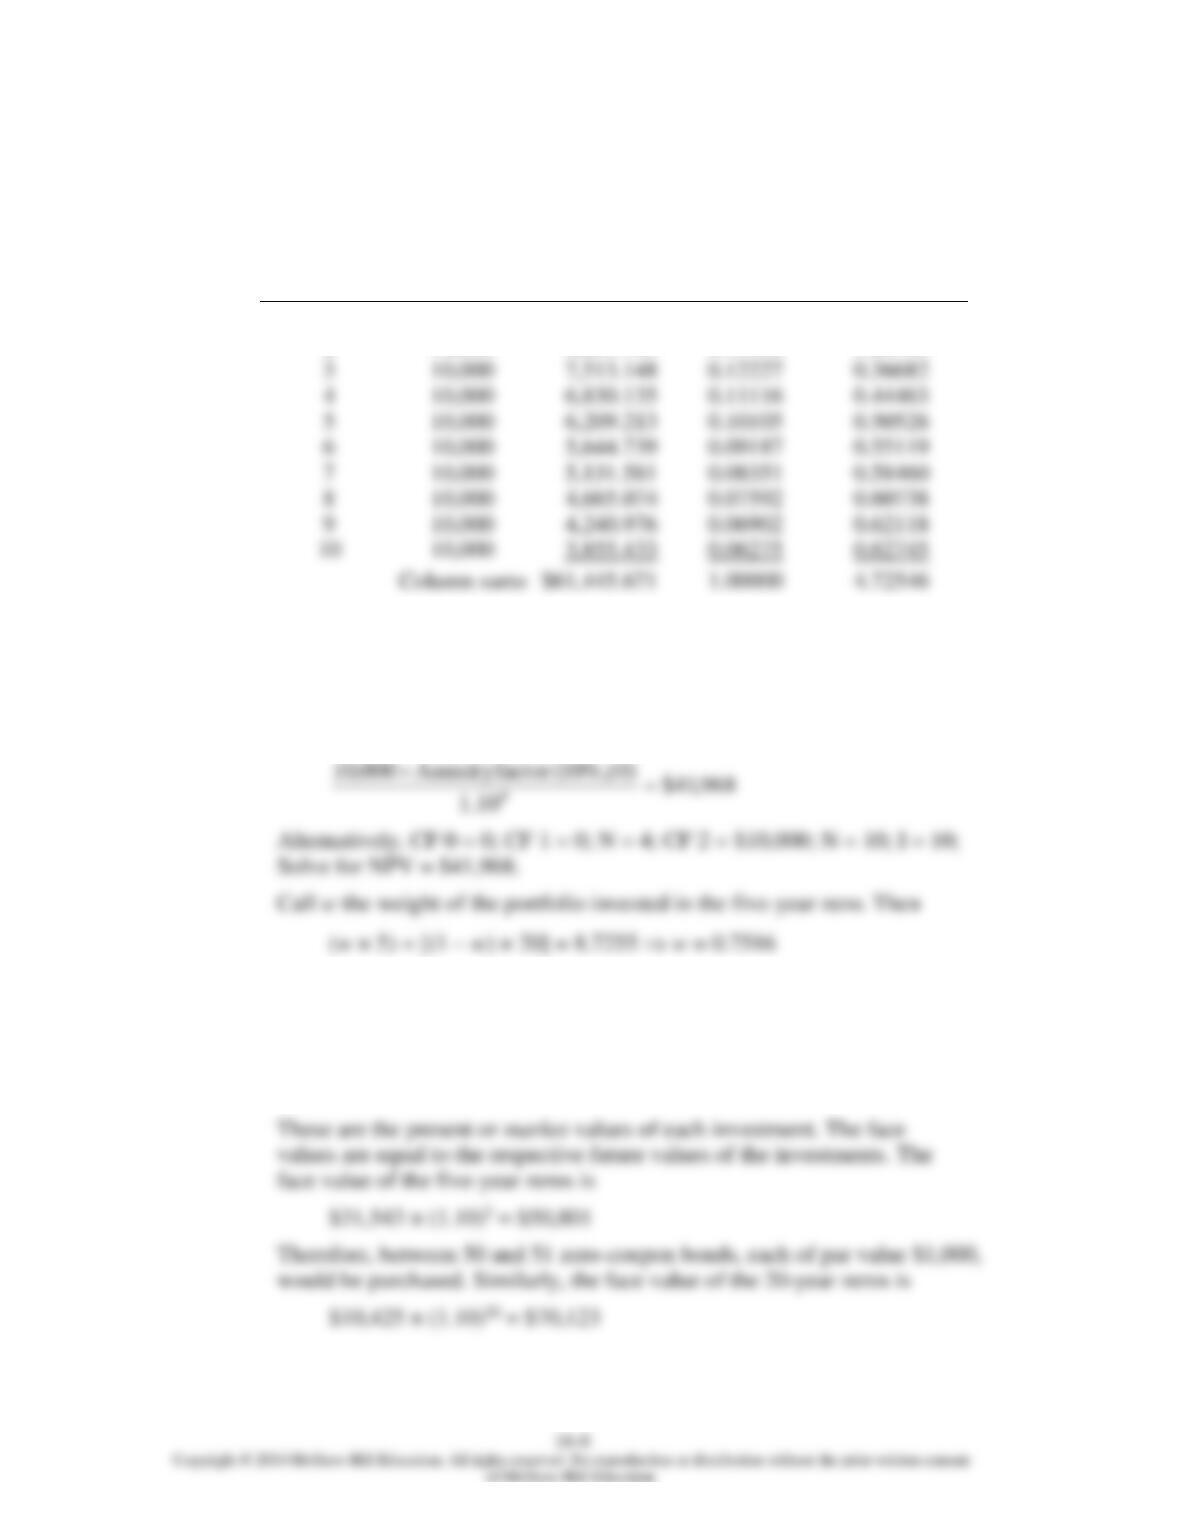
13. a. PV of obligation = $2 million/0.16 = $12.5 million
Duration of obligation = 1.16/0.16 = 7.25 years
b. The price of the 20-year bond is
[$60 × Annuity factor (16%, 20)] + [$1,000 × PV factor (16%, 20)] = $407.12
14. a. The duration of the perpetuity is: 1.05/0.05 = 21 years
Call w the weight of the zero-coupon bond. Then
b. Next year, the zero-coupon bond will have a duration of 4 years and the
perpetuity will still have a 21-year duration. To obtain the target duration
of nine years, which is now the duration of the obligation, we again solve
for w:
Chapter 16 – Managing Bond Portfolios
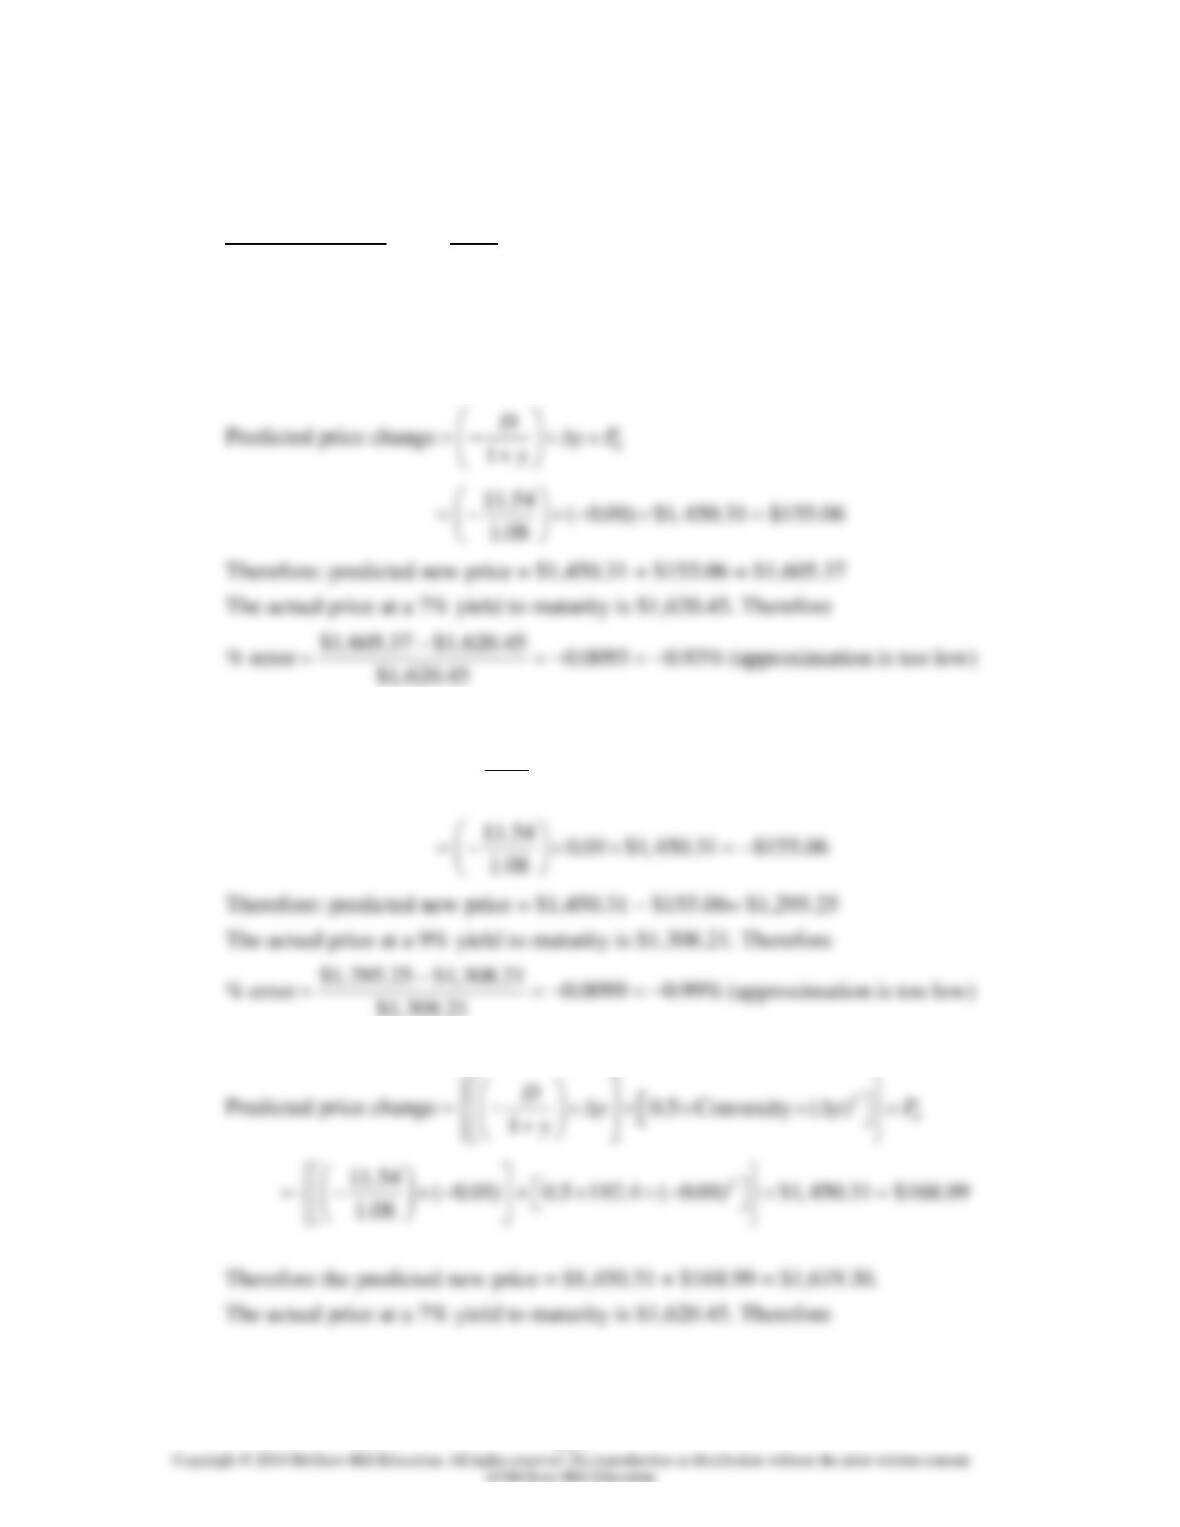
15. a. The duration of the annuity if it were to start in one year would be
(1)
(2)
(3)
(4)
(5)
Time until
Payment
(Years)
Cash Flow
PV of CF
(Discount
Rate = 10%)
Weight
Column (1) ×
Column (4)
1
$10,000
$ 9,090.909
0.14795
0.14795
2
10,000
8,264.463
0.13450
0.26900
3
10,000
7,513.148
0.12227
0.36682
4
10,000
6,830.135
0.11116
0.44463
5
10,000
6,209.213
0.10105
0.50526
6
10,000
5,644.739
0.09187
0.55119
8
10,000
4,665.074
0.07592
0.60738
9
10,000
4,240.976
0.06902
0.62118
10,000
3,855.433
0.06275
0.62745
$61,445.671
1.00000
4.72546
D = 4.7255 years
Because the payment stream starts in five years, instead of one year, we
add four years to the duration, so the duration is 8.7255 years.
b. The present value of the deferred annuity is
The investment in the five-year zero is equal to
0.7516 × $41,968 = $31,543
The investment in the 20-year zeros is equal to
0.2484 × $41,968 = $10,423
Chapter 16 – Managing Bond Portfolios
16-7
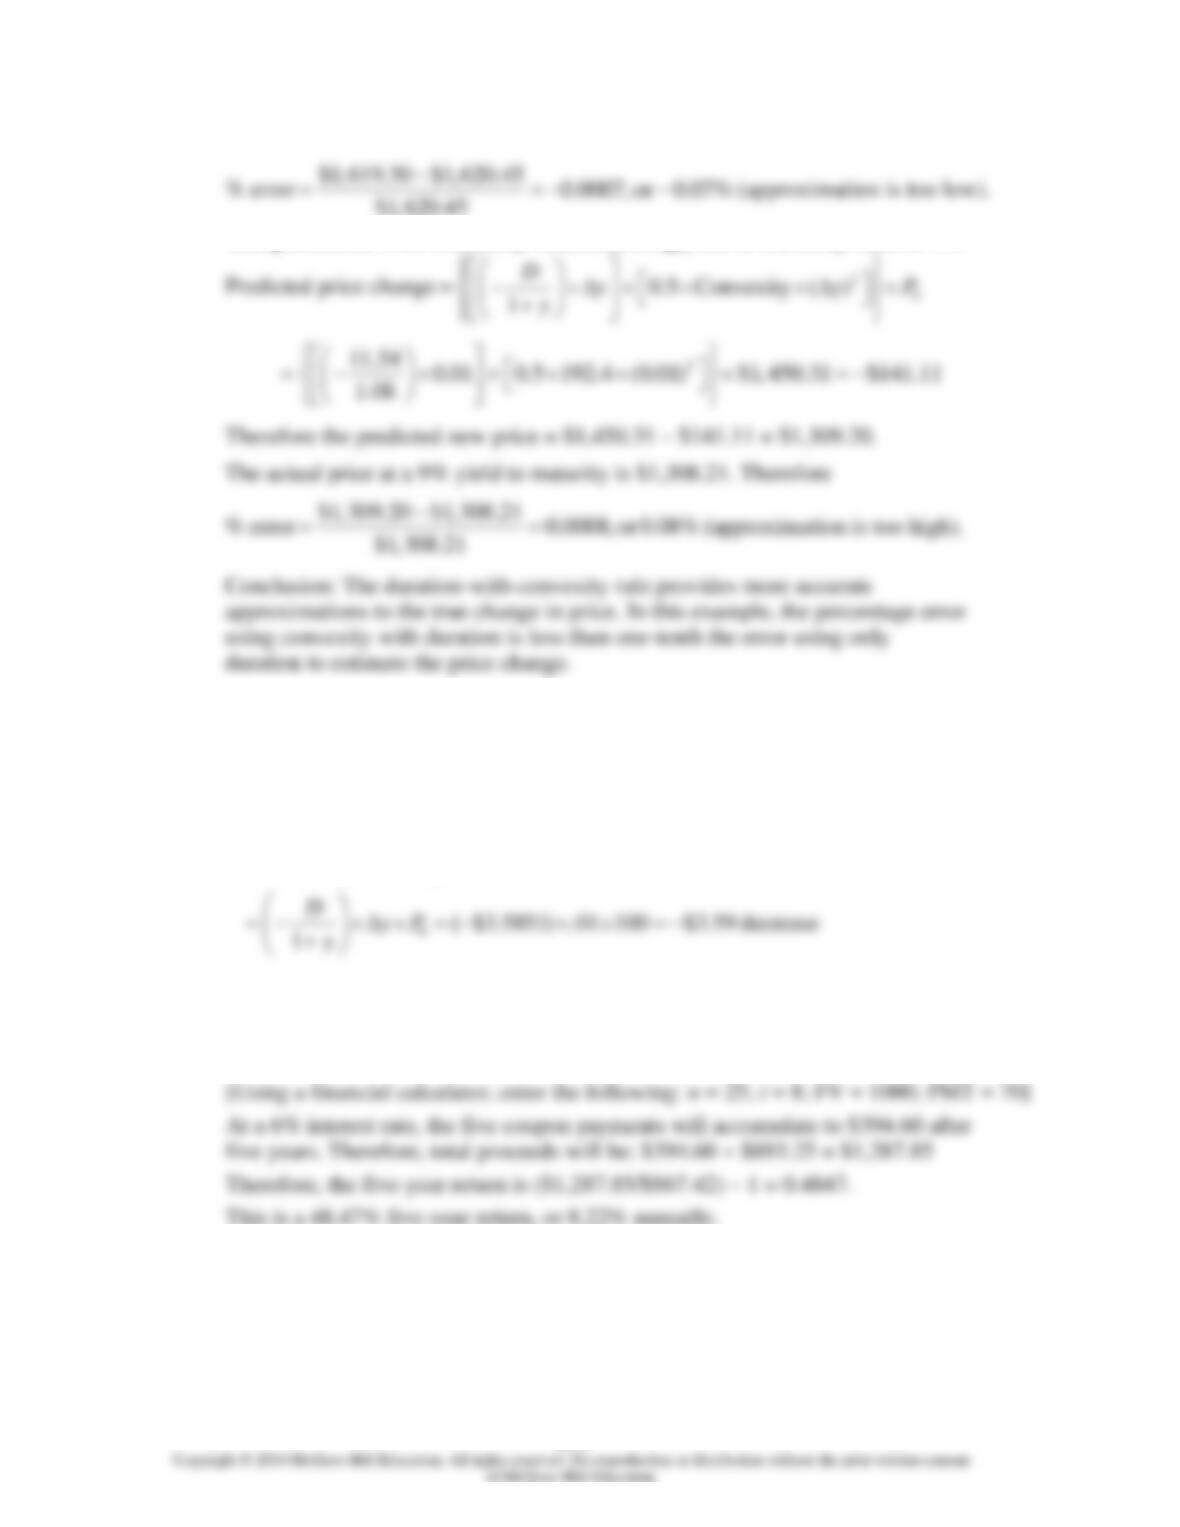
16. Using a financial calculator, we find that the actual price of the bond as a
function of yield to maturity is
Yield to Maturity Price
7% $1,620.45
8 1,450.31
9 1,308.21
(N = 30; PMT = $120; FV = $1,000, I = 7, 8, and 9; Solve for PV)
Using the duration rule, assuming yield to maturity falls to 7%
0
= −
+
Using the duration rule, assuming yield to maturity increases to 9%
Predicted price change
0
1
DyP
y
= −
+
Using duration-with-convexity rule, assuming yield to maturity falls to 7%
Chapter 16 – Managing Bond Portfolios
16-8
Using duration-with-convexity rule, assuming yield to maturity rises to 9%
17. Shortening his portfolio duration makes the value of the portfolio less sensitive
relative to interest rate changes. So if interest rates increase the value of the
portfolio will decrease less.
18. Predicted price change:
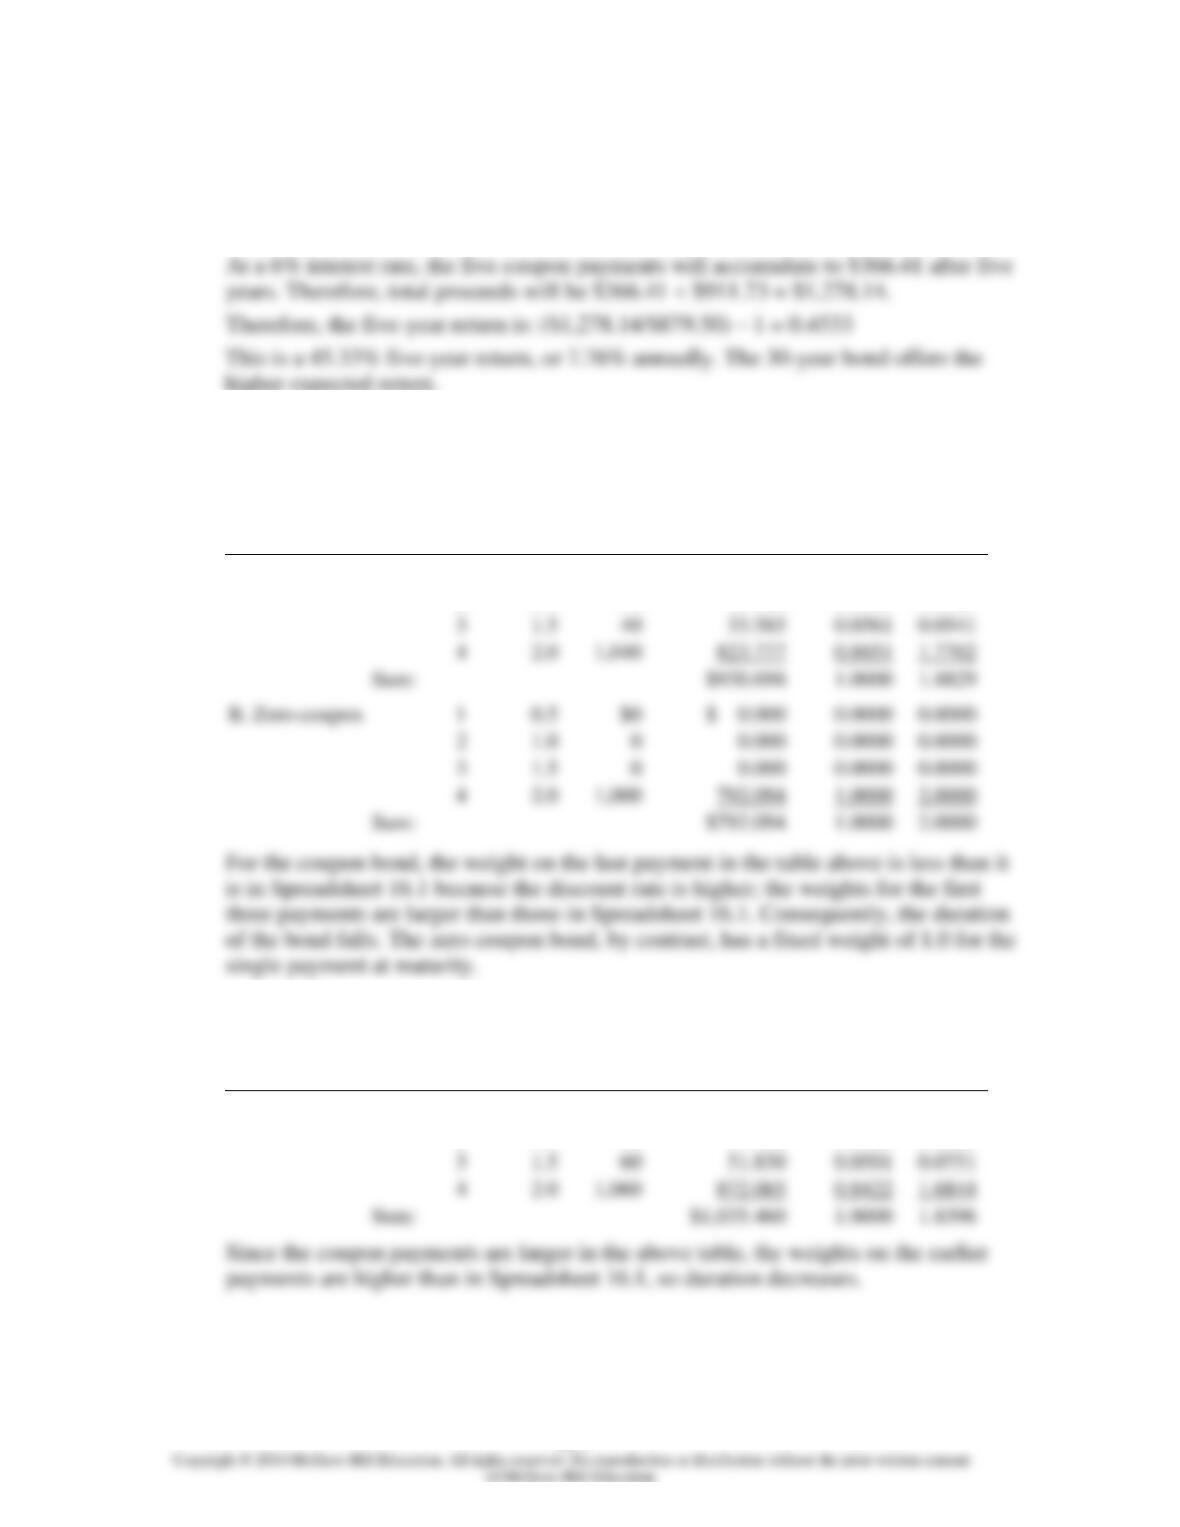
19. The maturity of the 30-year bond will fall to 25 years, and its yield is forecast to
be 8%. Therefore, the price forecast for the bond is $893.25
Chapter 16 – Managing Bond Portfolios
16-9
The maturity of the 20-year bond will fall to 15 years, and its yield is forecast to be
7.5%. Therefore, the price forecast for the bond is $911.73.
[Using a financial calculator, enter the following: n = 15; i = 7.5; FV = 1000; PMT = 65]
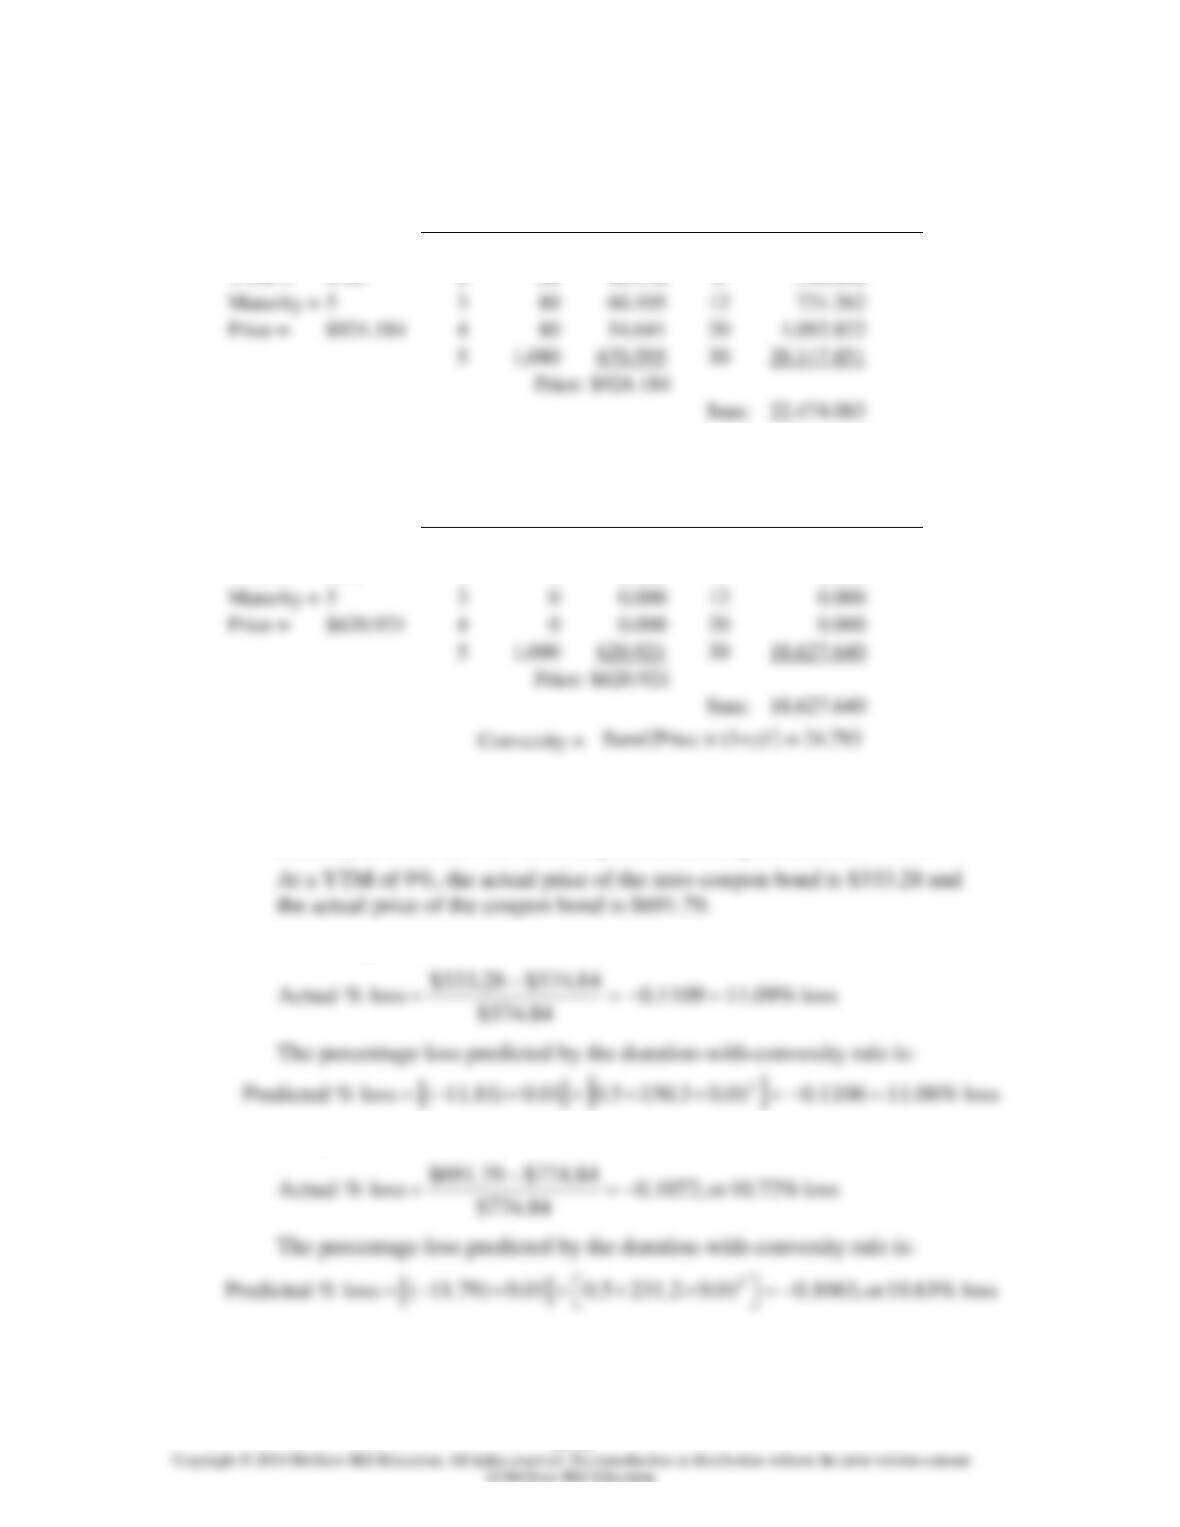
20.
a.
Period
Time
until
Payment
(Years)
Cash
Flow
PV of CF
Discount Rate =
6% per Period
Weight
Years ×
Weight
A. 8% coupon bond
1
0.5
$ 40
$ 37.736
0.0405
0.0203
2
1.0
40
35.600
0.0383
0.0383
3
1.5
40
33.585
0.0361
0.0541
4
2.0
1,040
0.8851
1.7702
$930.698
1.0000
1.8829
b.
Period
Time
until
Payment
(Years)
Cash
Flow
PV of CF
Discount Rate =
5% per Period
Weight
Years ×
Weight
A. 8% coupon bond
1
0.5
$ 60
$ 57.143
0.0552
0.0276
2
1.0
60
54.422
0.0526
0.0526
3
1.5
60
51.830
0.0501
0.0751
4
2.0
1,060
0.8422
1.6844
1.0000
1.8396
Chapter 16 – Managing Bond Portfolios
16–10
21.
a.
Time
(t)
Cash
Flow
PV(CF)
t + t2
(t + t2) × PV(CF)
Coupon =
$80
1
$ 80
$ 72.727
2
145.455
YTM =
0.10
2
80
66.116
6
396.694
Maturity =
5
3
80
Price =
$924.184
4
80
5
1,080
$924.184
Convexity =
Sum/[Price × (1+y)2] = 20.097
b.
Time
(t)
Cash
Flow
PV(CF)
t2 + t
(t2 + t) × PV(CF)
Coupon =
$0
1
$ 0
$ 0.000
2
0.000
YTM =
0.10
2
0
0.000
6
0.000
Maturity =
5
3
0
0.000
0.000
Price =
$620.921
4
0
0.000
0.000
5
1,000
$620.921
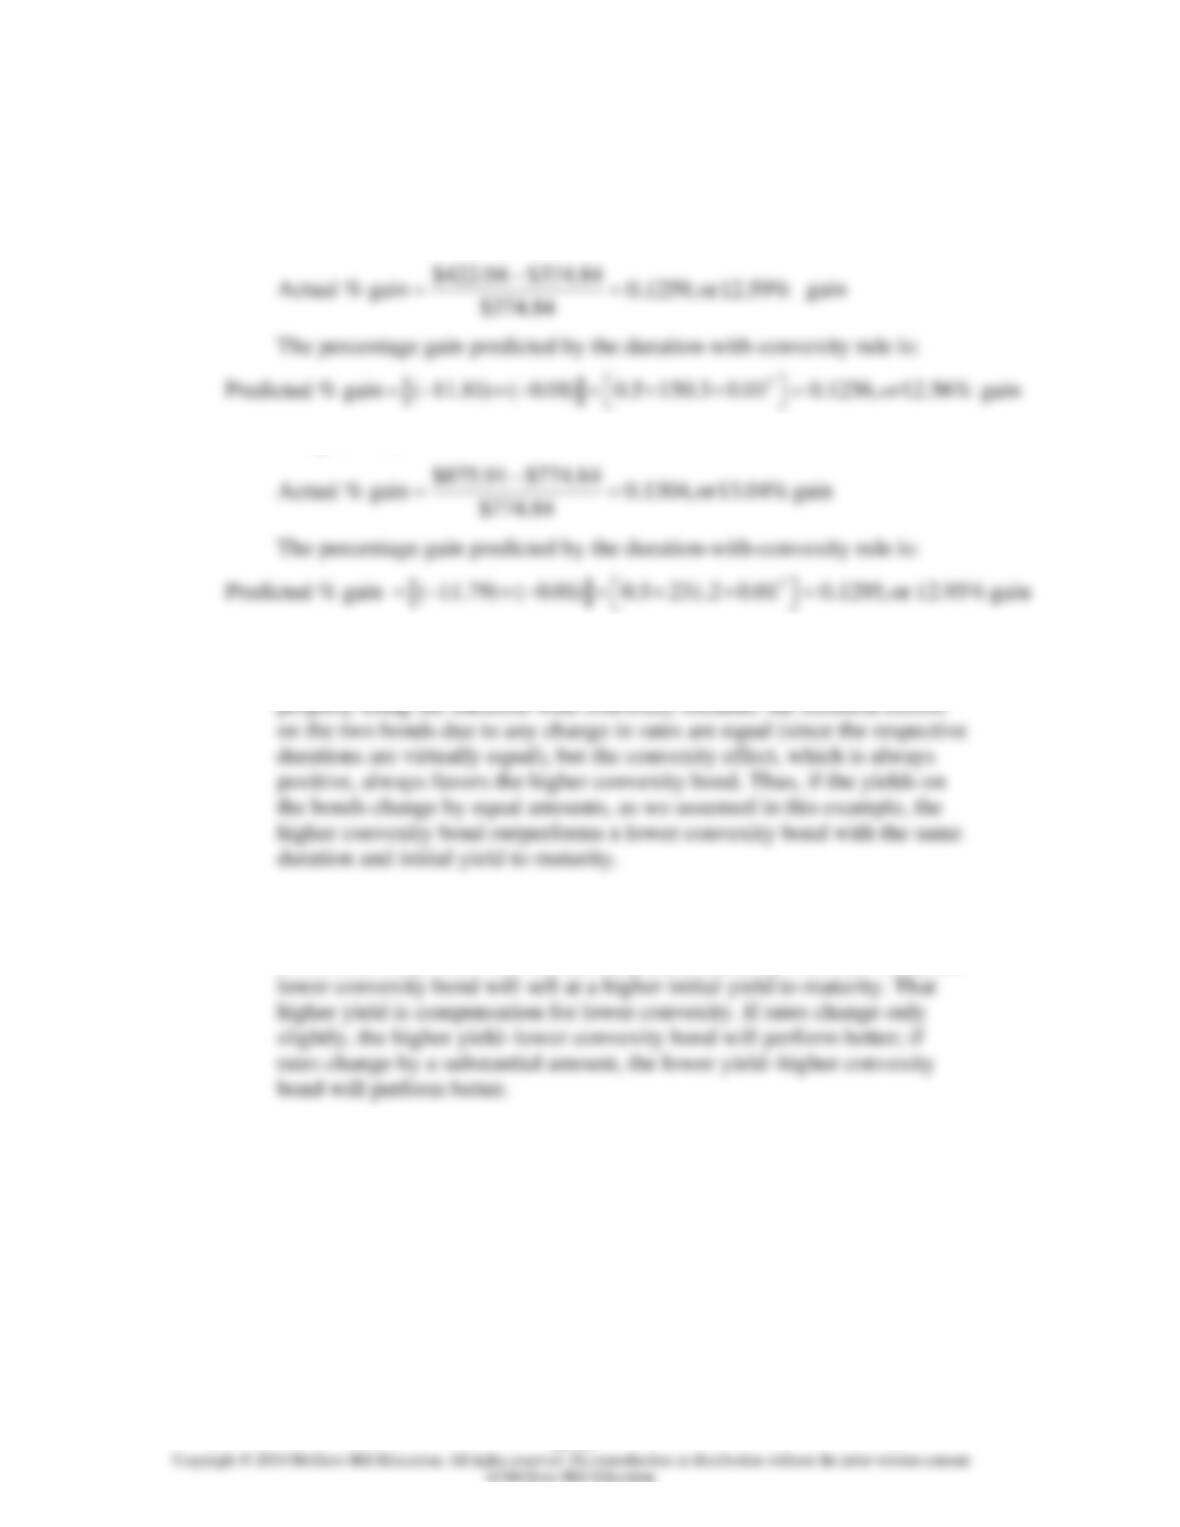
22. a. The price of the zero-coupon bond ($1,000 face value) selling at a yield to
maturity of 8% is $374.84 and the price of the coupon bond is $774.84.
Zero-coupon bond:
Coupon bond:
Chapter 16 – Managing Bond Portfolios
16–11
b. Now assume yield to maturity falls to 7%. The price of the zero increases
to $422.04, and the price of the coupon bond increases to $875.91.
Zero-coupon bond:
Coupon bond:
c. The 6% coupon bond, which has higher convexity, outperforms the zero
regardless of whether rates rise or fall. This can be seen to be a general
d. This situation cannot persist. No one would be willing to buy the lower
convexity bond if it always underperforms the other bond. The price of the
lower convexity bond will fall and its yield to maturity will rise. Thus, the