Unlock document.
This document is partially blurred.
Unlock all pages and 1 million more documents.
Get Access
Chapter 15 - Options Markets
CHAPTER 15
OPTIONS MARKETS
1. Options provide numerous opportunities to modify the risk profile of a portfolio. The
simplest example of an option strategy that increases risk is investing in an ‘all options’
portfolio of at-the-money options (as illustrated in the text). The leverage provided by
2. Options at the money have the highest time premium and thus the highest potential for
gain. Since the highest potential gain is at the money, the logical conclusion is that they
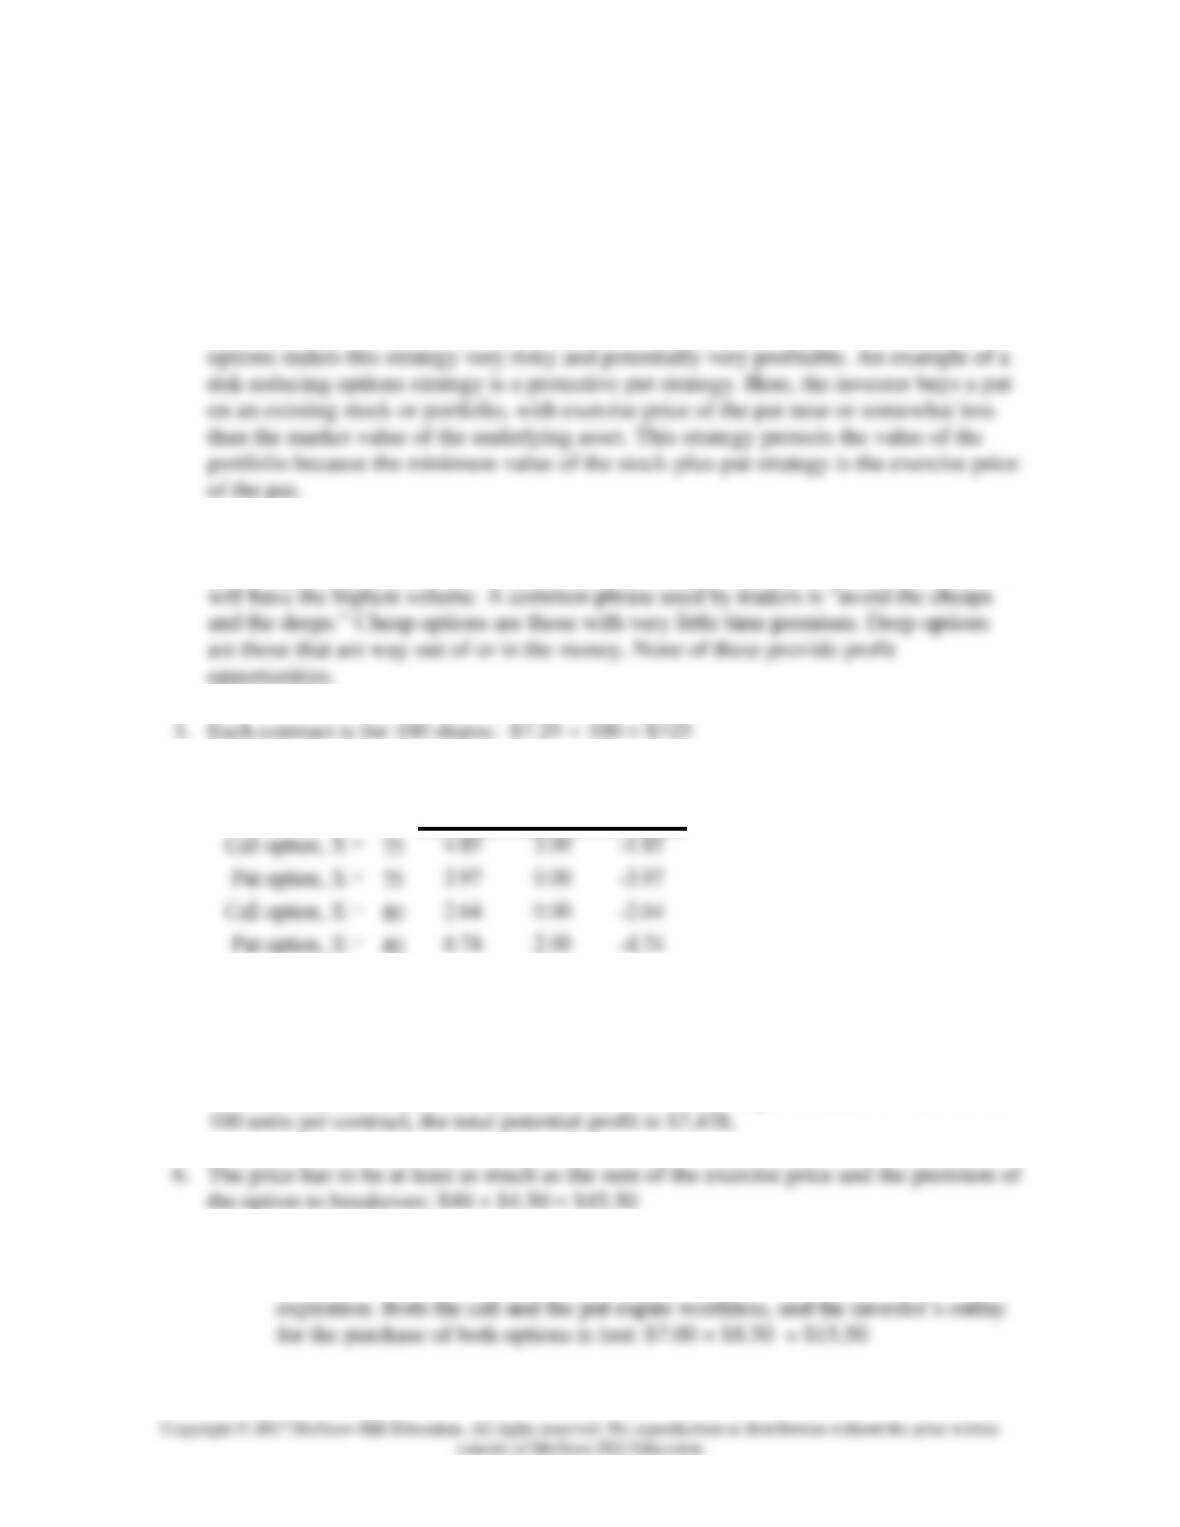
4.
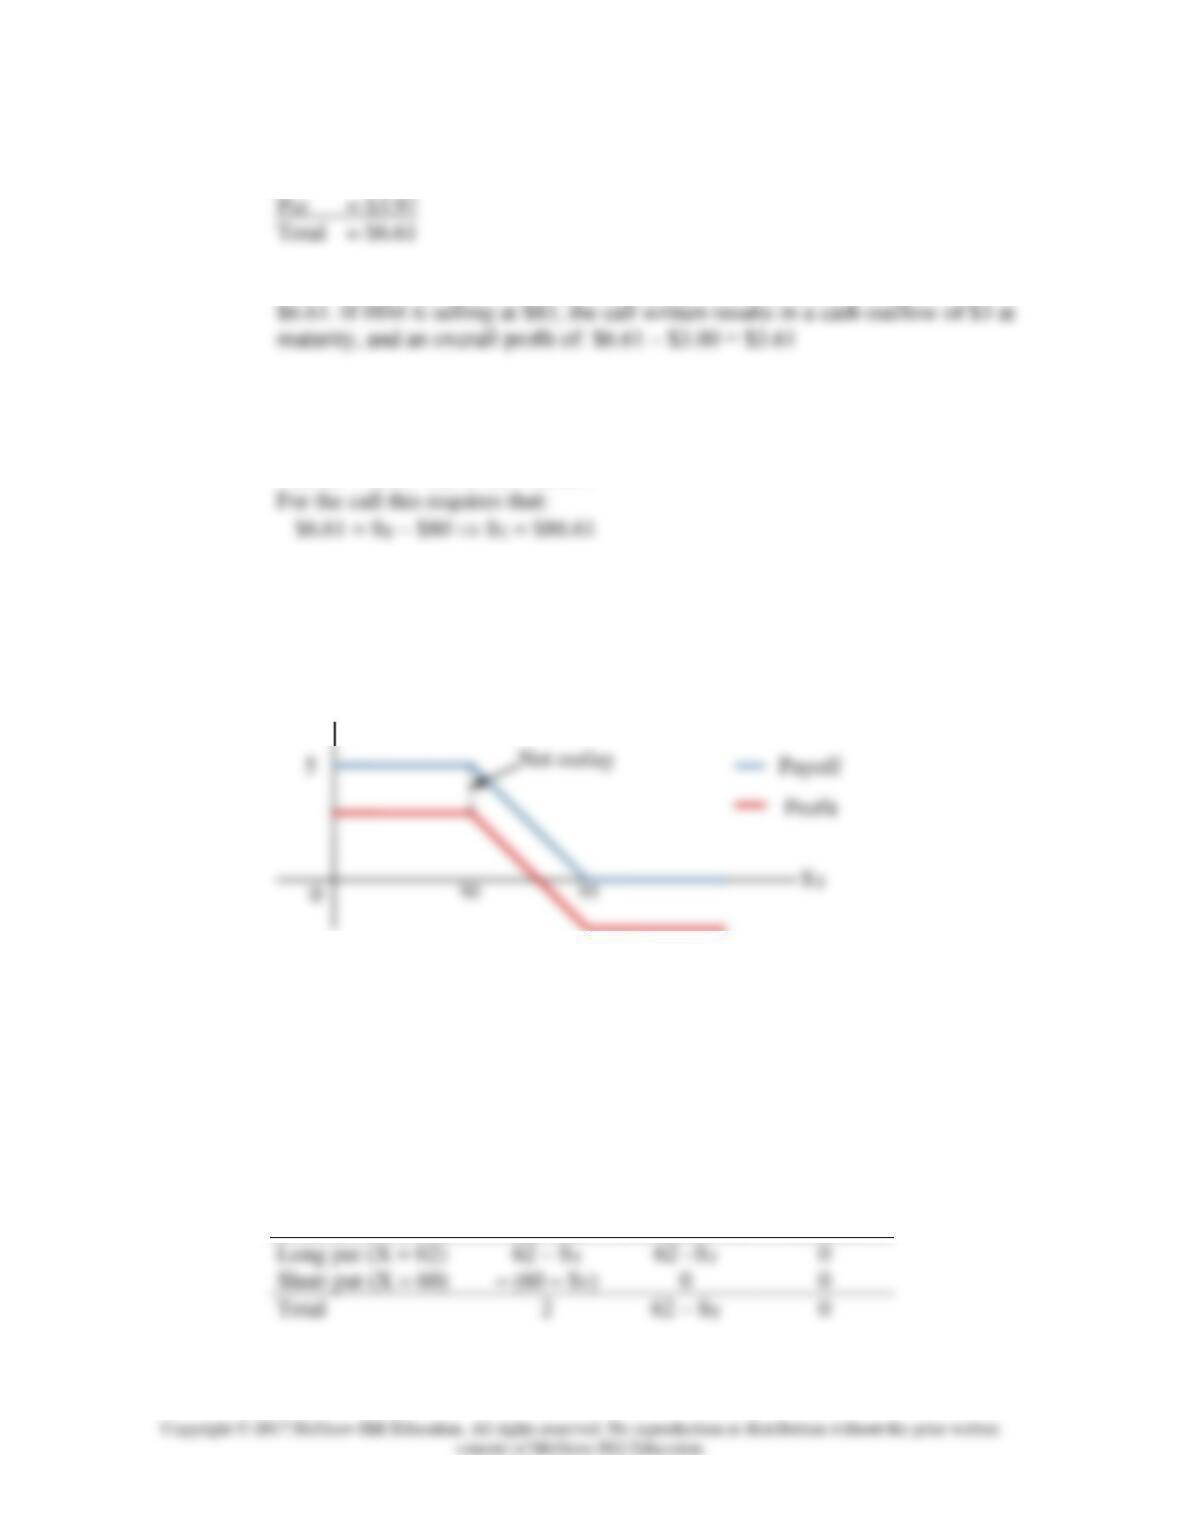
Cost Payoff Profit
5. If the stock price drops to zero, you will make $80 – $5.72 per stock, or $74.28. Given
7. a. Maximum loss happens when the stock price is the same to the strike price upon
Chapter 15 - Options Markets
b. Loss: Final value – Original investment
= (ST – X) – (C + P) = $8 – $15.50 = –$7.50
c. There are two break even prices:
i. ST > X
8. Option c is the only correct statement.
a. The value of the short position in the put is –$4 if the stock price is $76.
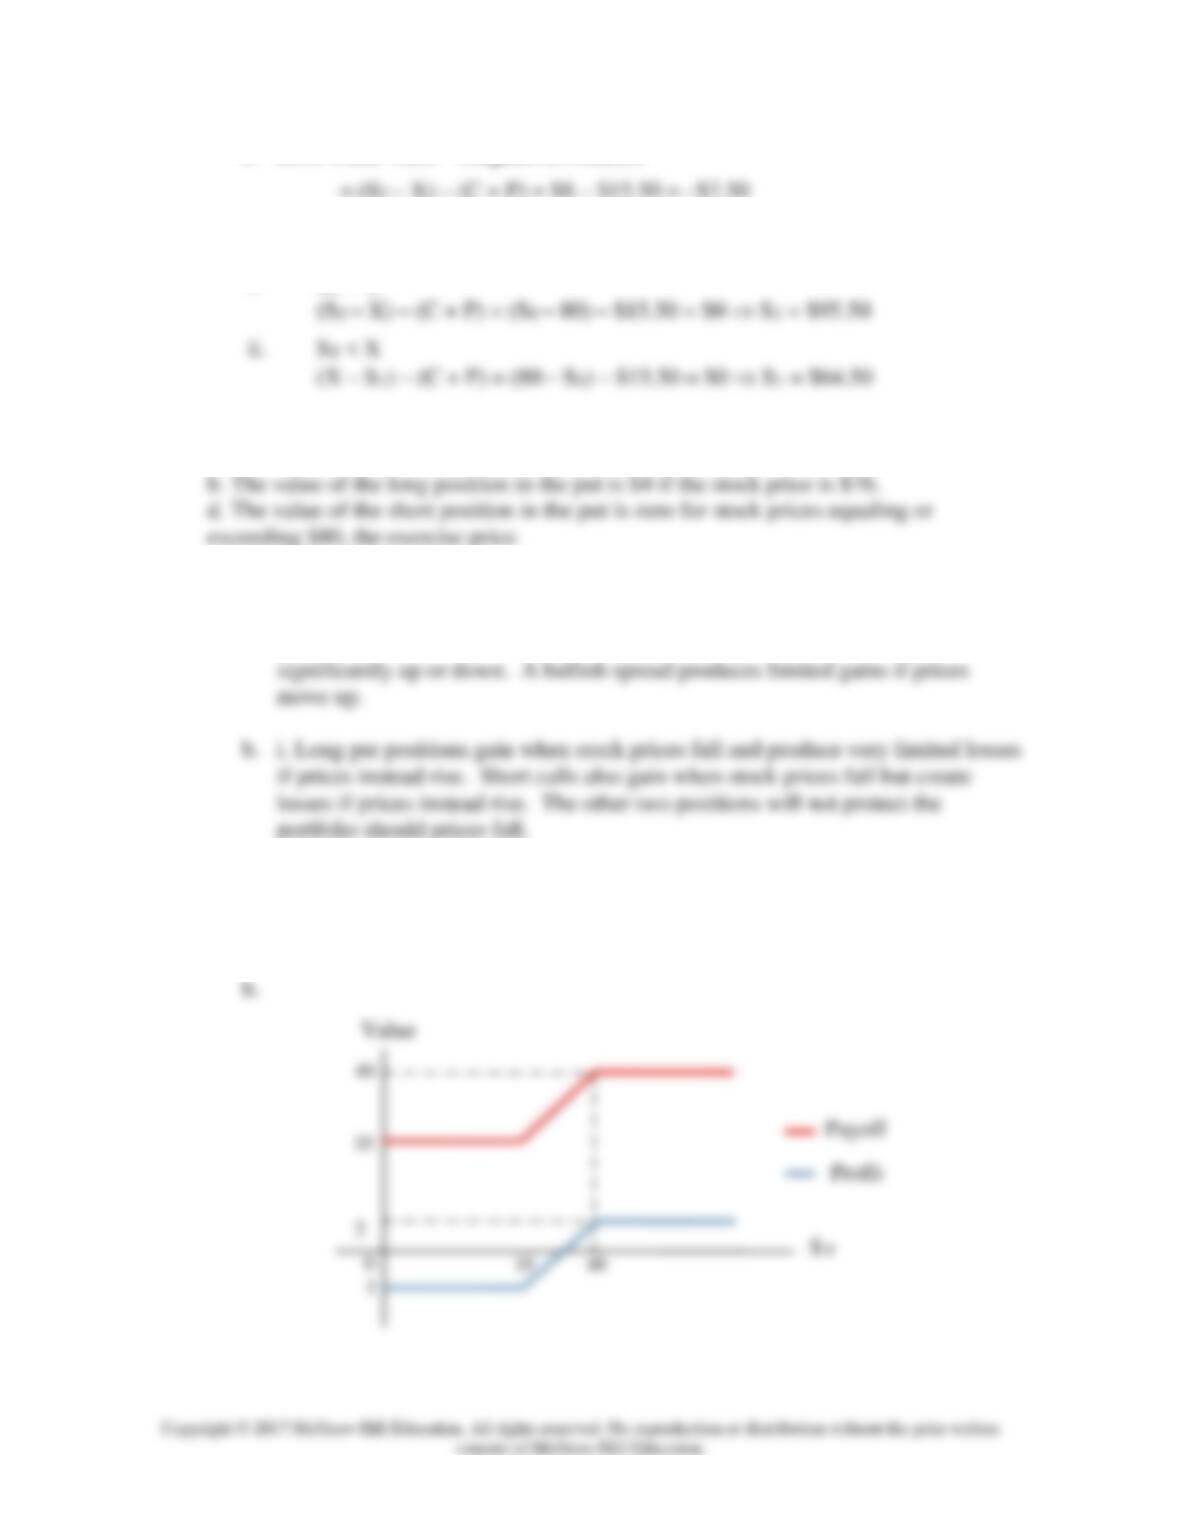
9. a. i. A long straddle produces gains if prices move up or down and limited losses if
prices do not move. A short straddle produces significant losses if prices move
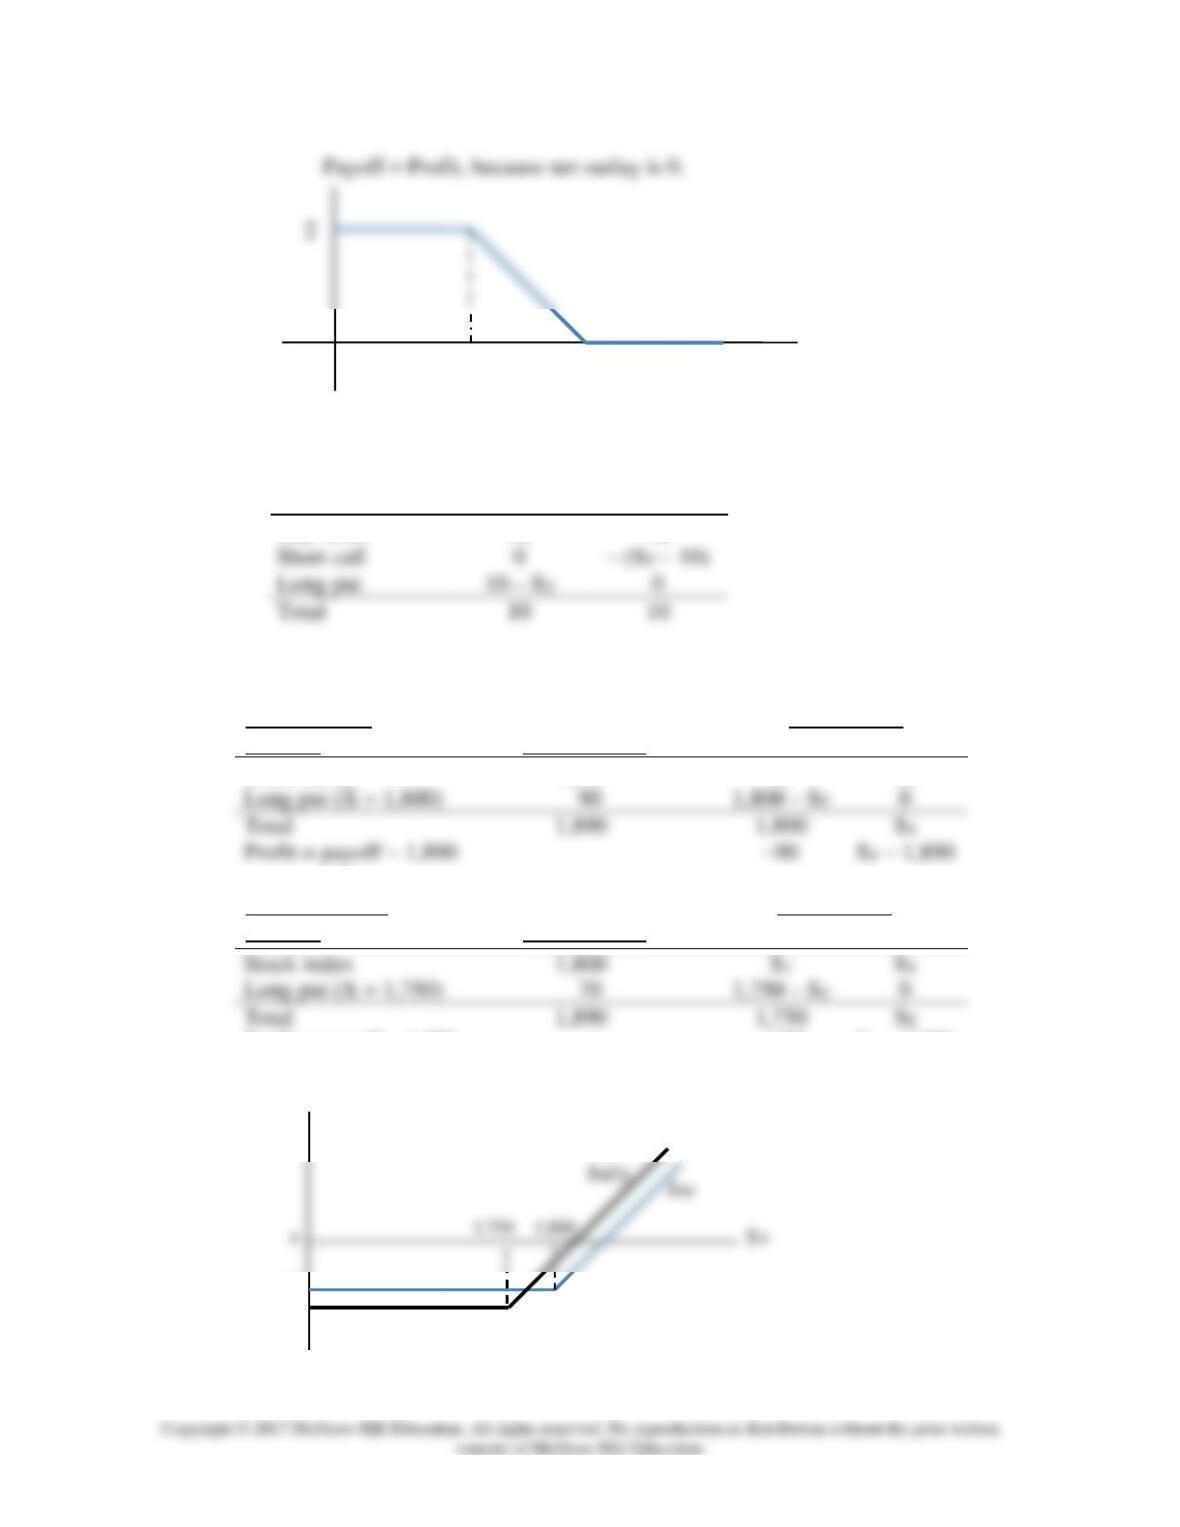
10. The initial outlay of this position is $38, the purchase price of the stock, and the payoff
of such position will be between two boundaries, $35 and $40.
a. The maximum profit will thus be: $40 – $38 = $2, and the maximum loss will
be: $35 – $38 = –$3.
11. The collar involves purchasing a put for $3 and selling a call for $2. The initial outlay is
$1.
a. ST = $30
Value at expiration = Value of call + Value of put + Value of stock
= $0 + ($35 – $30) + $30 = $35
Given 5,000 shares, the total net proceeds will be:
b. ST = $40
Value at expiration = Value of call + Value of put + Value of stock
= 0 + 0 + $40 = $40
c. ST = $50
Value at expiration = Value of call + Value of put + Value of stock
= ($45 – $50) + 0 + $50 =$45
12. In terms of dollar returns:
Chapter 15 - Options Markets
Price of Stock Six Months from Now
Stock price:
$80
$100
$110
$120
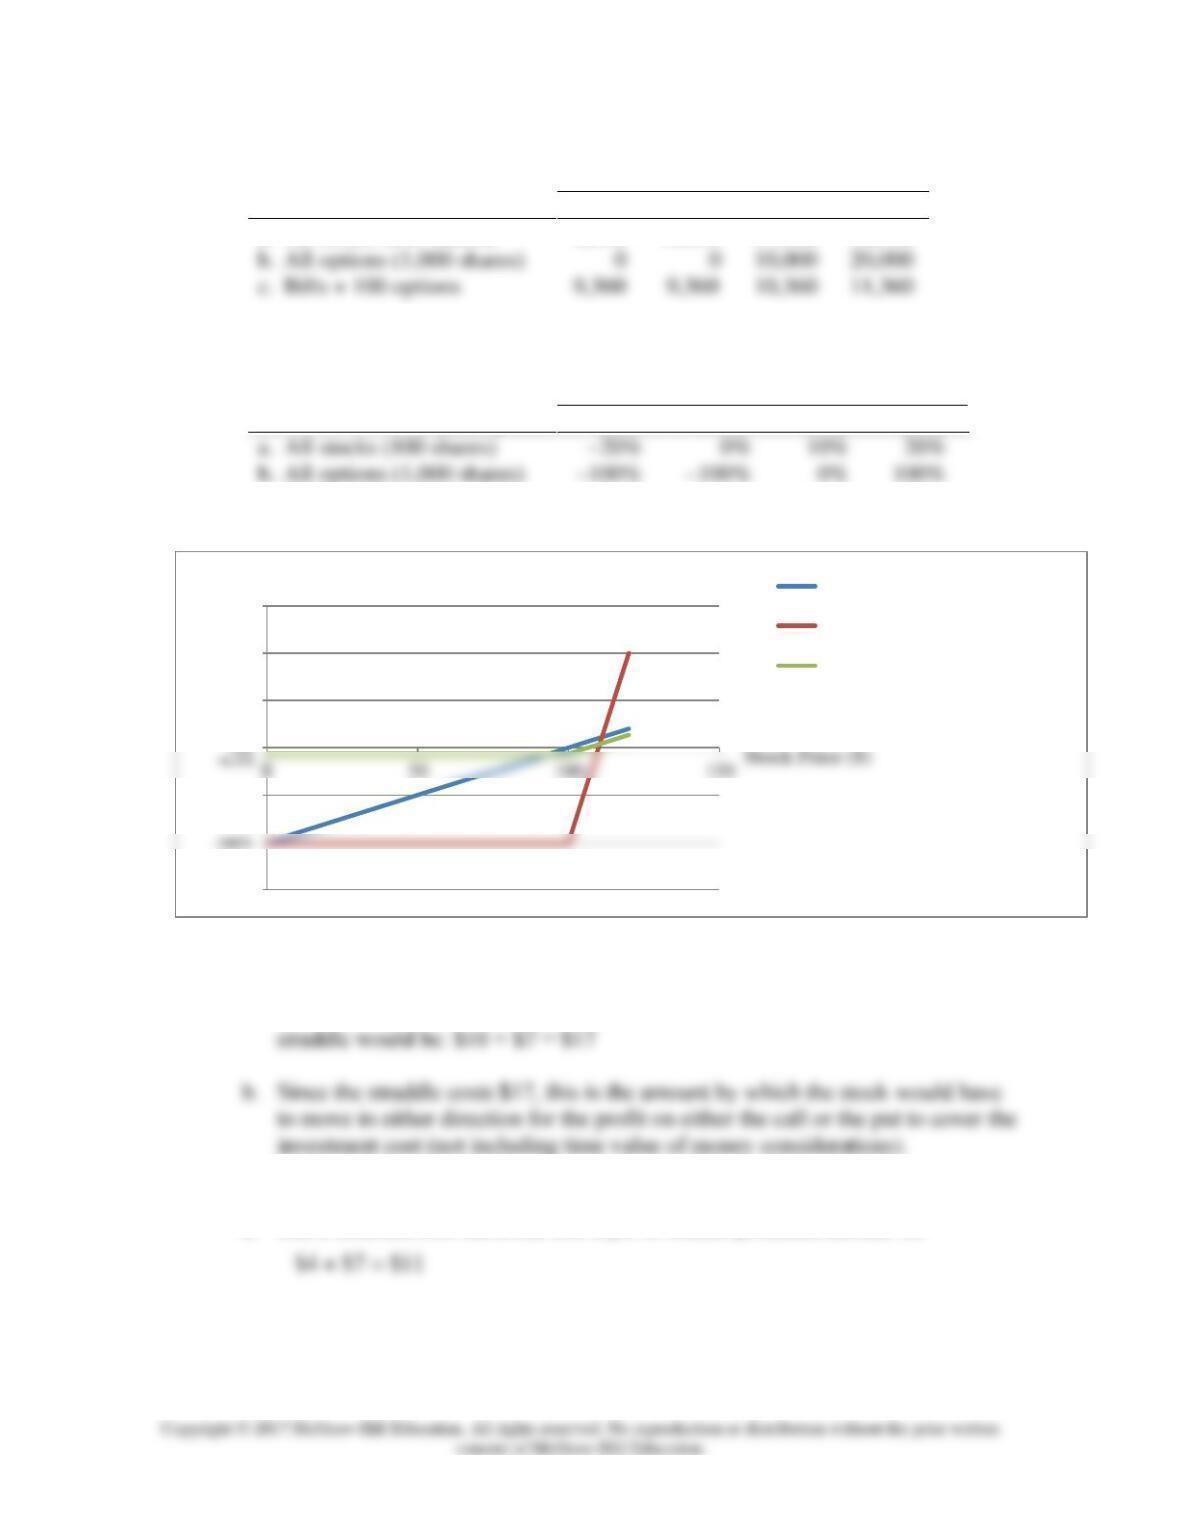
a. All stocks (100 shares)
8,000
10,000
11,000
12,000
In terms of rate of return, based on a $10,000 investment:
Price of Stock Six Months from Now
Stock price:
$80
$100
$110
$120
c. Bills + 100 options
–6.4%
-6.4%
3.6%
13.6%
13.
a. Purchase a straddle, i.e., both a put and a call on the stock. The total cost of the
14.
a. Sell a straddle, i.e., sell a call and a put to realize premium income of:
-150%
-50%
50%
100%
150%
a. All stocks (100 shares)
b. All options (1,000 shares)
c. Bills + 100 options
Rate of Return
Chapter 15 - Options Markets
b. If the stock ends up at $50, both of the options will be worthless and the profit
15. a. By writing covered call options, Jones receives premium income of $30,000. If,
in January, the price of the stock is less than or equal to $45, he will keep the
stock plus the premium income. Since the stock will be called away from him if
its price exceeds $45 per share, the most he can have is:
$450,000 + $30,000 = $480,000
(We are ignoring interest earned on the premium income from writing the
option over this short time period.) The payoff structure is:
b. By buying put options with a $35 strike price, Jones will be paying $30,000 in
premiums in order to insure a minimum level for the final value of his position.
That minimum value is: ($35 10,000) – $30,000 = $320,000
This strategy allows for upside gain, but exposes Jones to the possibility of a
moderate loss equal to the cost of the puts. The payoff structure is:
Chapter 15 - Options Markets
c. The net cost of the collar is zero. The value of the portfolio will be as follows:
Stock Price
Portfolio Value
Less than $35
$350,000
The best strategy in this case is (c) since it satisfies the two requirements of
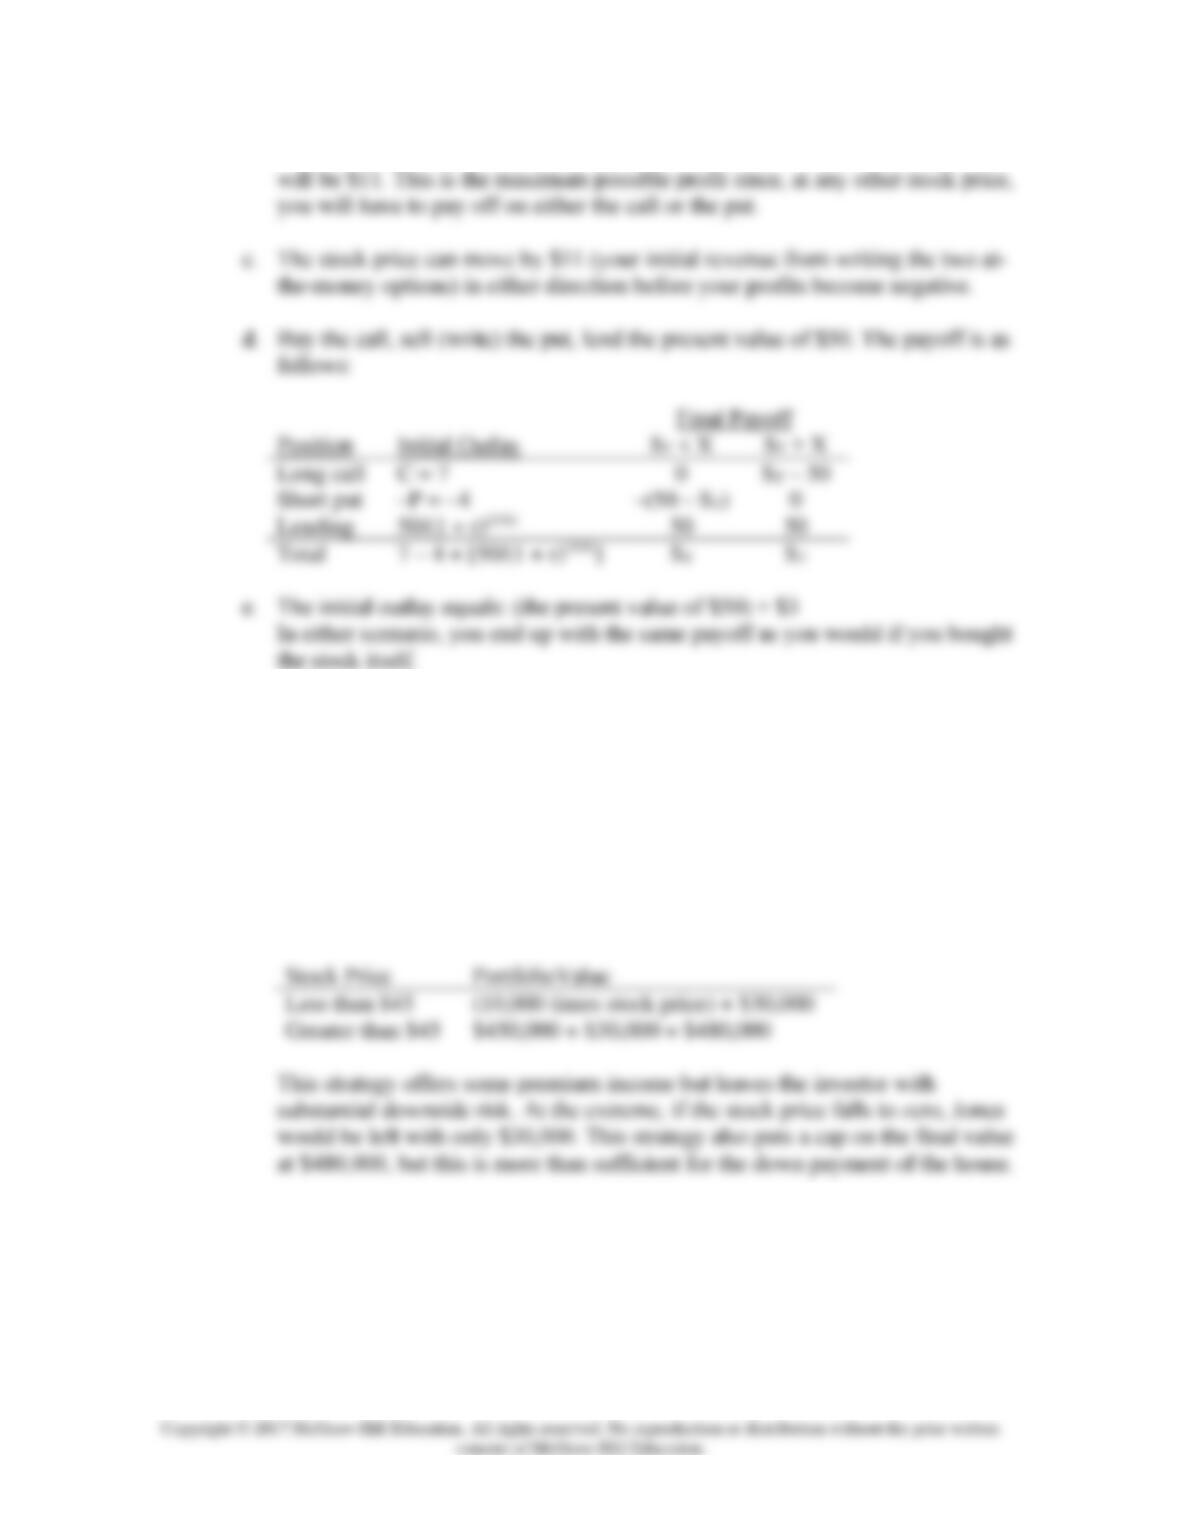
a. Butterfly Spread
Position
ST < X1
X1 < ST < X2
X2 < ST < X3
X3 < ST
Long call (X1)
0
ST –X1
ST –X1
ST –X1
Short 2 calls (X2)
0
0
–2(ST –X2)
–2(ST –X2)
Chapter 15 - Options Markets
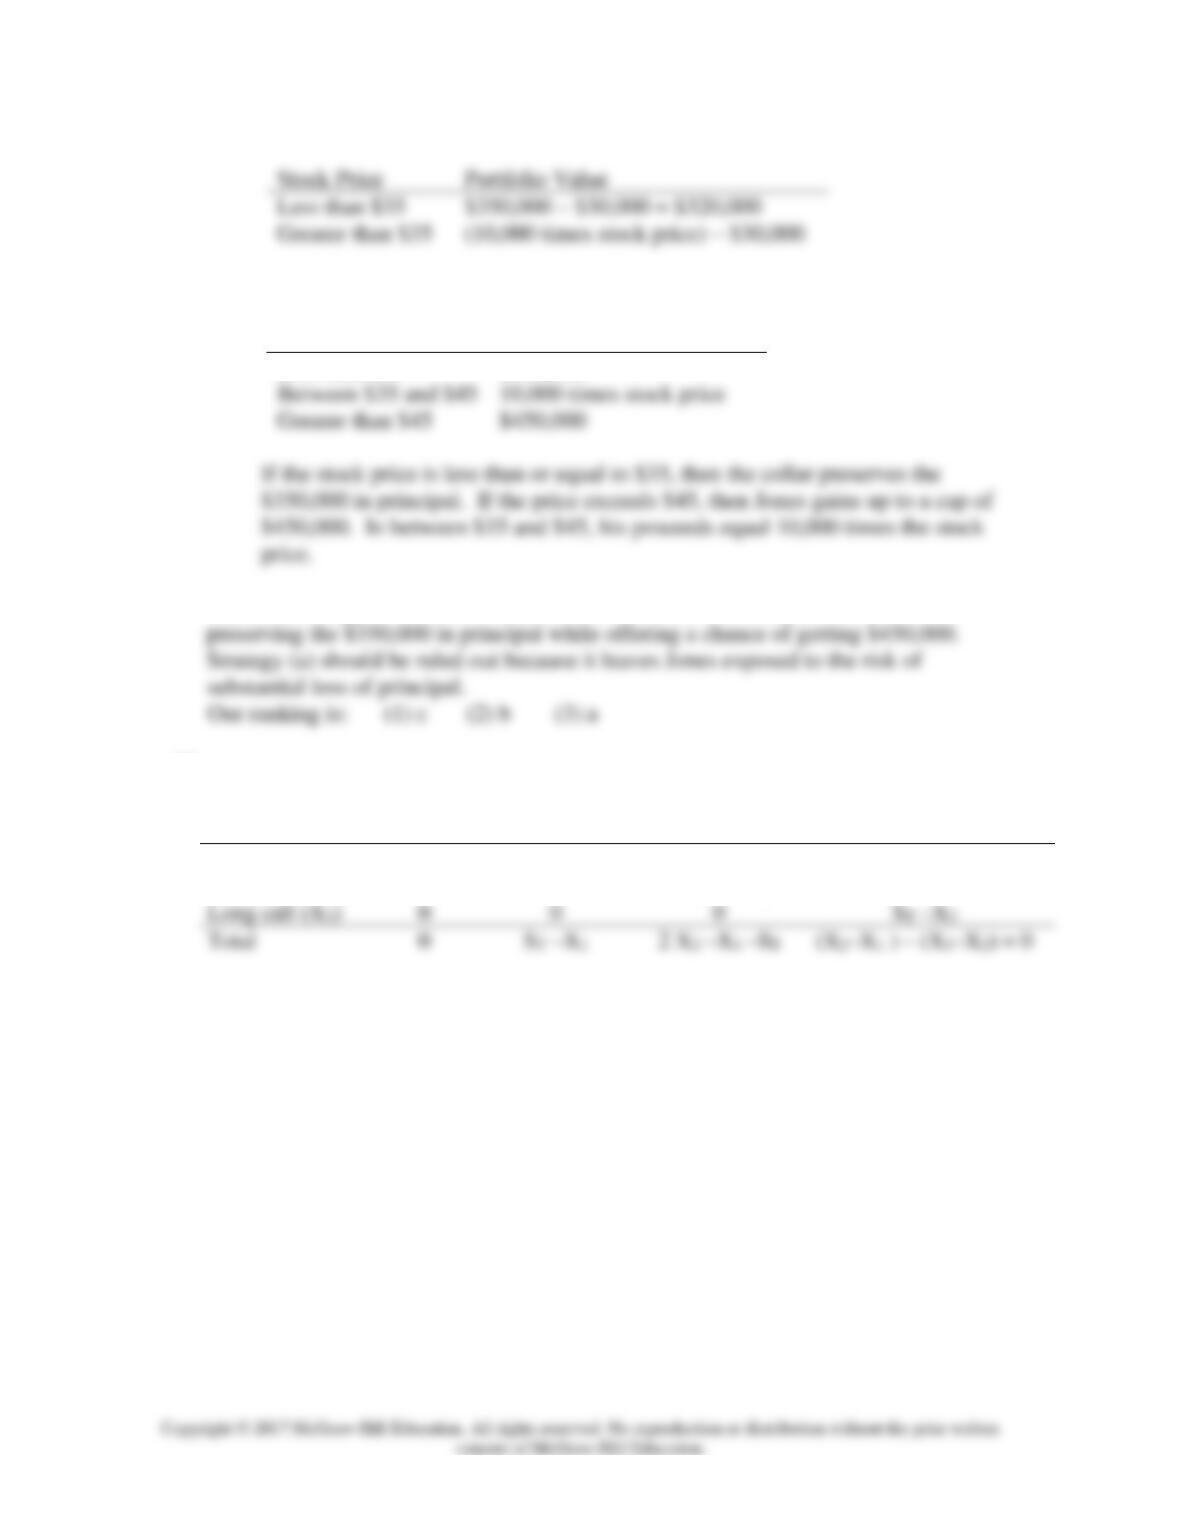
b. Vertical combination
Position
ST < X1
X1 < ST < X2
ST > X2
Long call (X2)
0
0
ST –X2
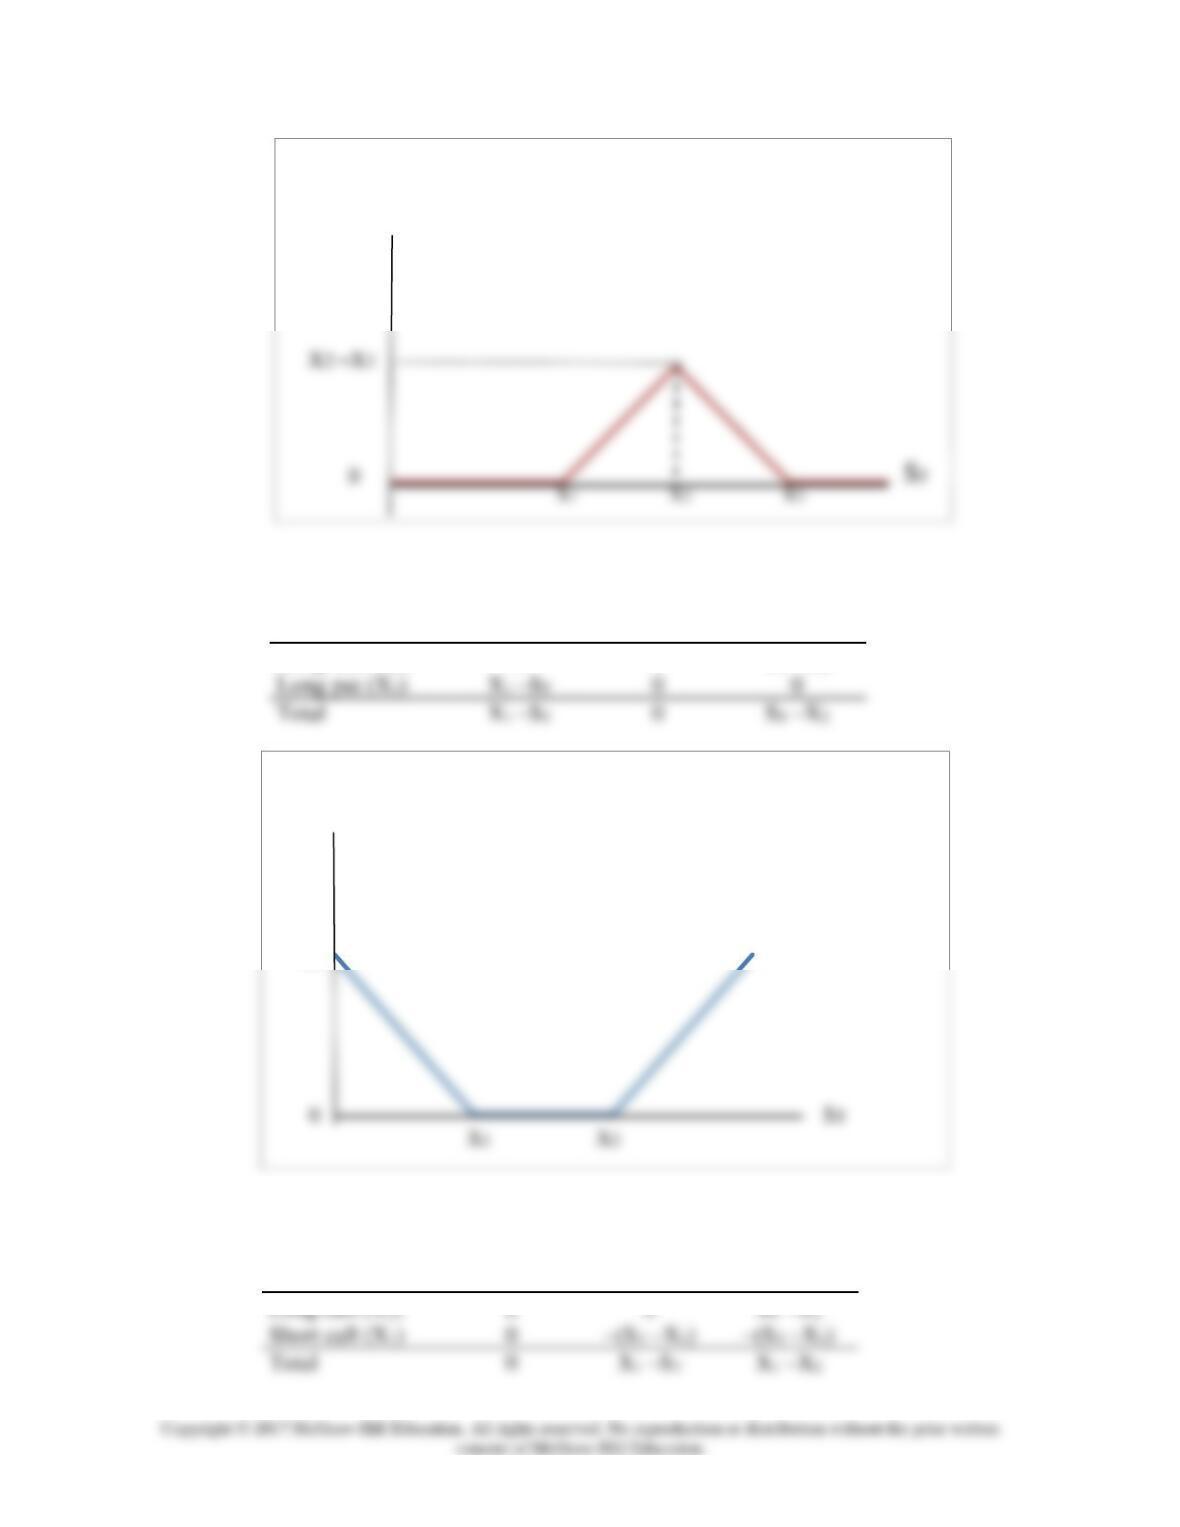
17. Bearish spread
Position
ST < X1
X1 < ST < X2
ST > X2
Payoff
Payoff
X1
Chapter 15 - Options Markets
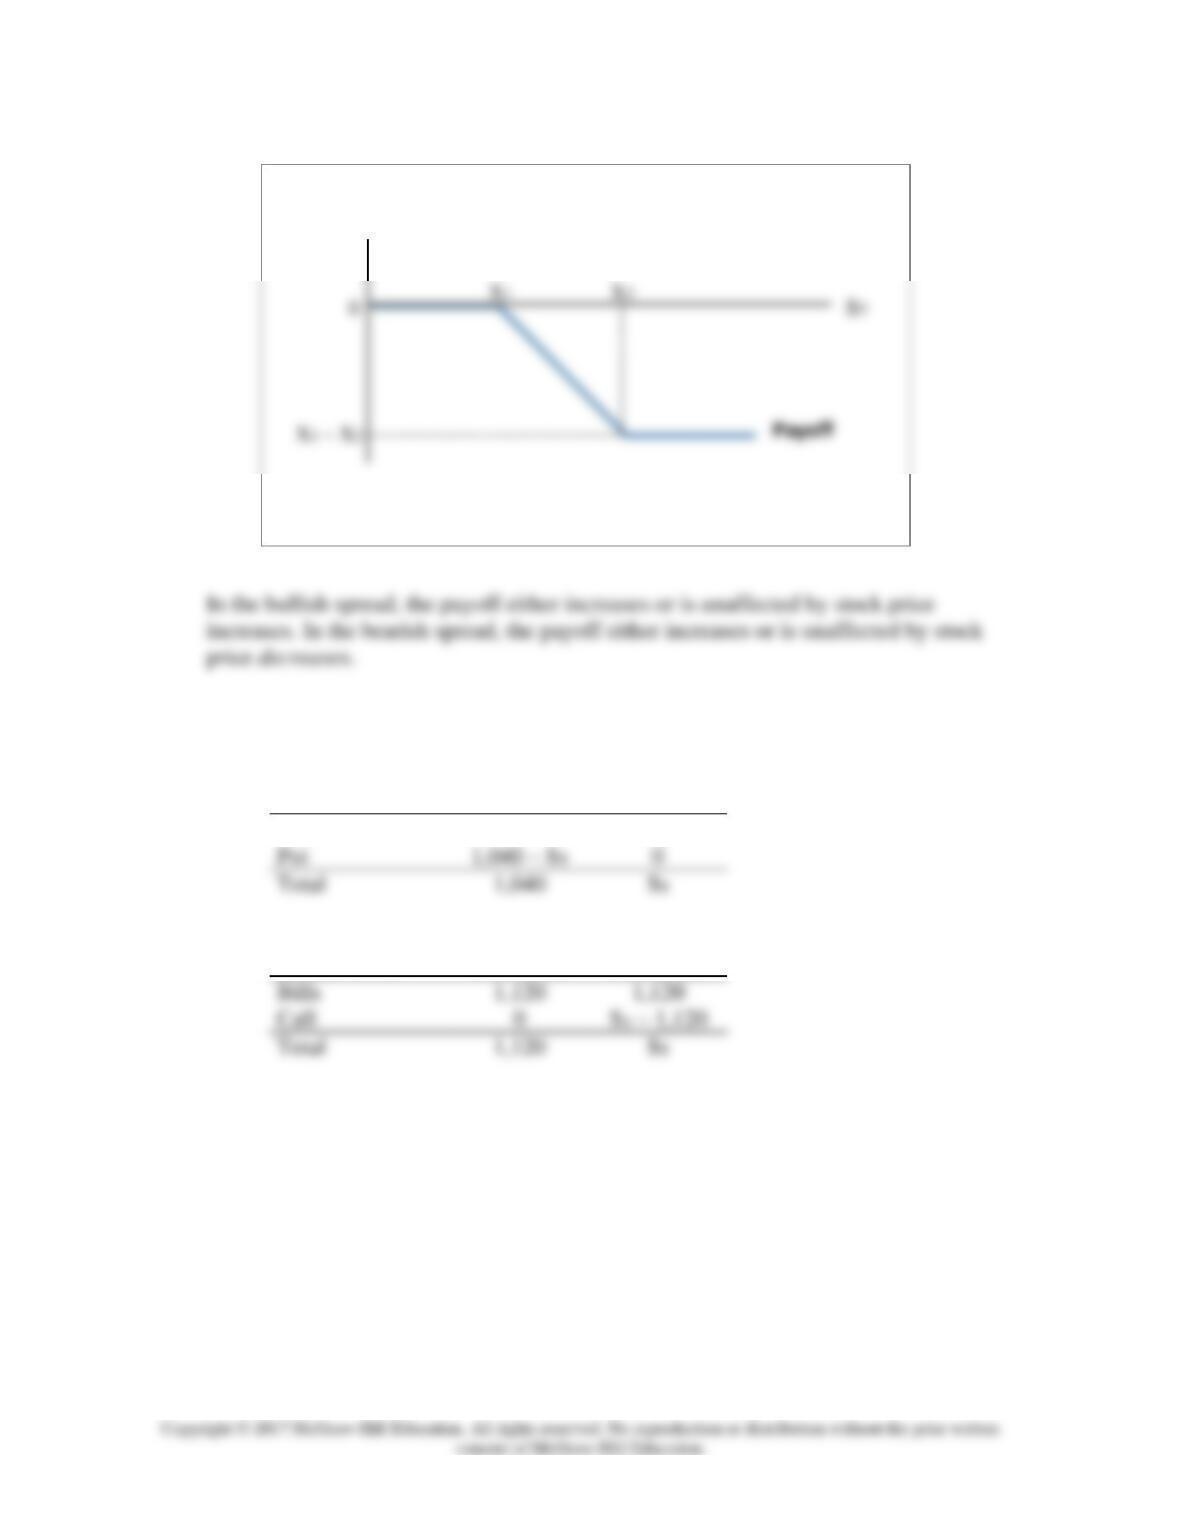
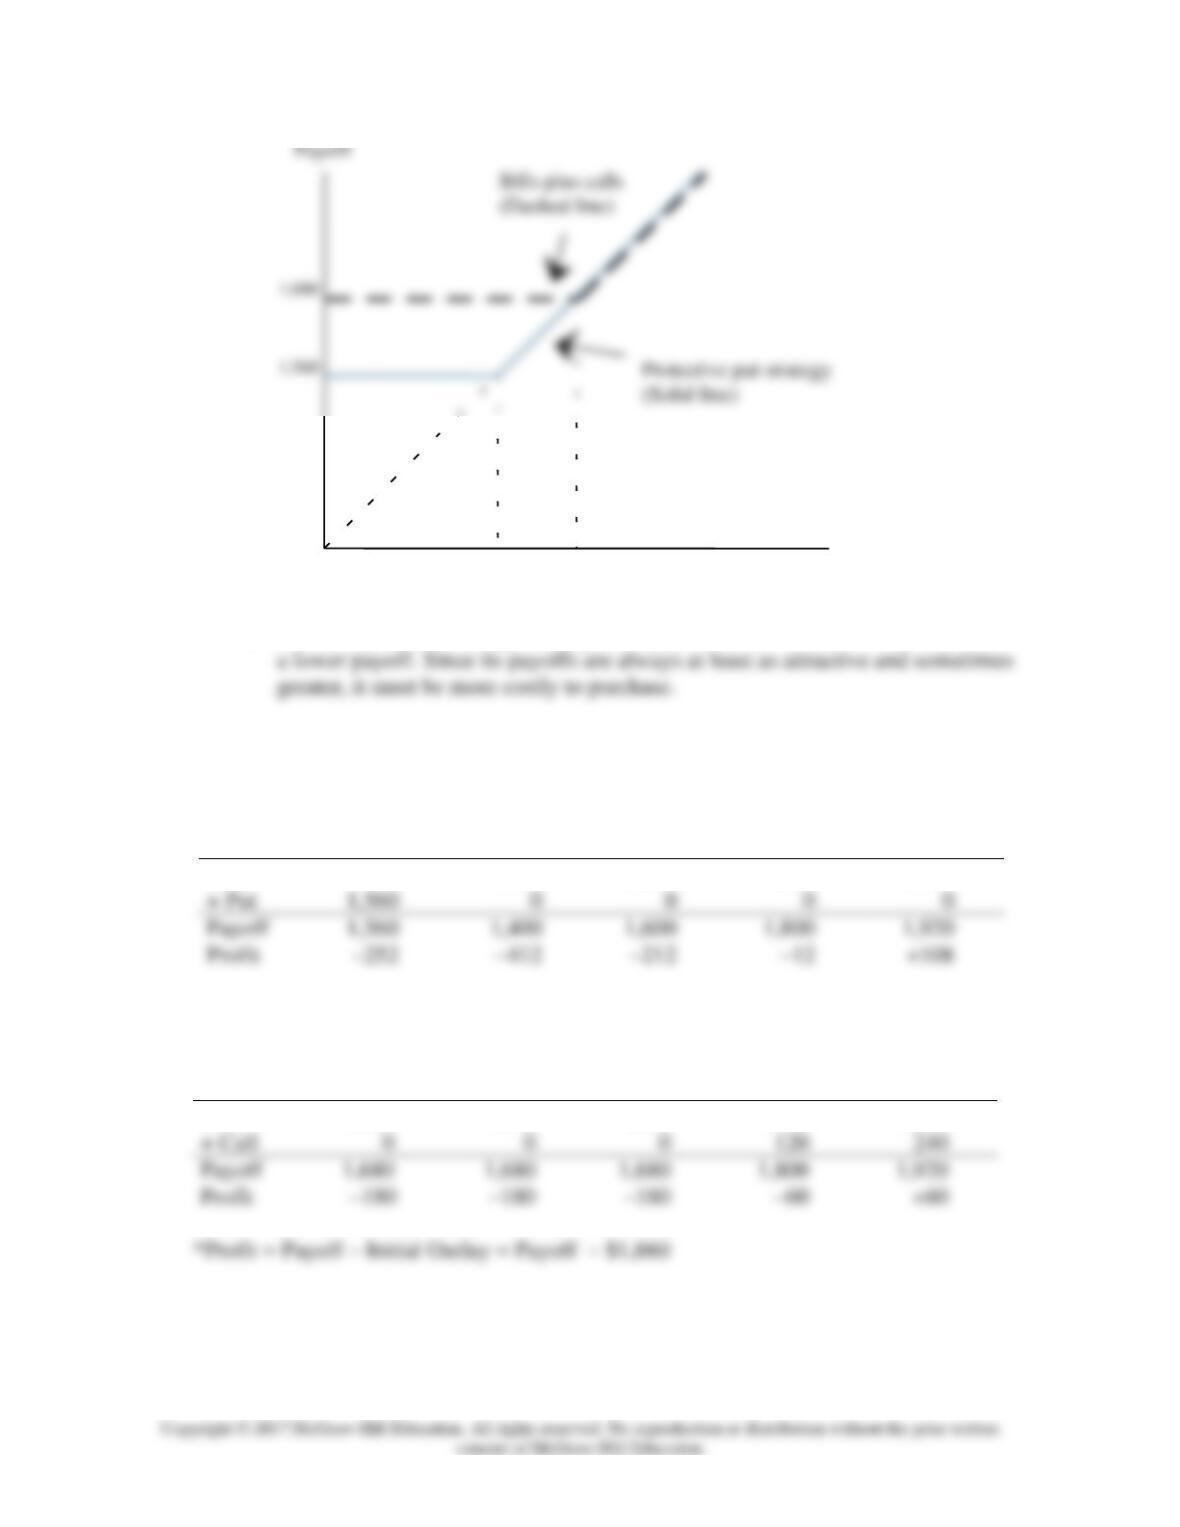
18. a. Strategy one: Protective put
Protective Put
ST < 1,040
ST > 1,040
Stock
ST
ST
Strategy two: Bills plus calls
Bills and Call
ST < 1,120
ST > 1,120
Chapter 15 - Options Markets
S
T
1,560
1,680
0
b. The bills plus call strategy has a greater payoff for some values of ST and never
c. The initial cost of the stock plus put position is $1,812 and the cost of the bills plus
call position is $1,860.
Strategy one: Protective put
Position
ST = 0
ST = 1,400
ST = 1,600
ST = 1,800
ST = 1,920
Stock
0
1,400
1,600
1,800
1,920
*Profit = Payoff – Initial Outlay = Payoff – $1,812
Strategy two: Bills plus calls
Position
ST = 0
ST = 1,400
ST = 1,600
ST = 1,800
ST = 1,920
Bill
1,680
1,680
1,680
1,680
1,680
*Profit = Payoff – Initial Outlay = Payoff – $1,860
Chapter 15 - Options Markets
Profit
-252
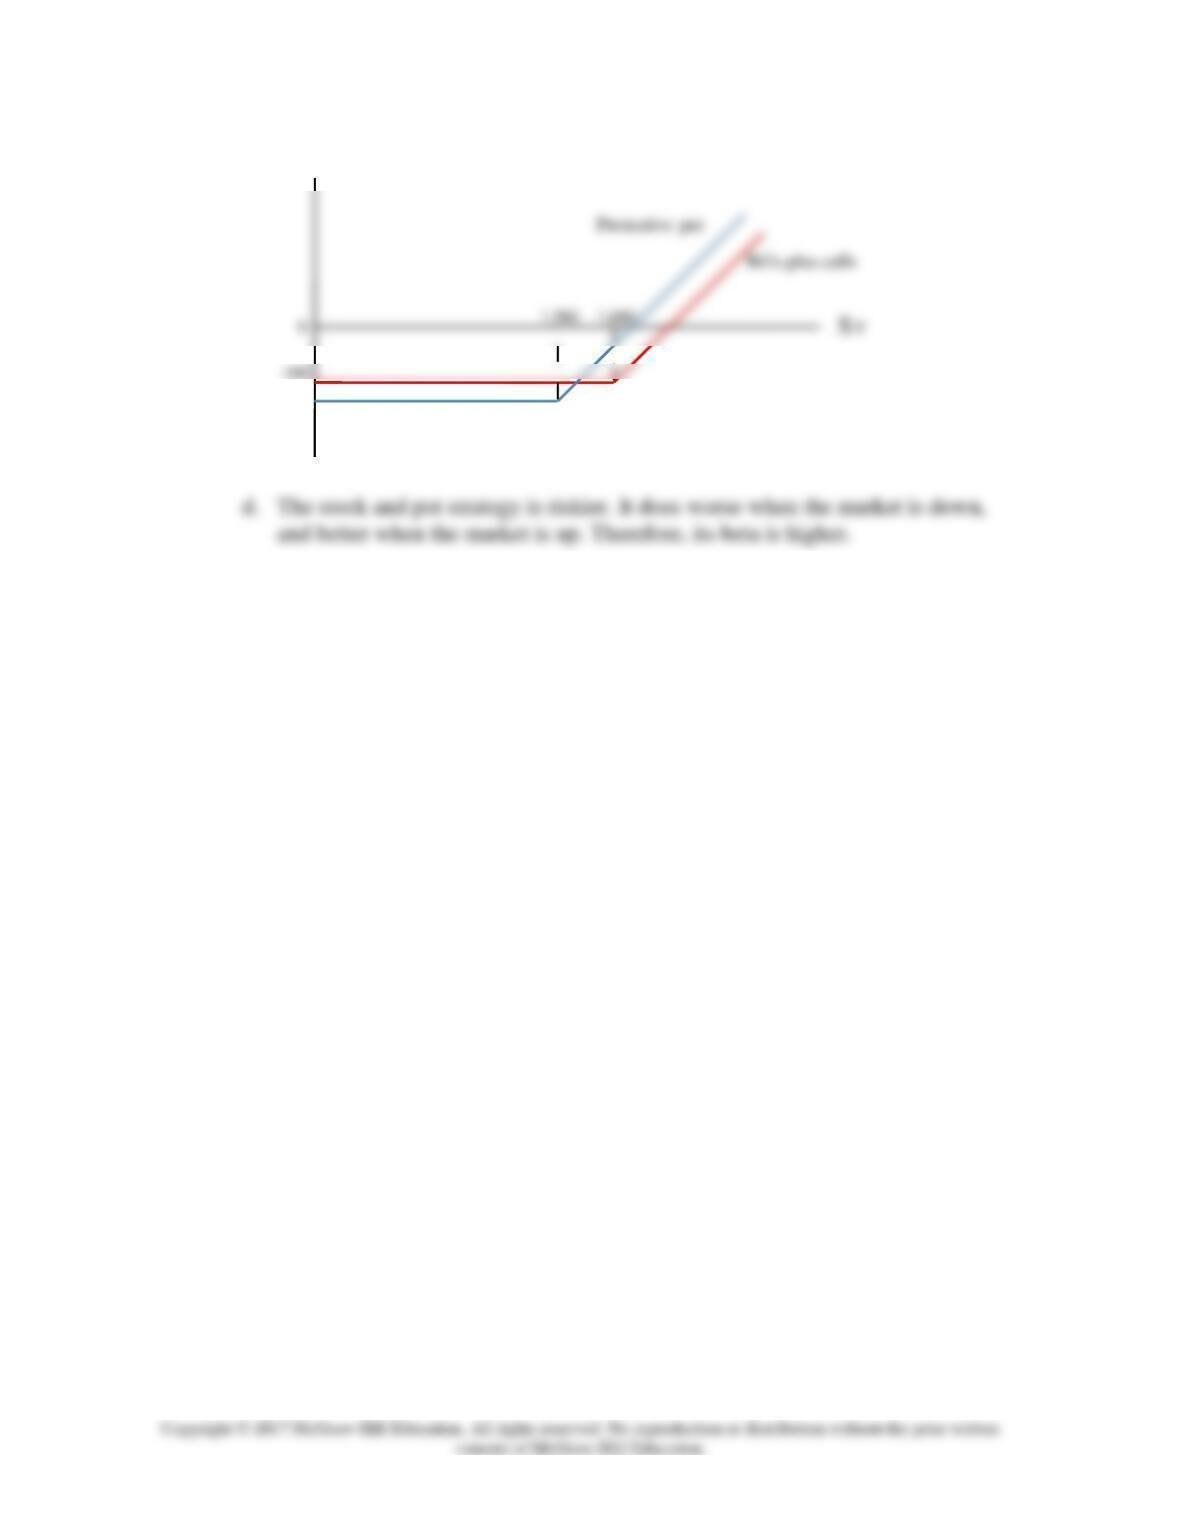
d. The stock and put strategy is riskier. It does worse when the market is down,
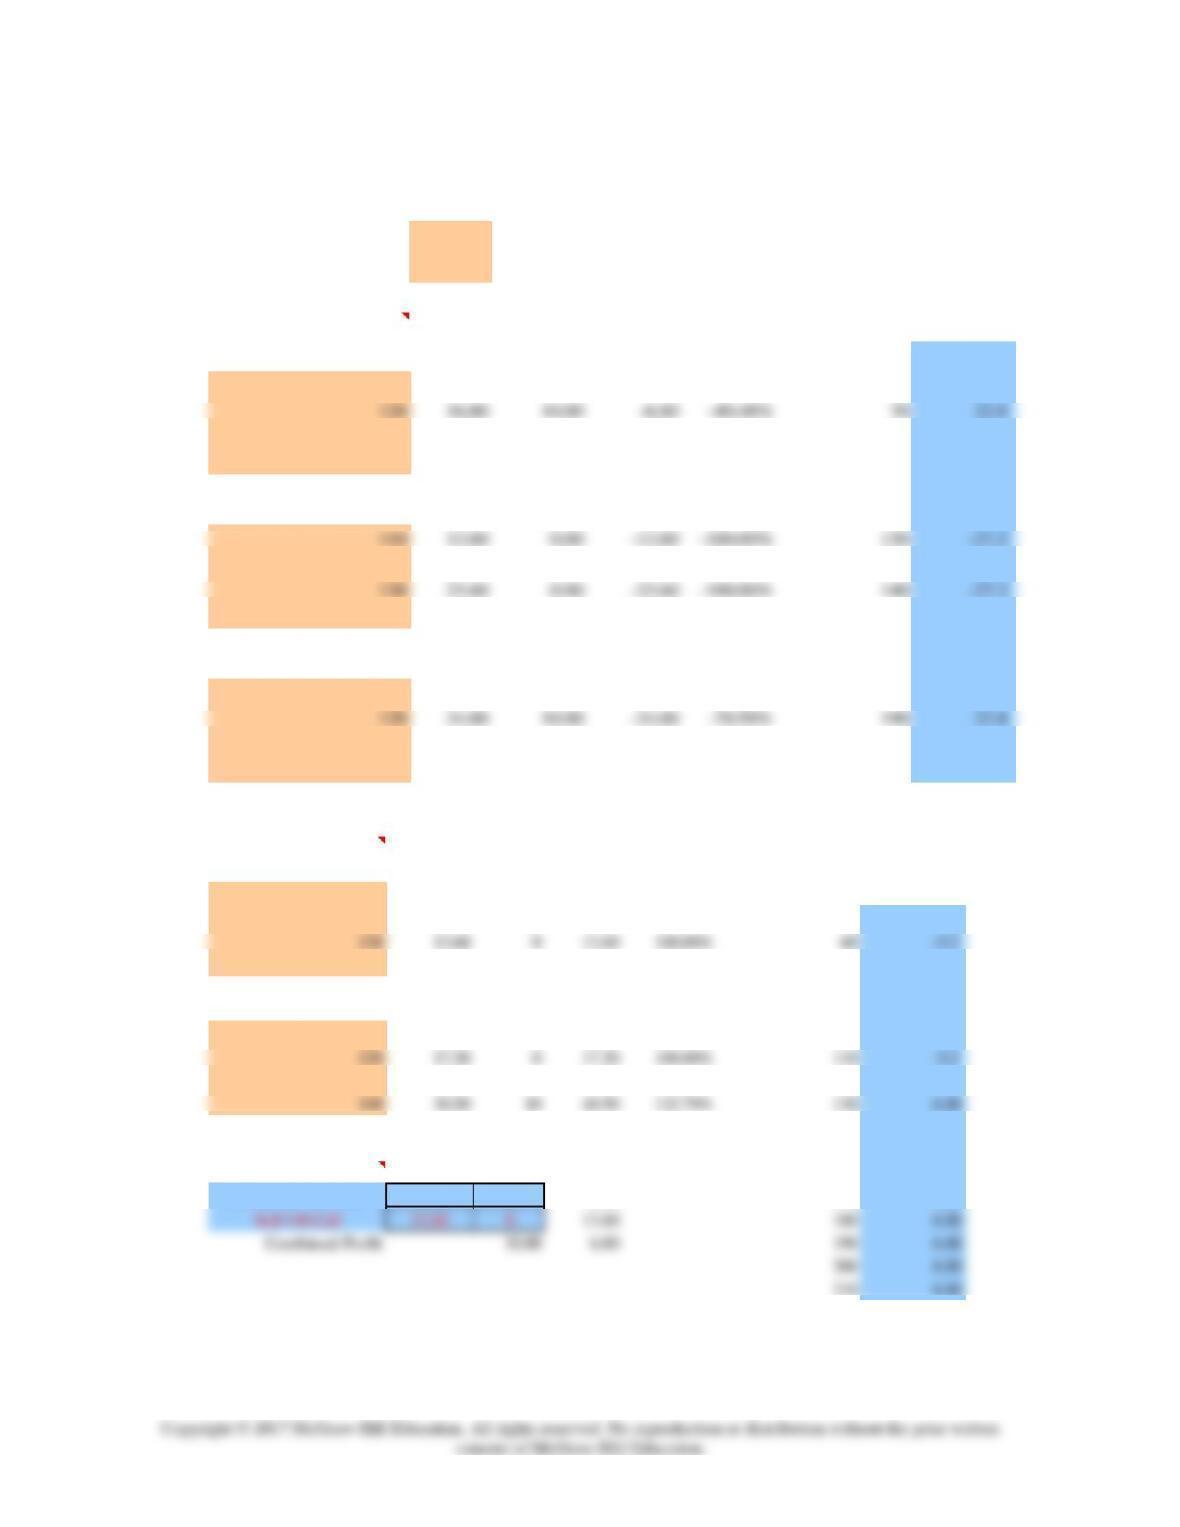
19. The Excel spreadsheet for both parts (a) and (b) is shown on the next page, and the
profit diagrams are on the following page.
Chapter 15 - Options Markets
a. & b.
Stock Prices
Beginning Market Price 116.5
Ending Market Price 130 X 130 Straddle
Ending Profit
Buying Options: Stock Price -37.20
Call Options Strike Price Payoff Profit Return % 50 42.8
110 22.80 20.00 -2.80 -12.28% 60 32.8
130 13.60 0.00 -13.60 -100.00% 80 12.8
140 10.30 0.00 -10.30 -100.00% 90 2.8
100 -7.2
Put Options Strike Price Payoff Profit Return % 110 -17.2
120 17.20 0.00 -17.20 -100.00% 130 -37.2
140 30.50 10.00 -20.50 -67.21% 150 -17.2
160 -7.2
Straddle Price Payoff Profit Return % 170 2.8
110 35.40 20.00 -15.40 -43.50% 180 12.8
130 37.20 0.00 -37.20 -100.00% 200 32.8
140 40.80 10.00 -30.80 -75.49% 210 42.8
Selling Options: Bullish
Call Options Strike Price Payoff Profit Return % Ending Spread
110 22.80 -20 2.80 12.28% Stock Price 6.80
120 16.80 -10 6.80 40.48% 50 -3.2
140 10.30 0 10.30 100.00% 70 -3.2
80 -3.2
Put Options Strike Price Payoff Profit Return % 90 -3.2
110 12.60 0 12.60 100.00% 100 -3.2
130 23.60 0 23.60 100.00% 120 -3.2
140 6.80
Money Spread Price Payoff Profit 150 6.80
Bullish Spread 160 6.80
Purchase 120 Call 16.80 10 -6.80 170 6.80
210 6.80
Chapter 15 - Options Markets
20. The bondholders have, in effect, made a loan which requires repayment of B dollars,
where B is the face value of bonds. If, however, the value of the firm (V) is less than B,
21. The executive receives a bonus if the stock price exceeds a certain value, and receives
22. a.
Position
ST < 75
75 < ST < 80
ST > 80
Short call
0
0
– (ST – 80)
S
T
75
80
Payoff
-40.0
-20.0
0.0
20.0
40.0
Spreads & Straddles
Chapter 15 - Options Markets
b. Proceeds from writing options (from Figure 15.1):
Call = $2.64
If IBM is selling at $77, both options expire out of the money, and profit equals
c. You will break even when either the short position in the put or the short
position in the call results in a cash outflow of $6.61. For the put, this requires
that:
$6.61 = $75 – ST ST = $68.39
d. The investor is betting that the IBM stock price will have low volatility.
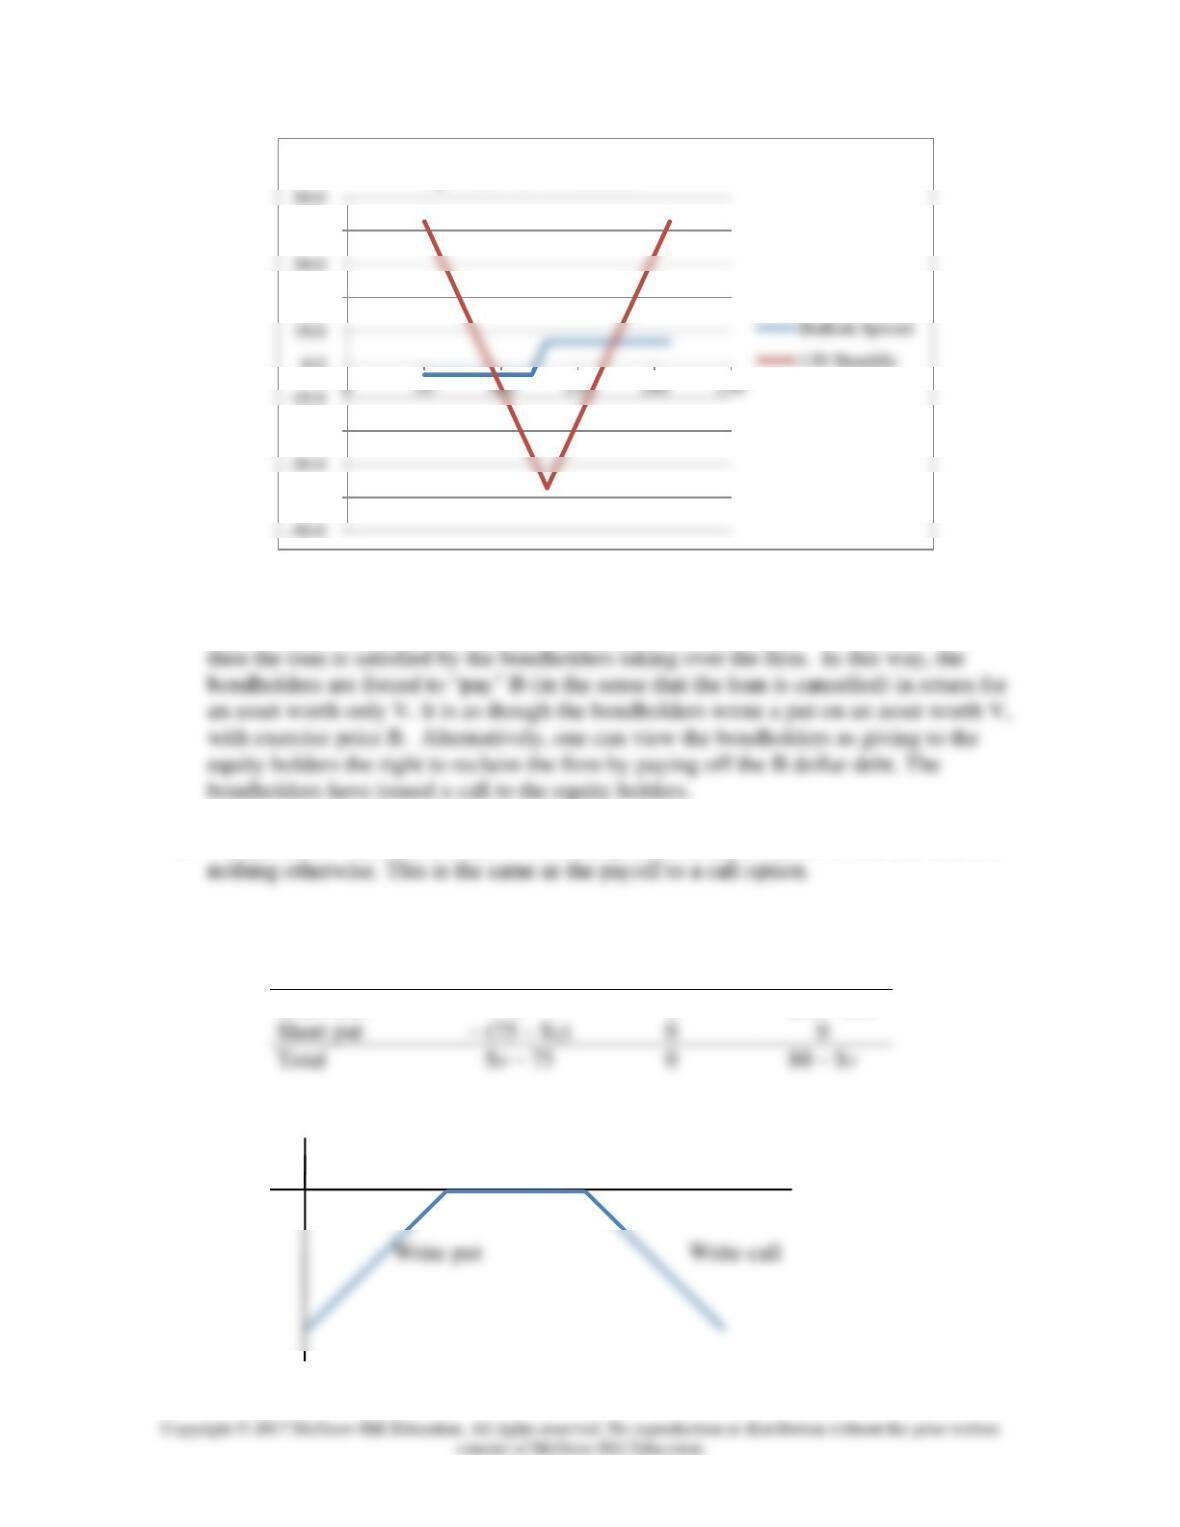
23. a.
Value
b. The put with the higher exercise price must cost more. Therefore, the net outlay
to establish the portfolio is positive.
24. Buy the X = 62 put (which should cost more than it does) and write the X = 60 put.
Since the options have the same price, the net outlay is zero. The proceeds at maturity
will be between 0 and 2 and will never be negative.
Position
ST < 60
60 < ST < 62
ST > 62
Chapter 15 - Options Markets
S
T
0
62
60
25. This riskless strategy will yield a payoff of $10 for either position.. Therefore, the risk-
free rate is: ($10/$9.50) – 1 = .0526 = 5.26%
Position
ST < 10
ST > 10
Buy stock
ST
ST
26. a.
Joe’s strategy
Final Payoff
Position
Initial Outlay
ST < 1800
ST > 1800
Stock index
1,800
ST
ST
Sally’s strategy
Final Payoff
Position
Initial Outlay
ST < 1,750
ST > 1,750
Profit = payoff – 1,870
–120
ST – 1,870
Profit
-90
-120
Chapter 15 - Options Markets
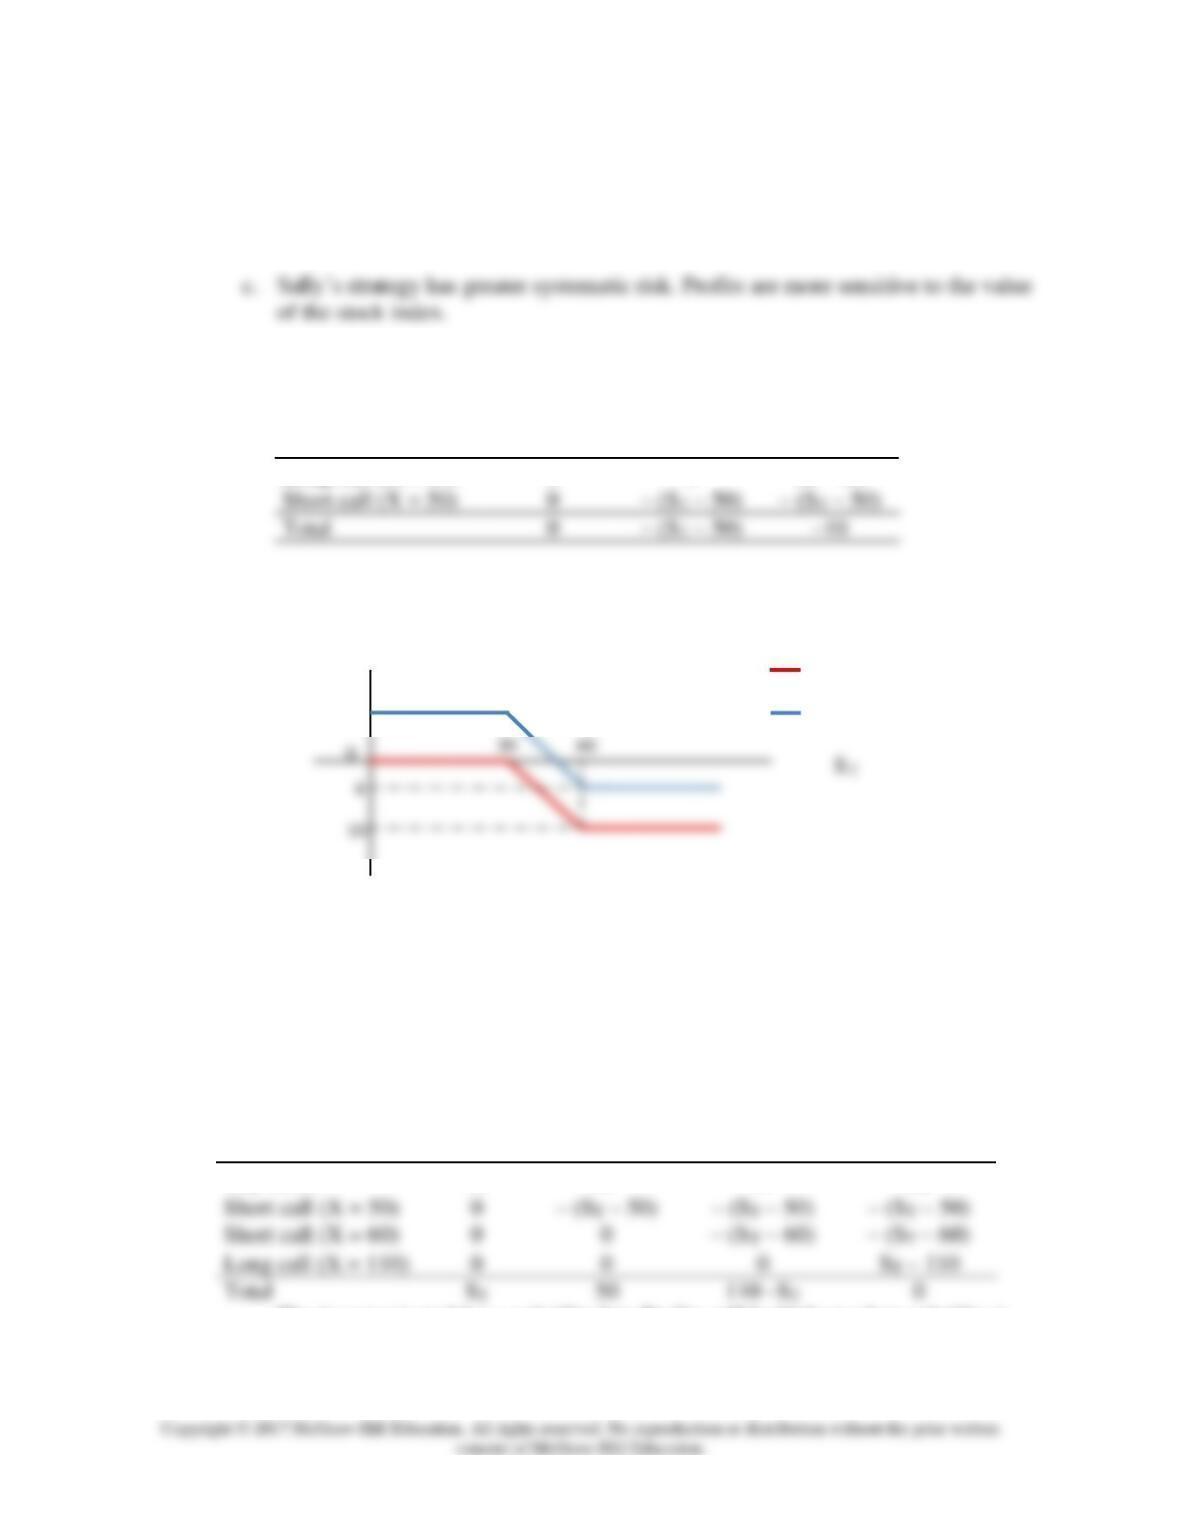
b. Sally does better when the stock price is high, but worse when the stock price is
low. (The break-even point occurs at ST = $1,780, when both positions provide
losses of $90.)
c. Sally’s strategy has greater systematic risk. Profits are more sensitive to the value
27. The initial proceeds are: $9 – $3 = $6
a. The payoff is either negative or zero:
Position
ST < 50
50 < ST < 60
ST > 60
Long call (X = 60)
0
0
ST – 60
b.
6
Payoff
Profit
Value
c. Breakeven occurs when the payoff offsets the initial proceeds of $6, which occurs
at a stock price of ST = $56.
d. This strategy is a bearish spread.
28. Buy a share of stock, write a call with X = 50, write a call with X = 60, and buy a call with
X = 110.
Position
ST < 50
50 < ST < 60
60 < ST < 110
ST > 110
Buy stock
ST
ST
ST
ST
The investor is making a volatility bet. Profits will be highest when volatility is
low, such that if the stock price ends up in the interval between $50 and $60.
29. a. The farmer has the option to sell the crop to the government, for a guaranteed
minimum price, if the market price is too low.
CFA 1
Answer:
CFA 2
Answer:
a. Donie should choose the long strangle strategy. A long strangle option strategy
consists of buying a put and a call with the same expiration date and the same
underlying asset, but different exercise prices. In a strangle strategy, the call has
an exercise price above the stock price and the put has an exercise price below
b. i. The maximum possible loss per share is $9.00, which is the total cost of the
two options ($5.00 + $4.00).
CFA 3
Answer:
Chapter 15 - Options Markets
a. If an investor buys a call option and writes a put option on a T-bond, then, at
maturity, the total payoff to the position is (ST – X), where ST is the price of the
T-bond at the maturity date (time T) and X is the exercise price of the options.
CFA 4
Answer:
a. Conversion value of a convertible bond is the value of the security if it is
converted immediately. That is:
b. Market conversion price is the price that an investor effectively pays for the
common stock if the convertible bond is purchased:
CFA 5
Answer:
a. i. The current market conversion price is computed as follows:
Market conversion price = market price of the convertible bond/conversion ratio
ii. The expected one-year return for the Ytel convertible bond is:
iii. The expected one-year return for the Ytel common equity is:
Chapter 15 - Options Markets
b. The two components of a convertible bond’s value are:
• The straight bond value, which is the convertible bond’s value as a bond, and;
• The option value, which is the value associated with the potential conversion
into equity.
ii. In response to the increase in interest rates, the straight bond value should
decrease and the option value should increase.


