
Chapter 12 – Behavioral Finance and Technical Analysis
CHAPTER 12: BEHAVIORAL FINANCE
AND TECHNICAL ANALYSIS
PROBLEM SETS
1. Technical analysis can generally be viewed as a search for trends or patterns in market
prices. Technical analysts tend to view these trends as momentum, or gradual
adjustments to ‘correct’ prices, or, alternatively, reversals of trends. A number of the
2. Even if many investors exhibit behavioral biases, security prices might still be set
efficiently if the actions of arbitrageurs move prices to their intrinsic values.
3. One of the major factors limiting the ability of rational investors to take advantage of
any ‘pricing errors’ that result from the actions of behavioral investors is the fact that a
mispricing can get worse over time. An example of this fundamental risk is the apparent



12-4
12. This pattern shows a lack of breadth. Even though the index is up, more stocks declined
than advanced, which indicates a “lack of broad–based support” for the rise in the index.
13.
Day
Advances
Declines
Net
Advances
Cumulative
Breadth
1
906
704
202
202
2
653
986
-333
-131
3
721
789
– 68
-199
4
503
968
-465
-664
5
497
1,095
-598
-1,262
6
970
702
268
-994
7
1,002
609
393
-601
8
903
722
181
-420
9
850
748
102
-318
10
766
766
0
-318
The signal is bearish as cumulative breadth is negative; however, the negative number
is declining in magnitude, indicative of improvement. Perhaps the worst of the bear
market has passed.
14. Trin =
936.0
906/million 330
704/million 240
advancing Number/advancing Volume
declining Number/declining Volume ==
This is a slightly bullish indicator, with average volume in advancing issues a bit greater
than average volume in declining issues.
15. Confidence Index =
bonds corporate grade–teintermediaon Yield
bonds corporate rated–on top Yield
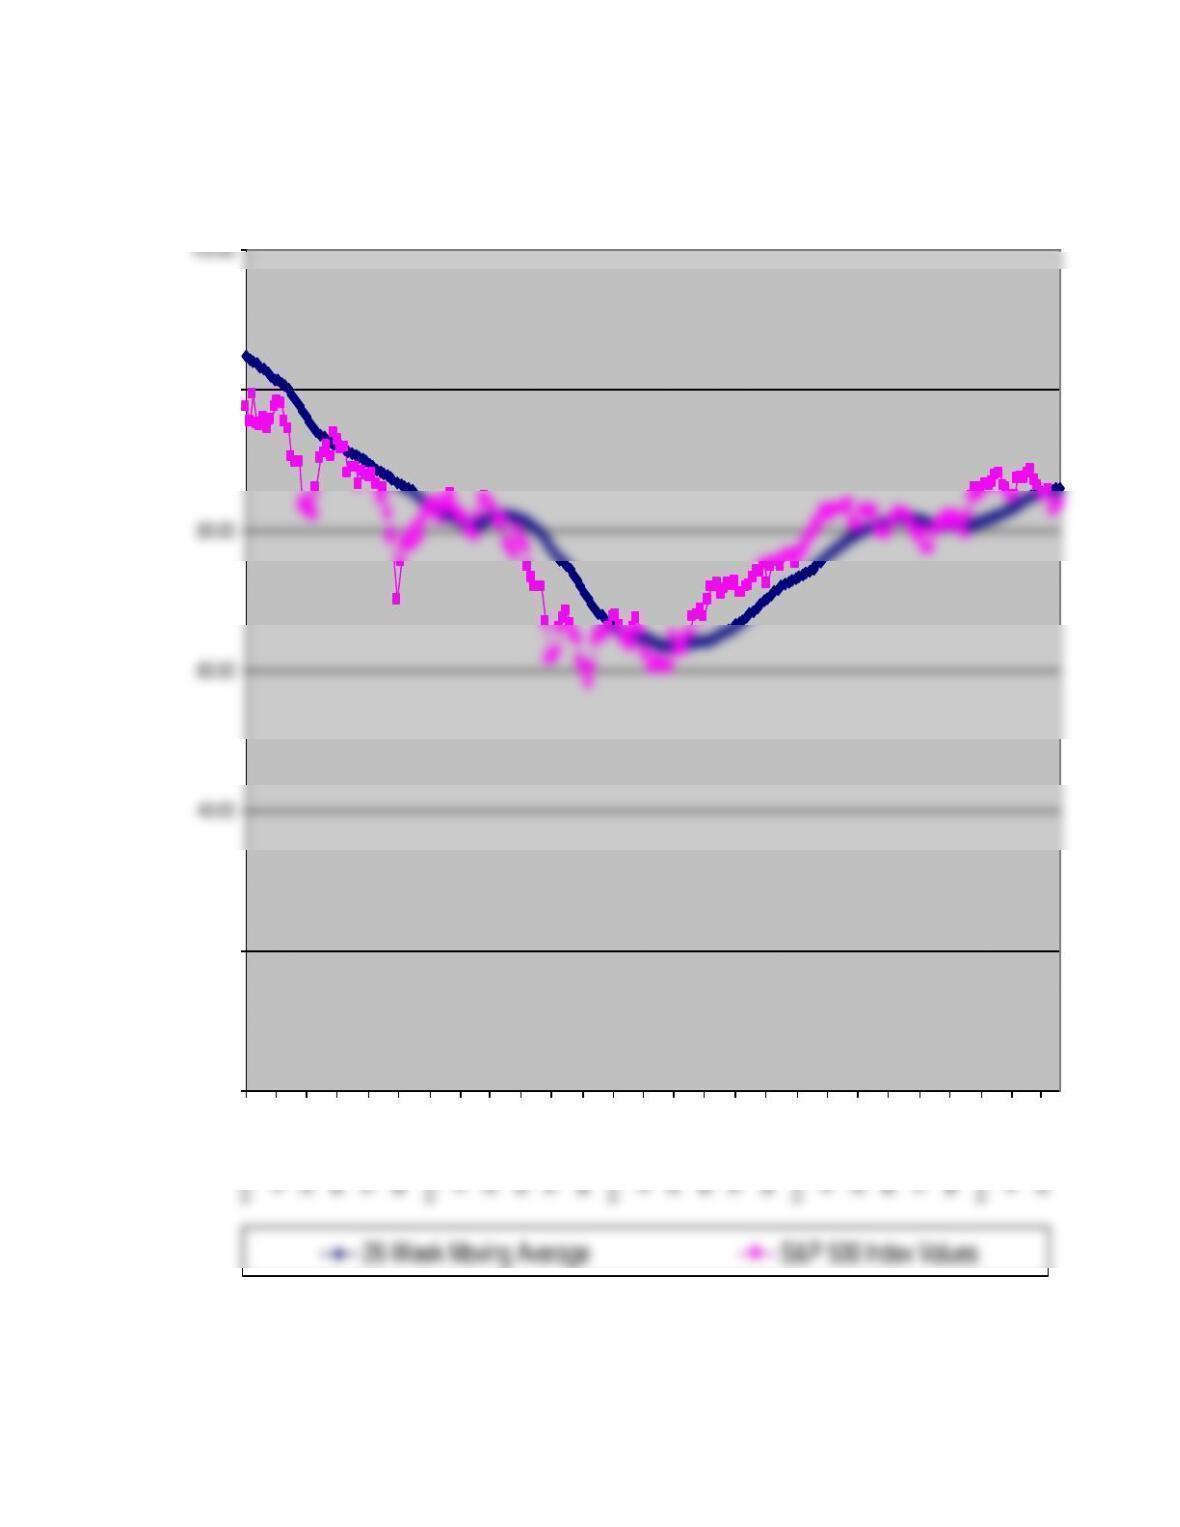
16. [Note: In order to create the 26-week moving average for the S&P 500, we first
converted the weekly returns to weekly index values, using a base of 100 for the week
prior to the first week of the data set. The graph on the next page shows the resulting
S&P 500 values and the 26-week moving average, beginning with the 26th week of the
data set.]
a. The graph on the next page summarizes the data for the 26-week moving average.
Chapter 12 – Behavioral Finance and Technical Analysis
S&P500 Index – 26-Week Moving Average
100.00
120.00

Chapter 12 – Behavioral Finance and Technical Analysis
b. The S&P 500 crosses through its moving average from below fourteen times, as
indicated in the table below. The index increases seven times in weeks following a
cross-through and decreases seven times.
Date of
cross-through
Direction of S&P 500
in subsequent week
05/18/01
Decrease
06/08/01
Decrease
12/07/01
Decrease
12/21/01
Increase
03/01/02
Increase
11/22/02
Increase
01/03/03
Increase
03/21/03
Decrease
04/17/03
Increase
06/10/04
Decrease
09/03/04
Increase
10/01/04
Decrease
10/29/04
Increase
04/08/05
Decrease
c. The S&P 500 crosses through its moving average from above fourteen times, as
indicated in the table below. The index increases nine times in weeks following a
cross-through and decreases five times.
Date of
cross-through
Direction of S&P 500
in subsequent week
06/01/01
Increase
06/15/01
Increase
12/14/01
Increase
02/08/02
Increase
04/05/02
Decrease
12/13/02
Increase
01/24/03
Decrease
03/28/03
Increase
04/30/04
Decrease
07/02/04
Decrease
09/24/04
Increase
10/15/04
Decrease
03/24/05
Increase
04/15/05
Increase
d. When the index crosses through its moving average from below, as in part (b) above,
this is regarded as a bullish signal. However, in our sample, the index is as likely to
increase as it is to decrease following such a signal. When the index crosses through

12-7
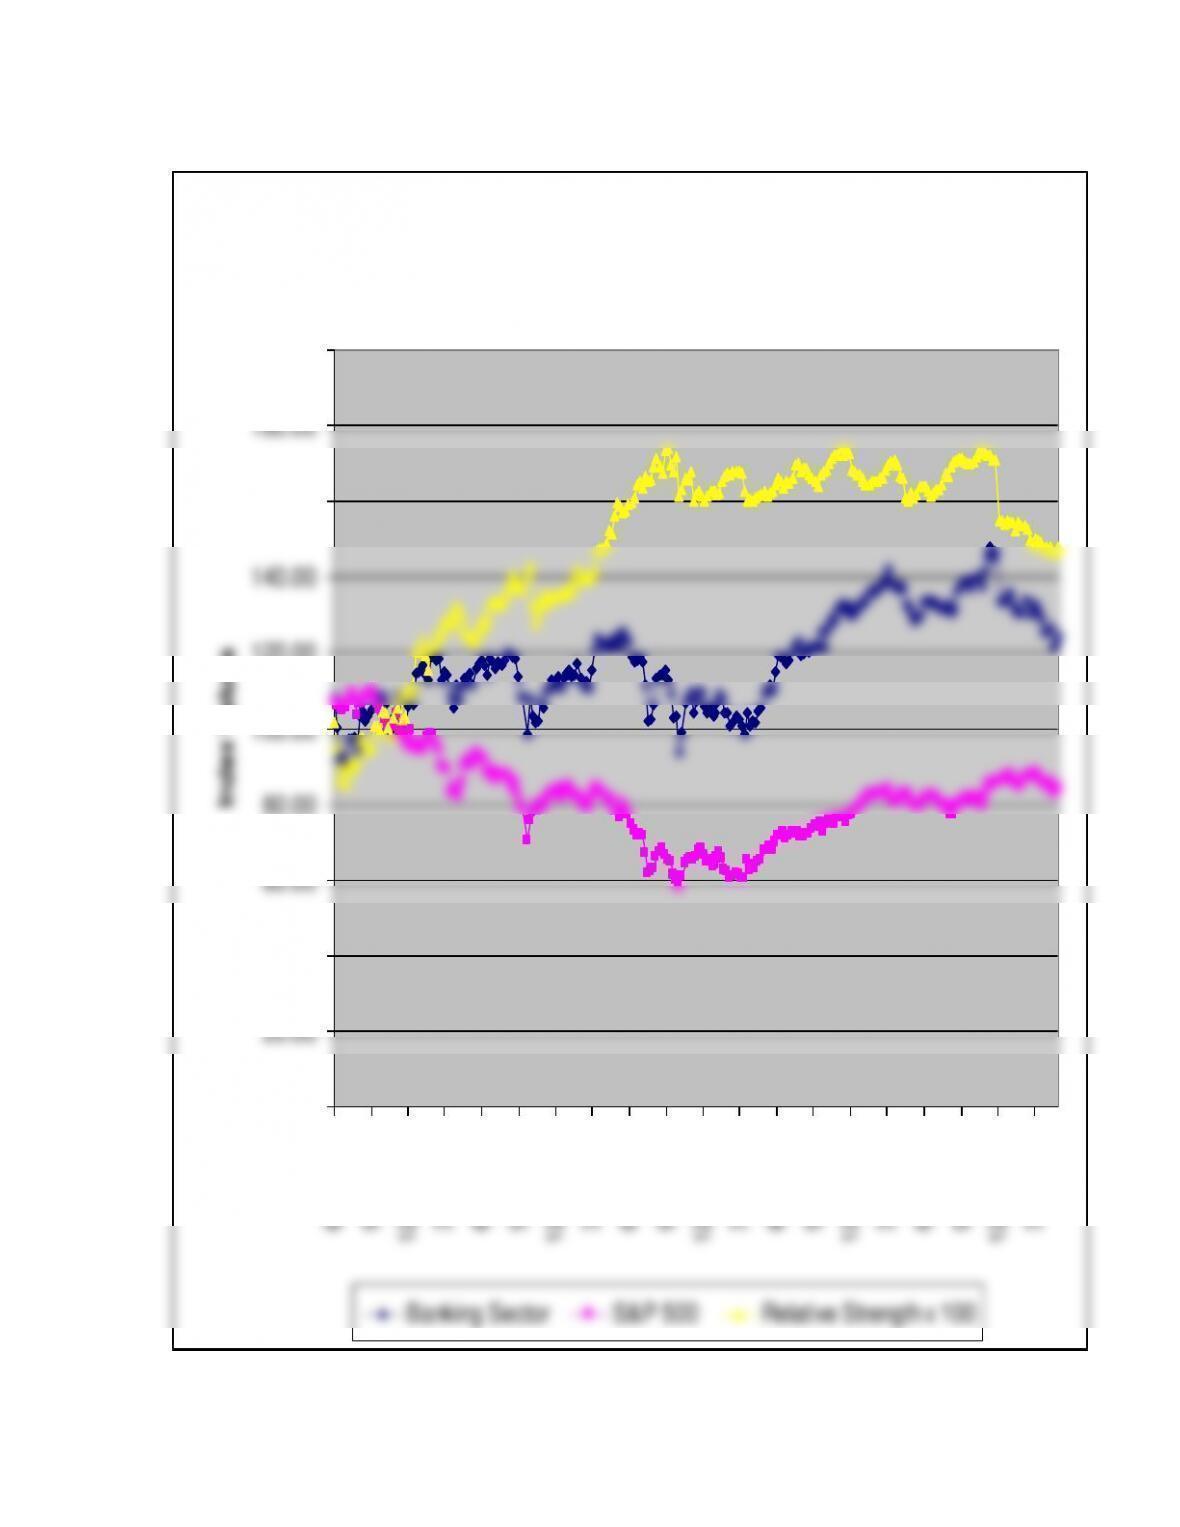
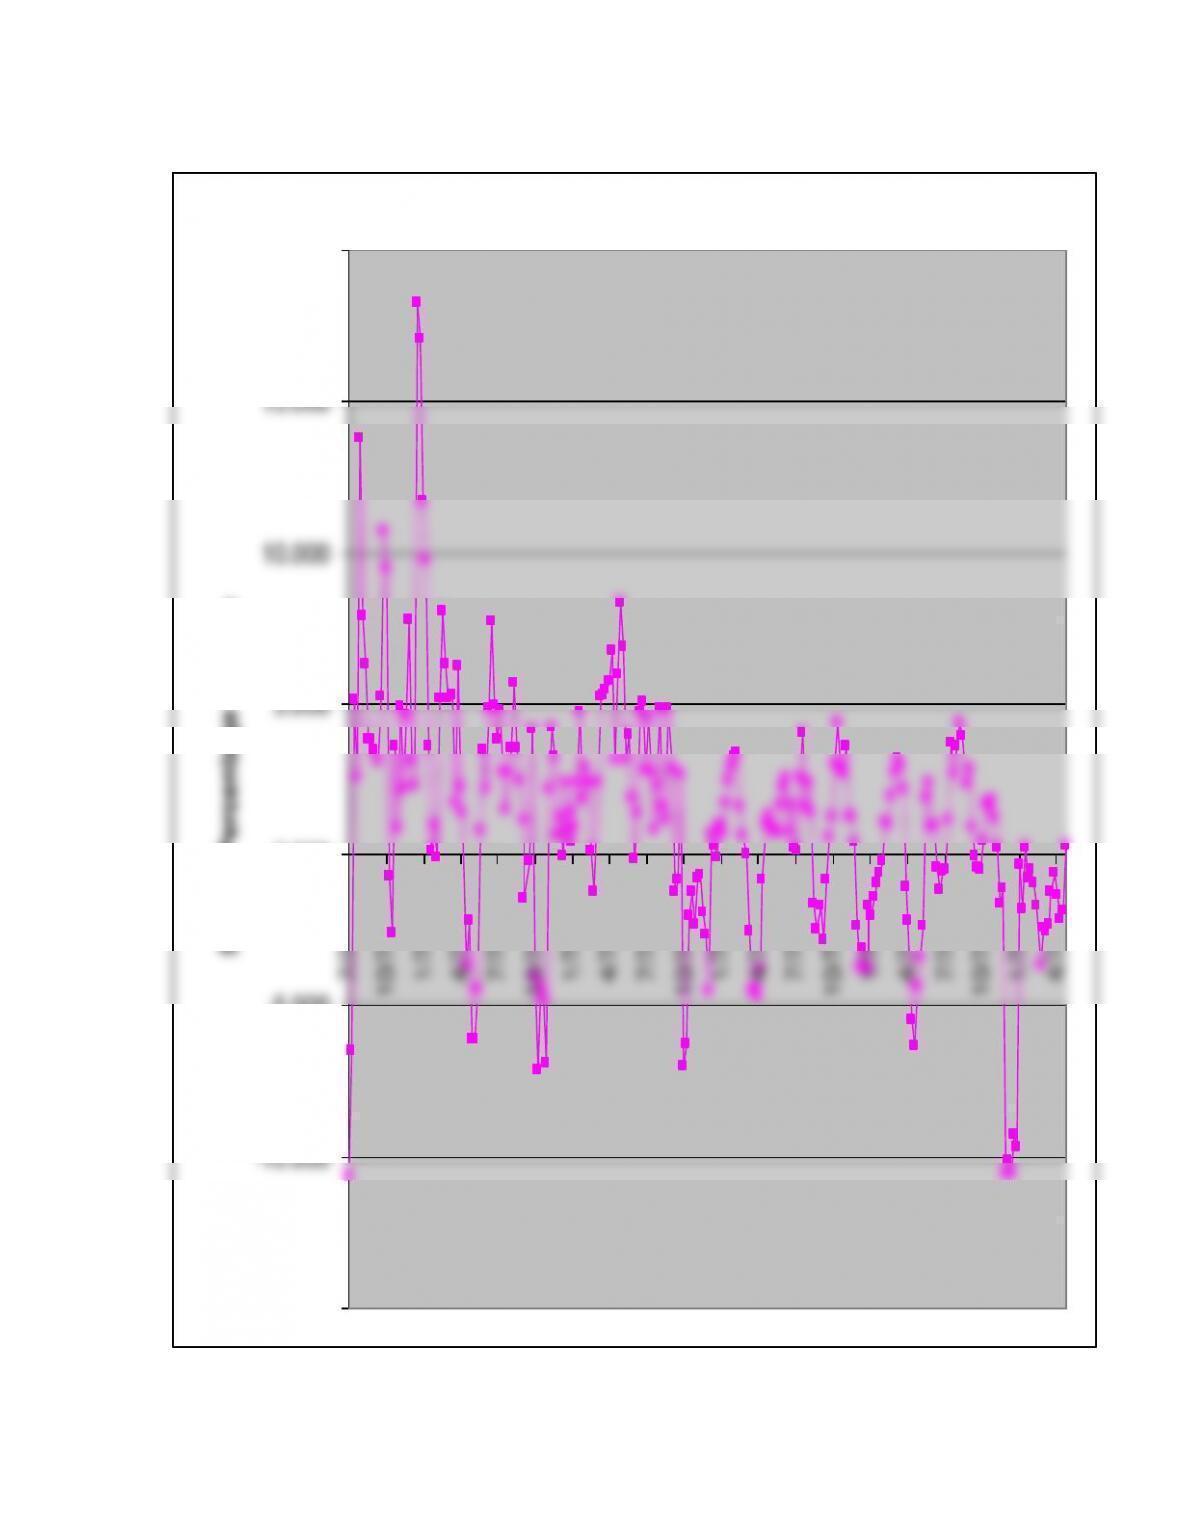
17. [Note: In order to create the relative strength measure, we first converted the weekly
returns for the Fidelity Banking Fund and for the S&P 500 to weekly index values,
using a base of 100 for the week prior to the first week of the data set. The graph on the
next page shows the resulting Fidelity Banking Fund values and the S&P 500 values,
along with the Relative Strength measure (multiplied by 100). The graph on the
following page shows the percentage change in the Relative Strength measure over 5-
week intervals.]
a. The graphs on the next two pages summarize the relative strength data for the
Fidelity Banking Fund.
b. Over five-week intervals, relative strength increased by more than 5% twenty-nine
times, as indicated in the table below. The Fidelity Banking Fund underperformed
the S&P 500 index eighteen times and outperformed the S&P 500 index eleven
times in weeks following an increase of more than 5%.
Date of
Increase
Performance of
Banking Fund in
subsequent week
07/21/00
Outperformed
08/04/00
Outperformed
08/11/00
Underperformed
08/18/00
Outperformed
09/22/00
Outperformed
09/29/00
Underperformed
10/06/00
Underperformed
12/01/00
Underperformed
12/22/00
Underperformed
12/29/00
Outperformed
01/05/01
Underperformed
01/12/01
Underperformed
02/16/01
Underperformed
02/23/01
Outperformed
03/02/01
Underperformed
03/09/01
Outperformed
03/16/01
Underperformed
03/30/01
Underperformed
06/22/01
Underperformed
08/17/01
Underperformed
03/15/02
Outperformed
03/22/02
Underperformed
03/28/02
Outperformed
04/05/02
Outperformed
04/12/02
Underperformed
04/26/02
Outperformed
05/03/02
Underperformed
05/10/02
Underperformed
06/28/02
Underperformed
Chapter 12 – Behavioral Finance and Technical Analysis
Banking Sector / S&P500 /
Relative Strength
0.00
20.00
40.00
60.00
80.00
100.00
120.00
140.00
160.00
180.00
200.00
6/2/2000
9/2/2000
12/2/2000
3/2/2001
6/2/2001
9/2/2001
12/2/2001
3/2/2002
6/2/2002
9/2/2002
12/2/2002
3/2/2003
6/2/2003
9/2/2003
12/2/2003
3/2/2004
6/2/2004
9/2/2004
12/2/2004
3/2/2005
Index Values
Banking Sector S&P 500 Relative Strength x 100
Chapter 12 – Behavioral Finance and Technical Analysis
Relative Strength 5–week % Change
–5.000
0.000
5.000
10.000
15.000
20.000
7/7/2000
10/7/2000
1/7/2001
4/7/2001
7/7/2001
10/7/2001
1/7/2002
4/7/2002
7/7/2002
10/7/2002
1/7/2003
4/7/2003
7/7/2003
10/7/2003
1/7/2004
4/7/2004
7/7/2004
10/7/2004
1/7/2005
4/7/2005
5-week Percentage Change

Chapter 12 – Behavioral Finance and Technical Analysis
12–10
c. Over five-week intervals, relative strength decreases by more than 5% fifteen
times, as indicated in the table below. The Fidelity Banking Fund underperformed
the S&P 500 index six times and outperformed the S&P 500 index nine times in
weeks following a decrease of more than 5%.
Date of
Decrease
Performance of
Banking Fund in
subsequent week
07/07/00
Underperformed
07/14/00
Outperformed
05/04/01
Underperformed
05/11/01
Outperformed
10/12/01
Outperformed
11/02/01
Outperformed
10/04/02
Outperformed
10/11/02
Outperformed
04/16/04
Underperformed
04/23/04
Outperformed
12/03/04
Outperformed
12/10/04
Underperformed
12/17/04
Outperformed
12/23/04
Underperformed
12/31/04
Underperformed
1. i. Mental accounting is best illustrated by Statement #3. Sampson’s requirement that
his income needs be met via interest income and stock dividends is an example of

Chapter 12 – Behavioral Finance and Technical Analysis
12–11
ii. Overconfidence (illusion of control) is best illustrated by Statement #6. Sampson’s
desire to select investments that are inconsistent with his overall strategy indicates
iii. Reference dependence is best illustrated by Statement #5. Sampson’s desire to
retain poor performing investments and to take quick profits on successful
investments suggests reference dependence. Reference dependence holds that
investment decisions are critically dependent on the decision-maker’s reference
2. a. Frost’s statement is an example of reference dependence. His inclination to sell the
international investments once prices return to the original cost depends not only on
the terminal wealth value, but also on where he is now, that is, his reference point.
In standard finance, alternatives are evaluated in terms of terminal wealth values or
final outcomes, not in terms of gains and losses relative to some reference point such as
original cost.
b. Frost’s statement is an example of susceptibility to cognitive error, in at least two
ways. First, he is displaying the behavioral flaw of overconfidence. He likely is
more confident about the validity of his conclusion than is justified by his rate of
success. He is very confident that the past performance of Country XYZ indicates
Individuals are typically more confident about the validity of their conclusions
than is justified by their success rate or by the principles of standard finance,
especially with regard to relevant time horizons. In standard finance, investors
know that five years of returns on Country XYZ securities relative to all other
markets provide little information about future performance. A standard finance

Chapter 12 – Behavioral Finance and Technical Analysis
12–12
c. Frost’s statement is an example of mental accounting. Mental accounting holds
that investors segregate money into mental accounts (e.g., safe versus speculative),
maintain a set of separate mental accounts, and do not combine outcomes; a loss in
one account is treated separately from a loss in another account. One manifestation
of mental accounting, in which Frost is engaging, is building a portfolio as a
In standard finance, decisions consider the risk and return profile of the entire
portfolio rather than anticipated gains or losses on any particular account,
investment, or class of investments. Alternatives should be considered in terms of
3. a. Illusion of knowledge: Maclin believes he is an expert on, and can make accurate
forecasts about, the real estate market solely because he has studied housing
market data on the Internet. He may have access to a large amount of real estate-
related information, but he may not understand how to analyze the information nor
have the ability to apply it to a proposed investment.
b. Reference point: Maclin’s reference point for his bond position is the purchase price,
as evidenced by the fact that he will not sell a position for less than he paid for it.
This fixation on a reference point, and the subsequent waiting for the price of the
security to move above that reference point before selling the security, prevents
Maclin from undertaking a risk/return-based analysis of his portfolio position.

Chapter 12 – Behavioral Finance and Technical Analysis
12–13
c. Familiarity: Maclin is evaluating his holding of company stock based on his
familiarity with the company rather than on sound investment and portfolio
4. a. The behavioral finance principle of biased expectations/overconfidence is most
consistent with the investor’s first statement. Petrie stock provides a level of confidence
and comfort for the investor because of the circumstances in which she acquired the
stock and her recent history with the returns and income from the stock. However, the
b. The behavioral finance principle of mental accounting is most consistent with the
investor’s second statement. The investor has segregated the monies distributed
from the Trust into two “accounts”: the returns the Trust receives from the Petrie
5. i. Overconfidence (Biased Expectations and Illusion of Control): Pierce is basing her
investment strategy for supporting her parents on her confidence in the economic
forecasts. This is a cognitive error reflecting overconfidence in the form of both biased

Chapter 12 – Behavioral Finance and Technical Analysis
12–14
Standard finance investors understand that individuals typically have greater
confidence in the validity of their conclusions than is justified by their success rate.
The calibration paradigm, which compares confidence to predictive ability, suggests
that there is significantly lower probability of success than the confidence levels
reported by individuals. In addition, standard finance investors know that recent
performance provides little information about future performance and are not deceived
by this “law of small numbers.”
ii. Loss Aversion (Risk Seeking): Pierce is exhibiting risk aversion in deciding to sell the
Core Bond Fund despite its gains and favorable prospects. She prefers a certain gain
over a possibly larger gain coupled with a smaller chance of a loss. Pierce is exhibiting
loss aversion (risk seeking) by holding the High Yield Bond Fund despite its uncertain
prospects. She prefers the modest possibility of recovery coupled with the chance of a
larger loss over a certain loss. People tend to exhibit risk seeking, rather than risk
iii. Reference Dependence: Pierce’s inclination to sell her Small Company Fund once
it returns to her original cost is an example of reference dependence. Her sell
decision is predicated on the current value as related to original cost, her reference
point. Her decision does not consider any analysis of expected terminal value or