Chapter 12
Global Performance Evaluation
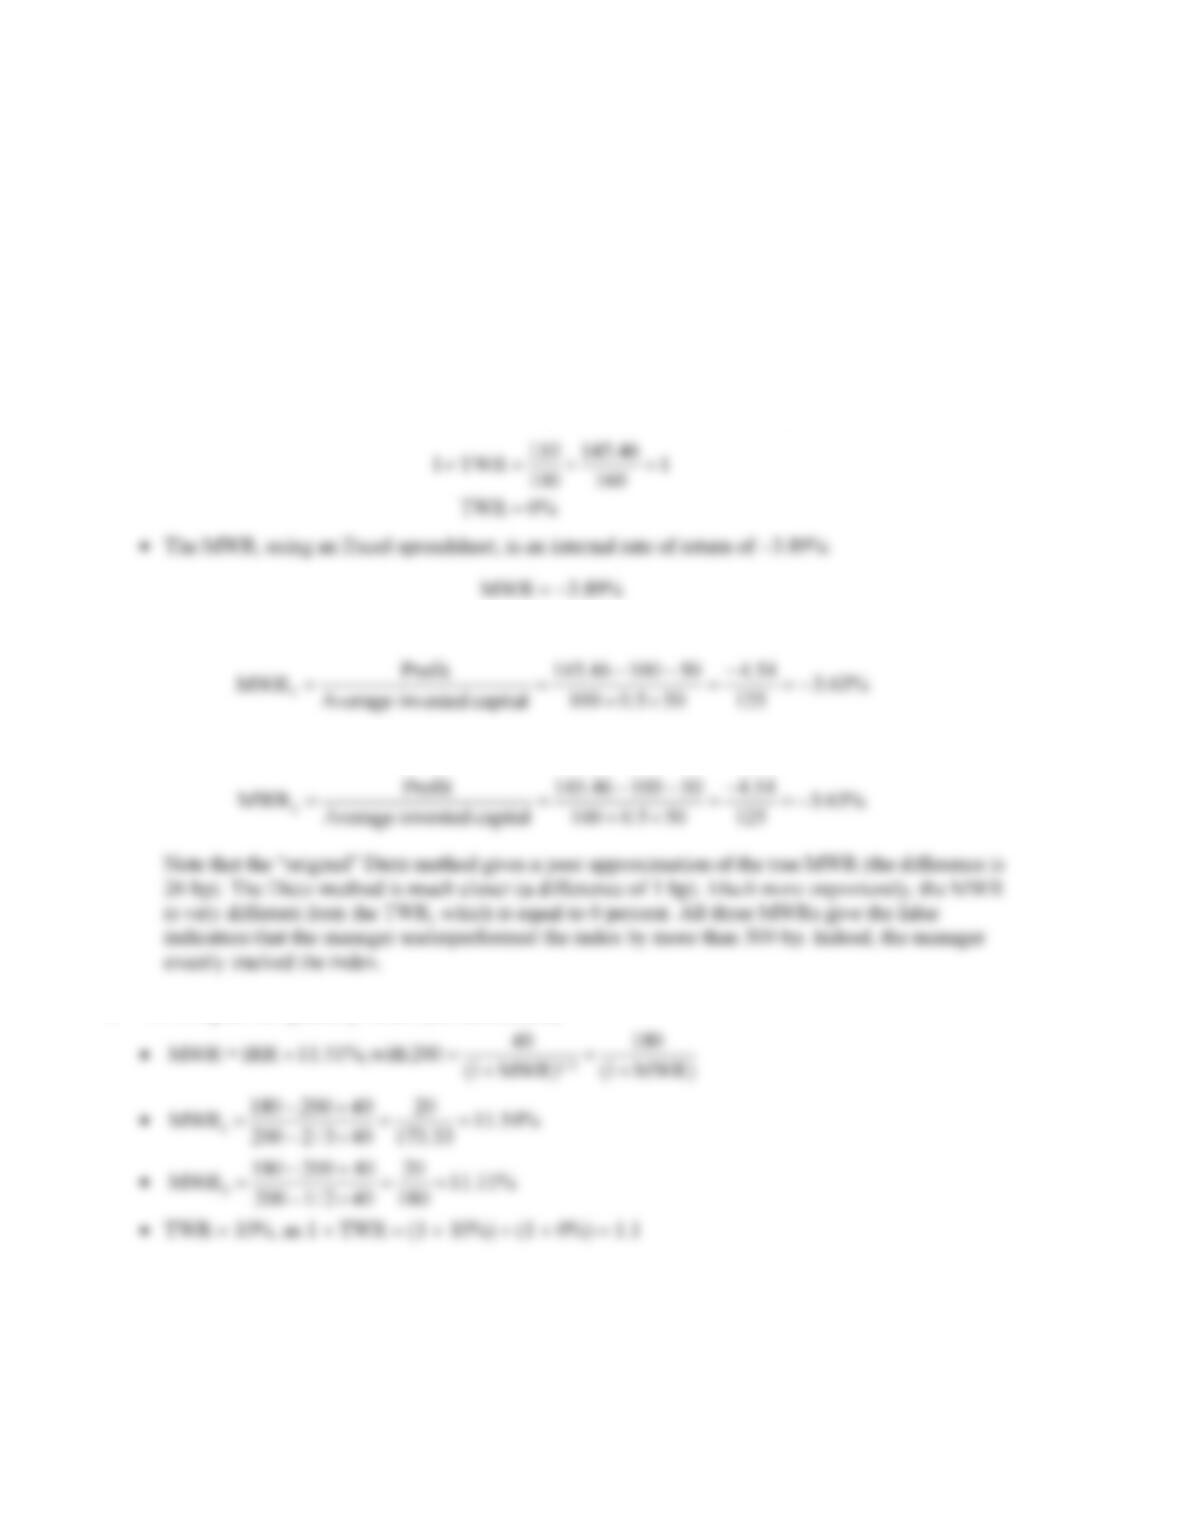
1. • The return on the index is zero, as is the properly calculated TWR of the portfolio:
• The Dietz method gives an approximation to the MWR of
• The “original” Dietz method gives an approximation to the MWR of
2. We compute the quarterly return (not annualized):
Chapter 12 Global Performance Evaluation 79
3. We compute the monthly return (not annualized):
4. For the active manager, a portfolio turnover (sell and buy) of twice a year implies transactions costs
of (4)(0.015) = 0.06. Thus, transactions costs and fees amount to 6% + 0.75% = 6.75%
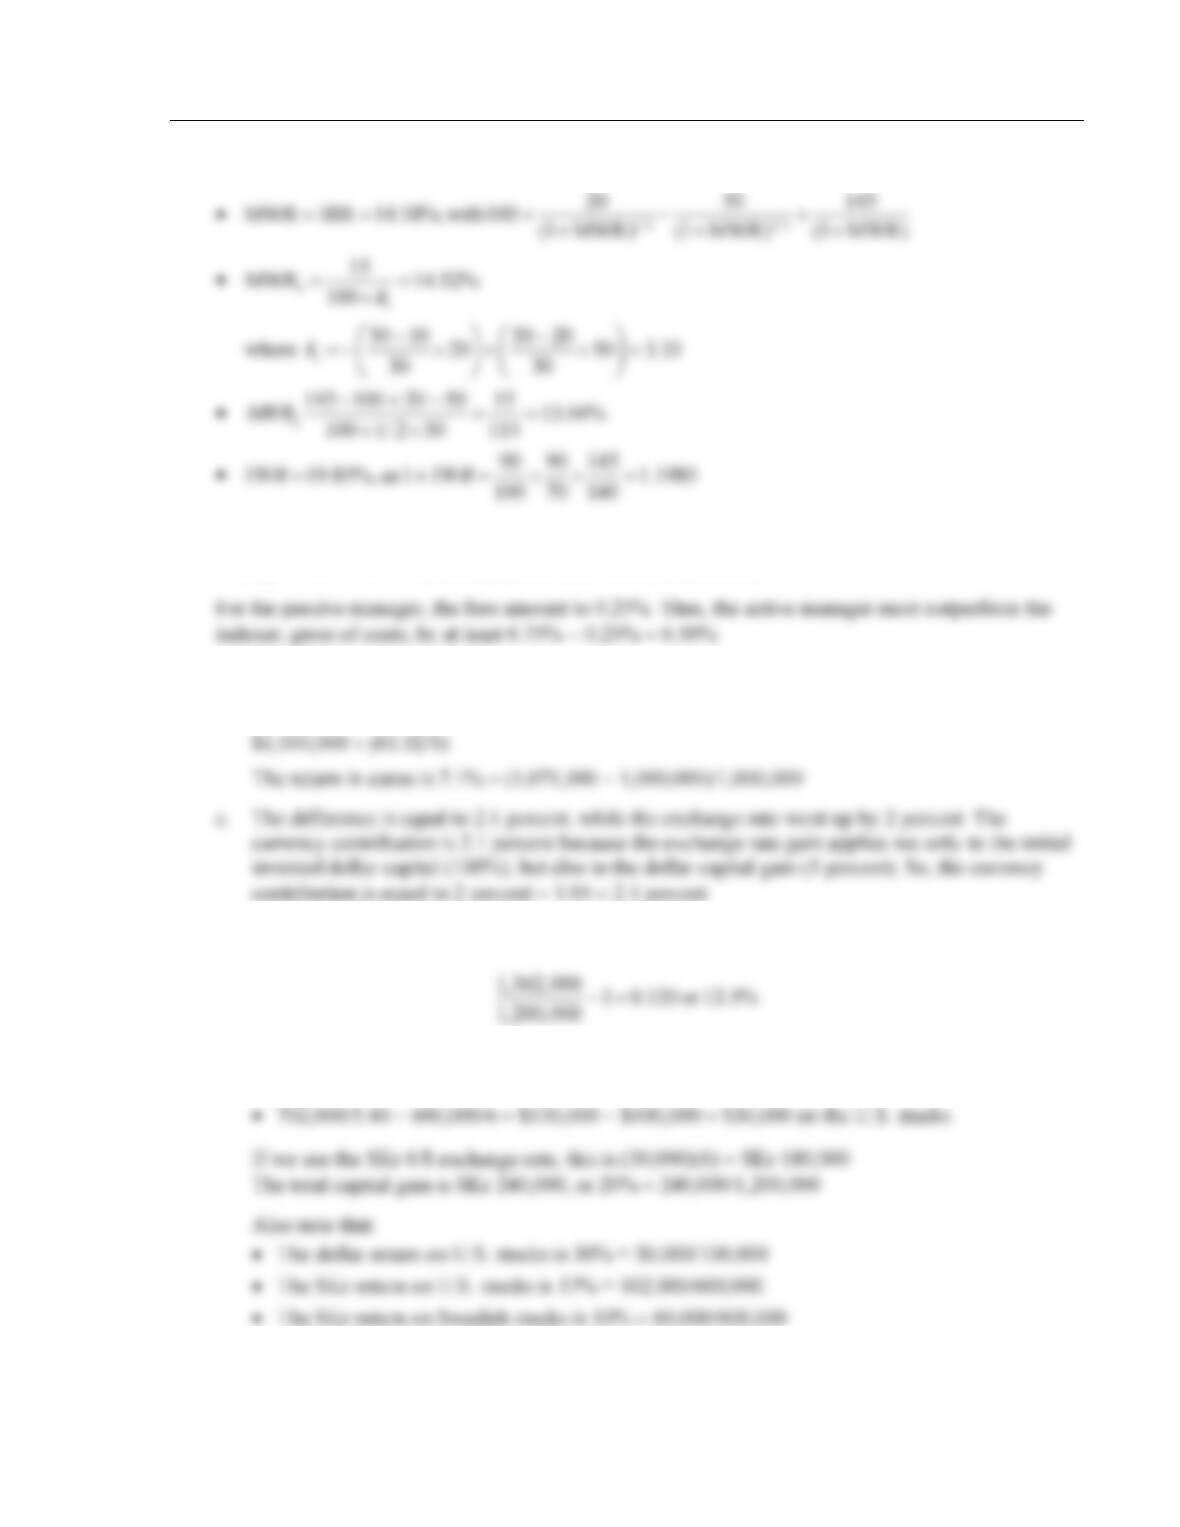
5. a. The return in dollars is 5% = (1,050,000 − 1,000,000)/1,000,000
b. The value of the portfolio moves from €1,000,000 = $1,000,000(€1/$) to €1,071,000 =
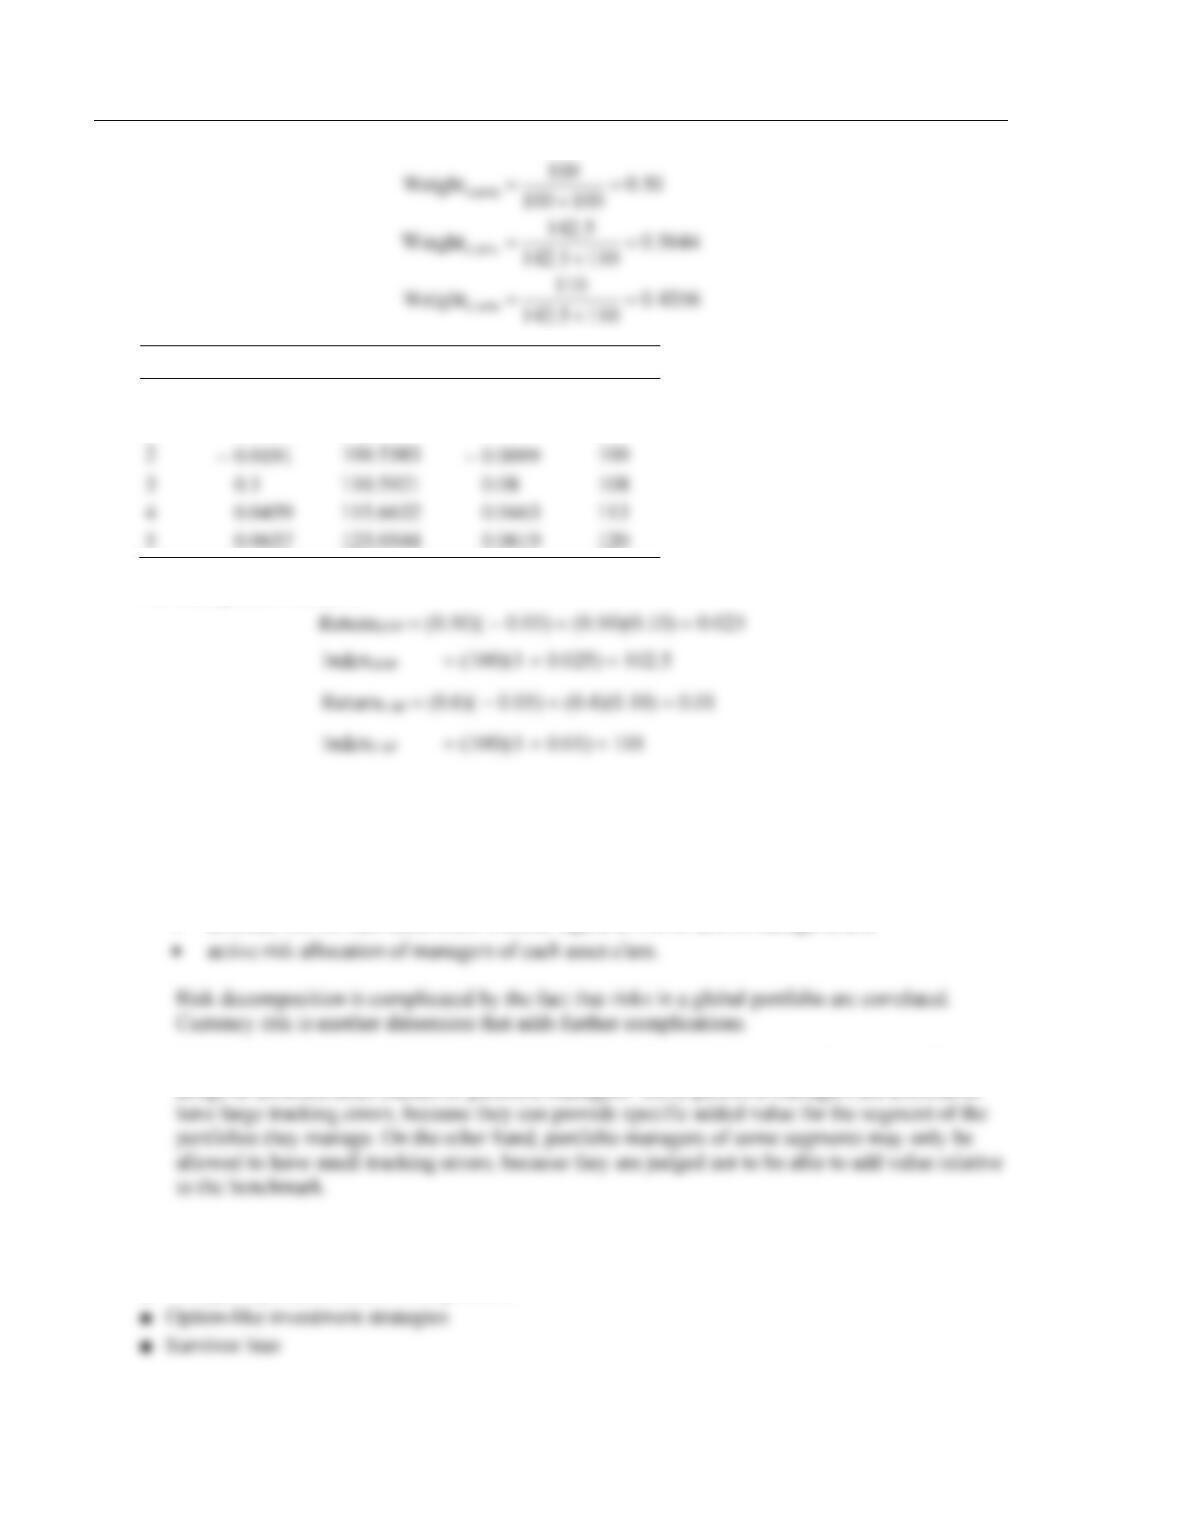
6. a. The total return on the portfolio, measured in SKr is equal to
b. The capital gain amounts to
• 660,000 − 600,000 = SKr 60,000 on the Swedish stocks, or 10%
80 Solnik/McLeavey • Global Investments, Sixth Edition
The capital gain is in local currency = (0.5)(0.30) + (0.5)(0.10) = 0.20 = 20%
The currency contribution can be calculated as follows:
The total return can be decomposed as follows:
c. If the same amounts had been invested respectively in the OMX index and in the S&P index,
returns would have been the following:
• 20% on the Swedish index
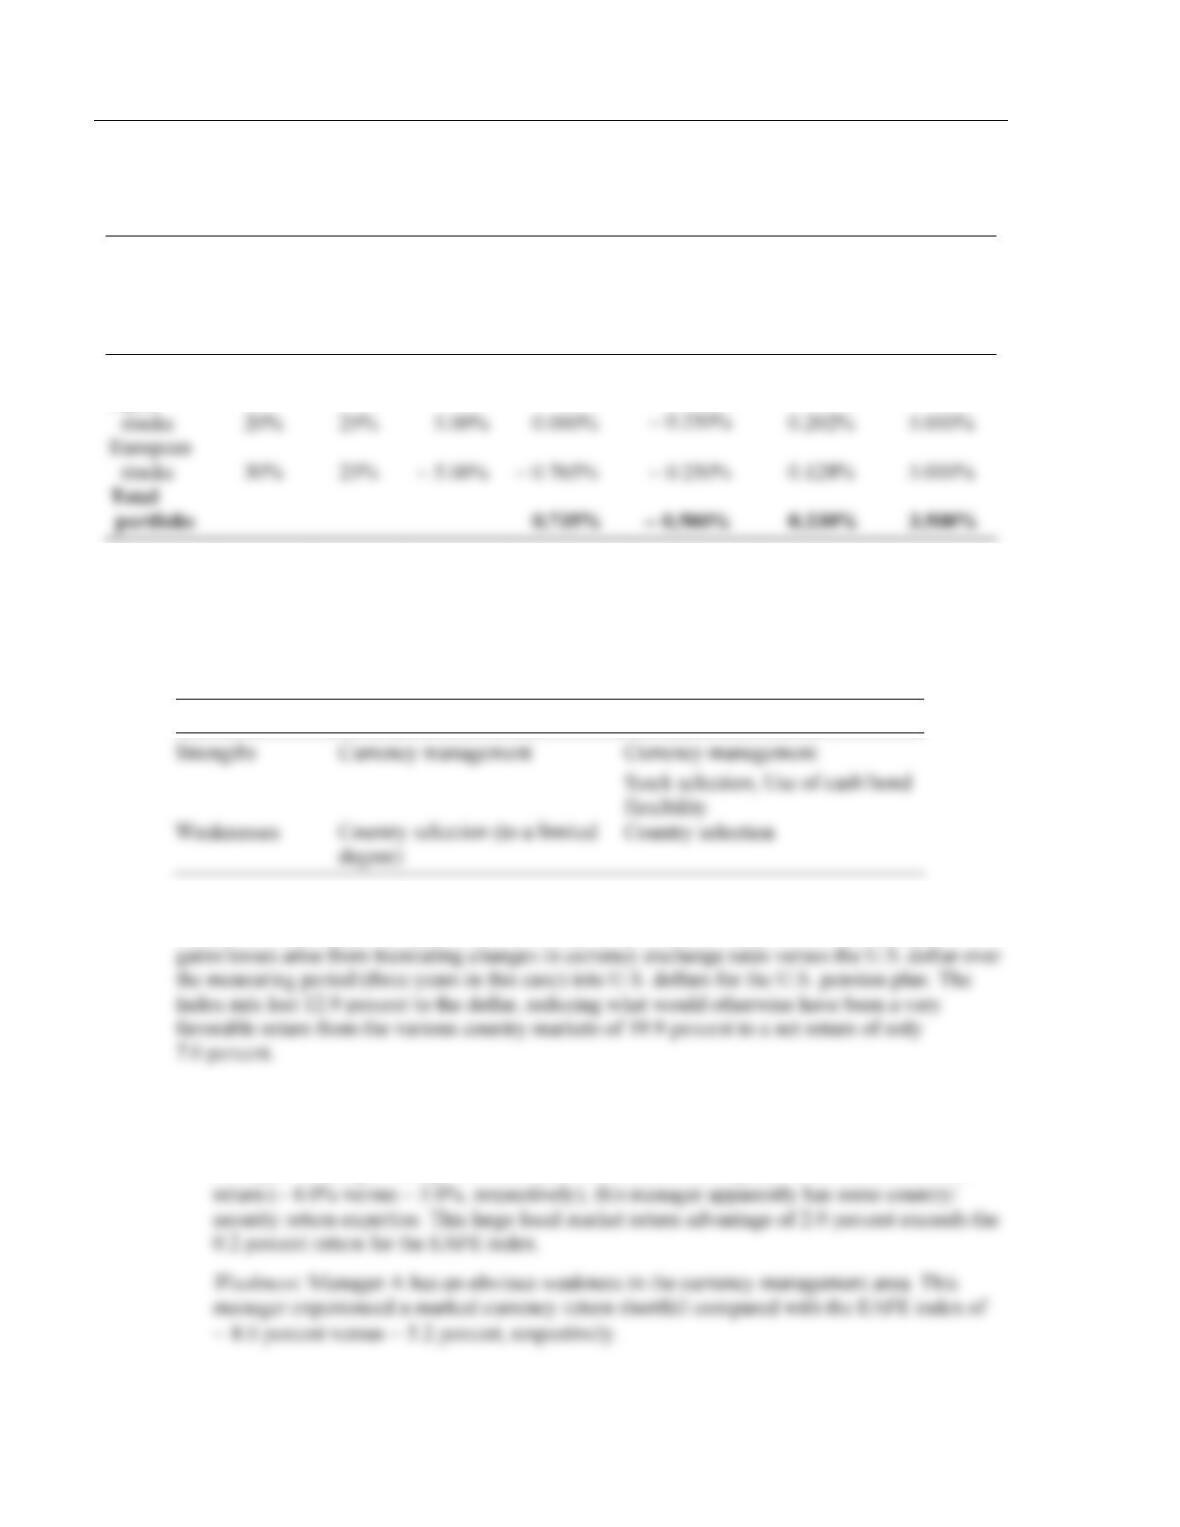
7. Calculations are summarized in the following table:
Global Equity Portfolio: Total Return Decomposition
(1)
(2)
(3)
(4)
(5)
(6)
(7)
Portfolio
Weights
Rate of
Return in $
Capital Gain in
Local Currency
Currency
Contribution
Market
Index
Security
Selection
Currency
Contribution
U.S. stocks
50%
5.000%
5.000%
0.000%
3.000%
2.000%
0.000%
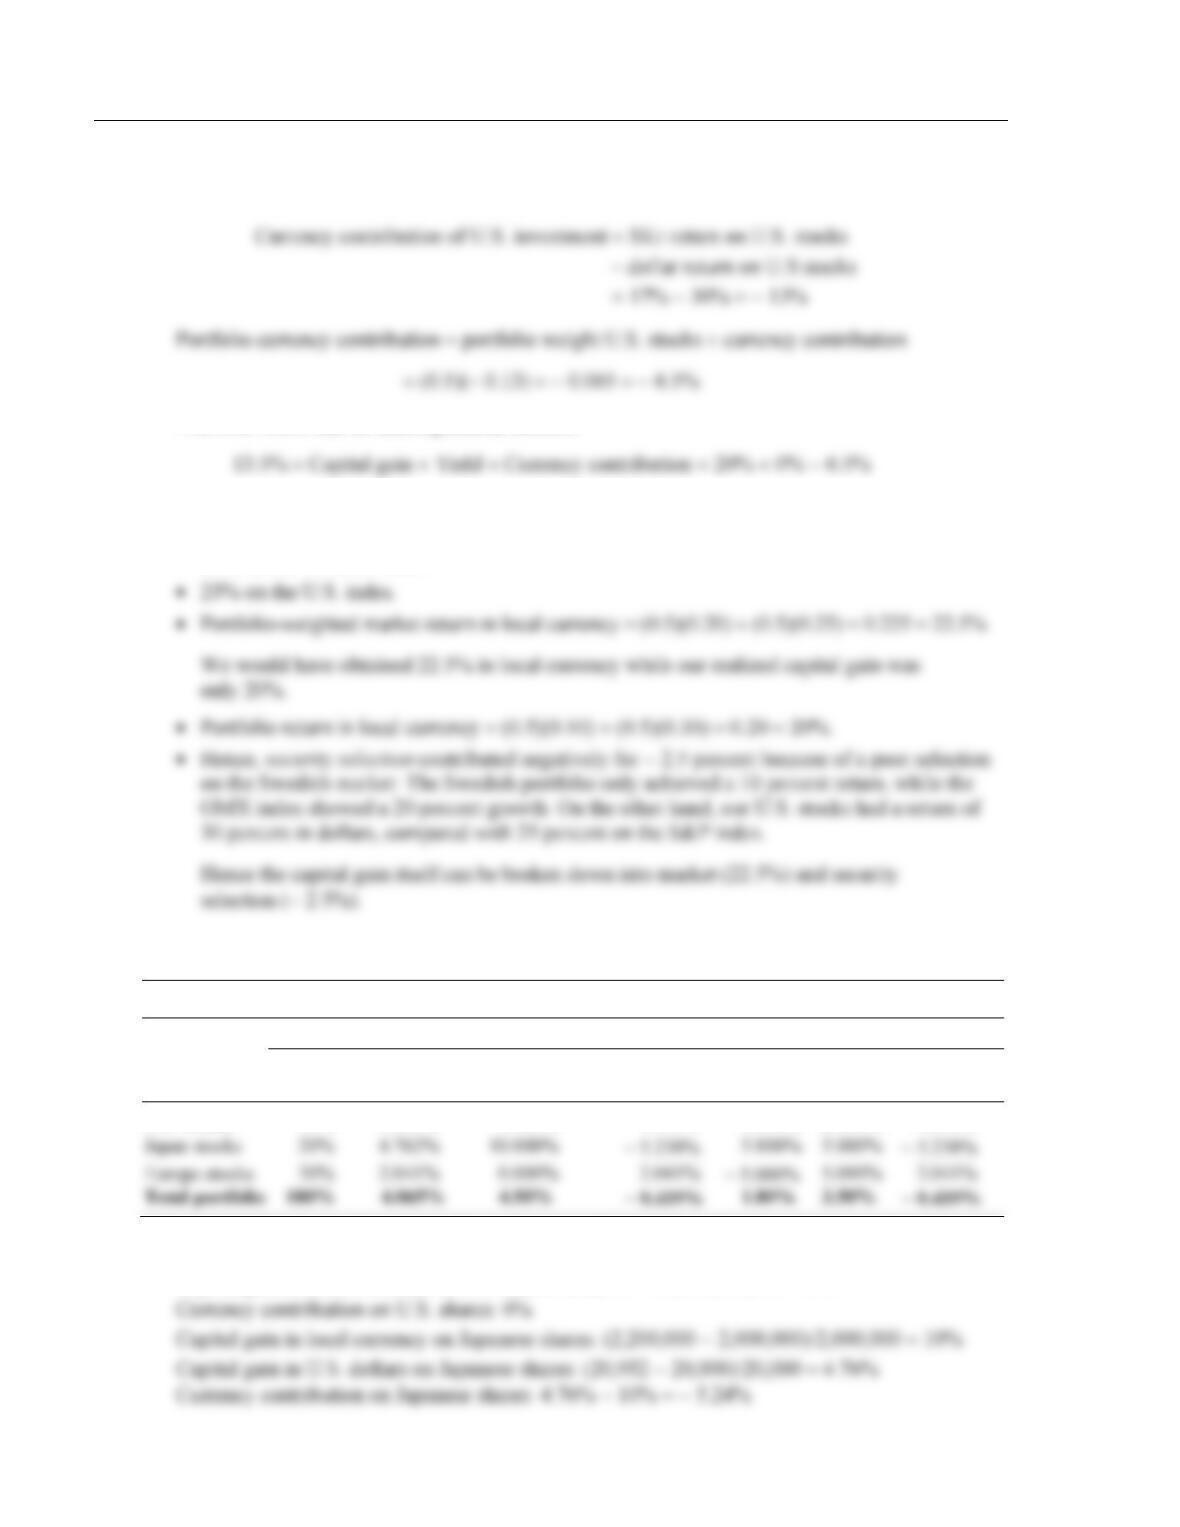
a. Total return of the portfolio: 4.065% = (0.5)(0.05) + (0.2)(0.04762) + (0.3)(0.02041)
Capital gain in local currency on U.S. shares: (52,500 − 50,000)/50,000 = 5%
Chapter 12 Global Performance Evaluation 81
b. The return in local currency of 4.50% can be decomposed as the weighted average of the index
returns (1%) and the contribution of security selection.
c. We now focus on the performance relative to the benchmark (World index). The portfolio was
overweighted in Europe (30 percent instead of 25 percent) and under-weighted in Japan
of the portfolio is good: 4.065 − 0.735 = 3.33%. It is explained as follows:
Benchmark return
0.735%
Market allocation
− 0.500%
Calculations of benchmark return and security selection have already been explained.
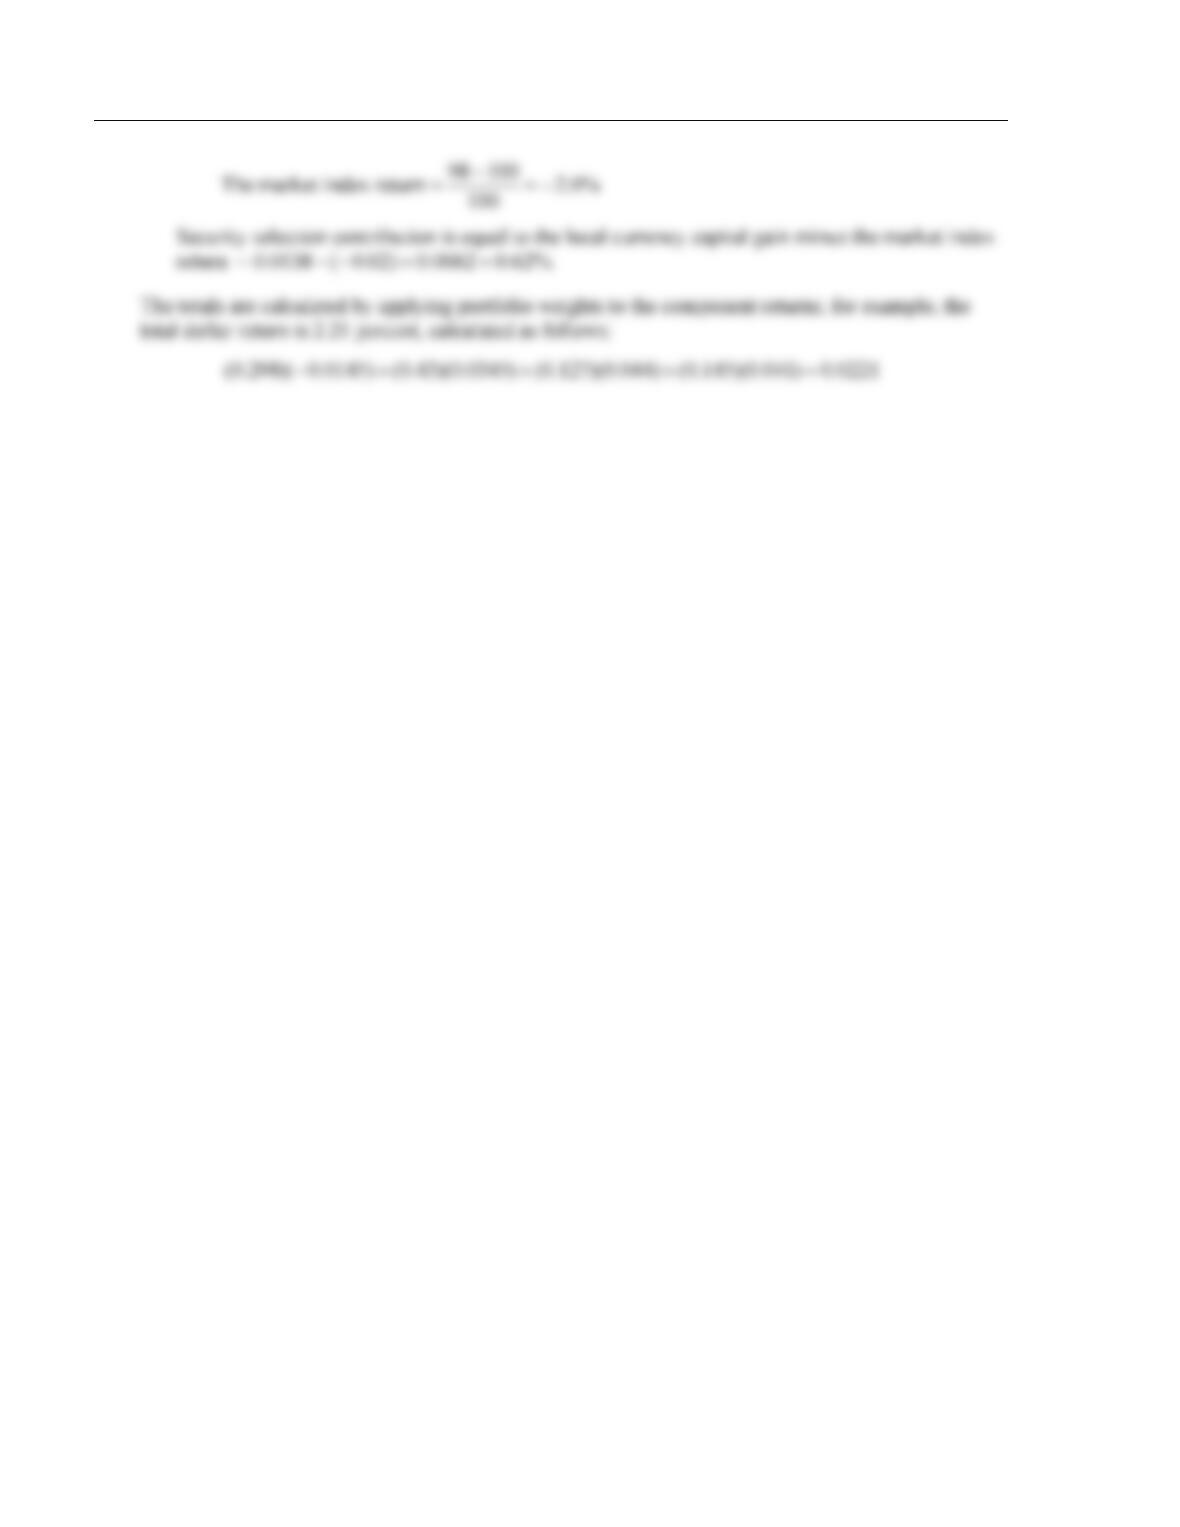
The market allocation = (0)(0.03) + (− 0.05)(0.05) + (0.05)(− 0.05) = − 0.5%
The currency allocation = − 0.435% − (− 0.765%) = 0.33%
− 0.435% is the currency contribution calculation shown in part (a). − 0.765% =
(0.25)(− 0.05) + (0.25)(0.0194)
82 Solnik/McLeavey • Global Investments, Sixth Edition
The following table summarizes the solution.
Global Equity Portfolio: Performance Attribution
Portfolio
Weights
World
Index
Weights
Index
Return in
Local
Currency
World
Index
Return in $
Market
Allocation
Contribution
Currency
Allocation
Contribution
Security
Selection
U.S. stocks
50%
50%
3.00%
1.500%
2.000%
2.000%
2.000%
Japan
8. a. Overall, both managers added value by mitigating the currency effects present in the Index. Both
exhibited an ability to “pick stocks” in the markets they chose to be in (Manager B in particular).
Manager B used his opportunities not to be in stocks quite effectively (via the cash/bond
contribution to return), but neither of them matched the passive index in picking the country
markets in which to be invested (Manager B in particular).
Manager A
Manager B
b. The column reveals the effect on performance of adjustment for movements in the U.S. dollar
relative to local currencies and, therefore, the currency effect on the portfolio. Currency
9. a. The following briefly describes one strength and one weakness of each manager.
1. Manager A
Strength: Although Manager A’s one-year total return was slightly below the EAFE index
Chapter 12 Global Performance Evaluation 83
2. Manager B
Strength: Manager B’s total return slightly exceeded that of the index, with a marked
to be weak in security/market selection ability.
b. The following strategies would enable the Fund to take advantage of the strengths of the two
managers and simultaneously minimize their weaknesses.
i. Recommendation: One strategy would be to direct Manager A to make no currency bets
ii. Recommendation: Another strategy would be to combine the portfolios of Manager A and
Manager B, with Manager A making country exposure and security selection decisions, and
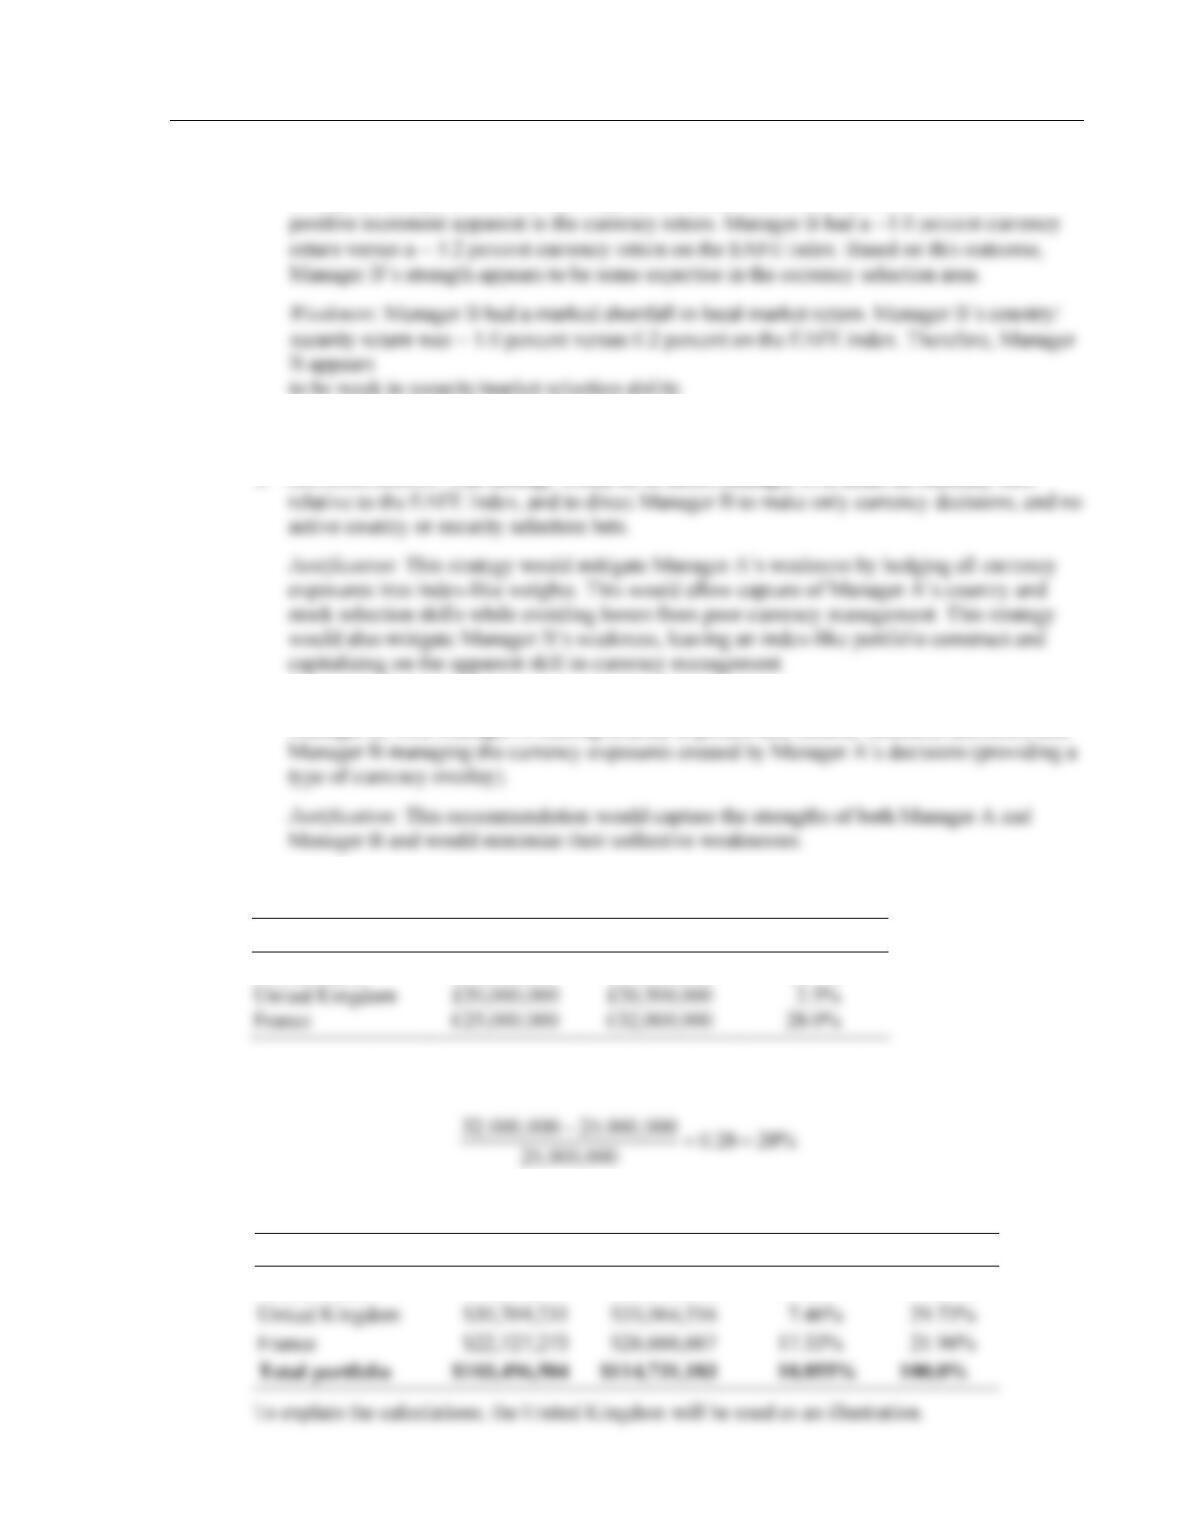
10. a. The local currency returns are shown in the following table:
Country
Dec. 31, 2006
Dec. 31, 2007
Return (%)
United States
$50,000,000
$55,000,000
10.0%
For example, the local currency return for the French portion of the portfolio is
The dollar returns and portfolio weights are shown in the following table:
Country
Dec. 31, 2006
Dec. 31, 2007
Return
Weight
United States
$50,000,000
$55,000,000
10.0%
48.31%
United Kingdom
$30,769,231
$33,064,516
29.73%
84 Solnik/McLeavey • Global Investments, Sixth Edition
First the pound values of the U.K. portion of the portfolio must be converted to dollars:
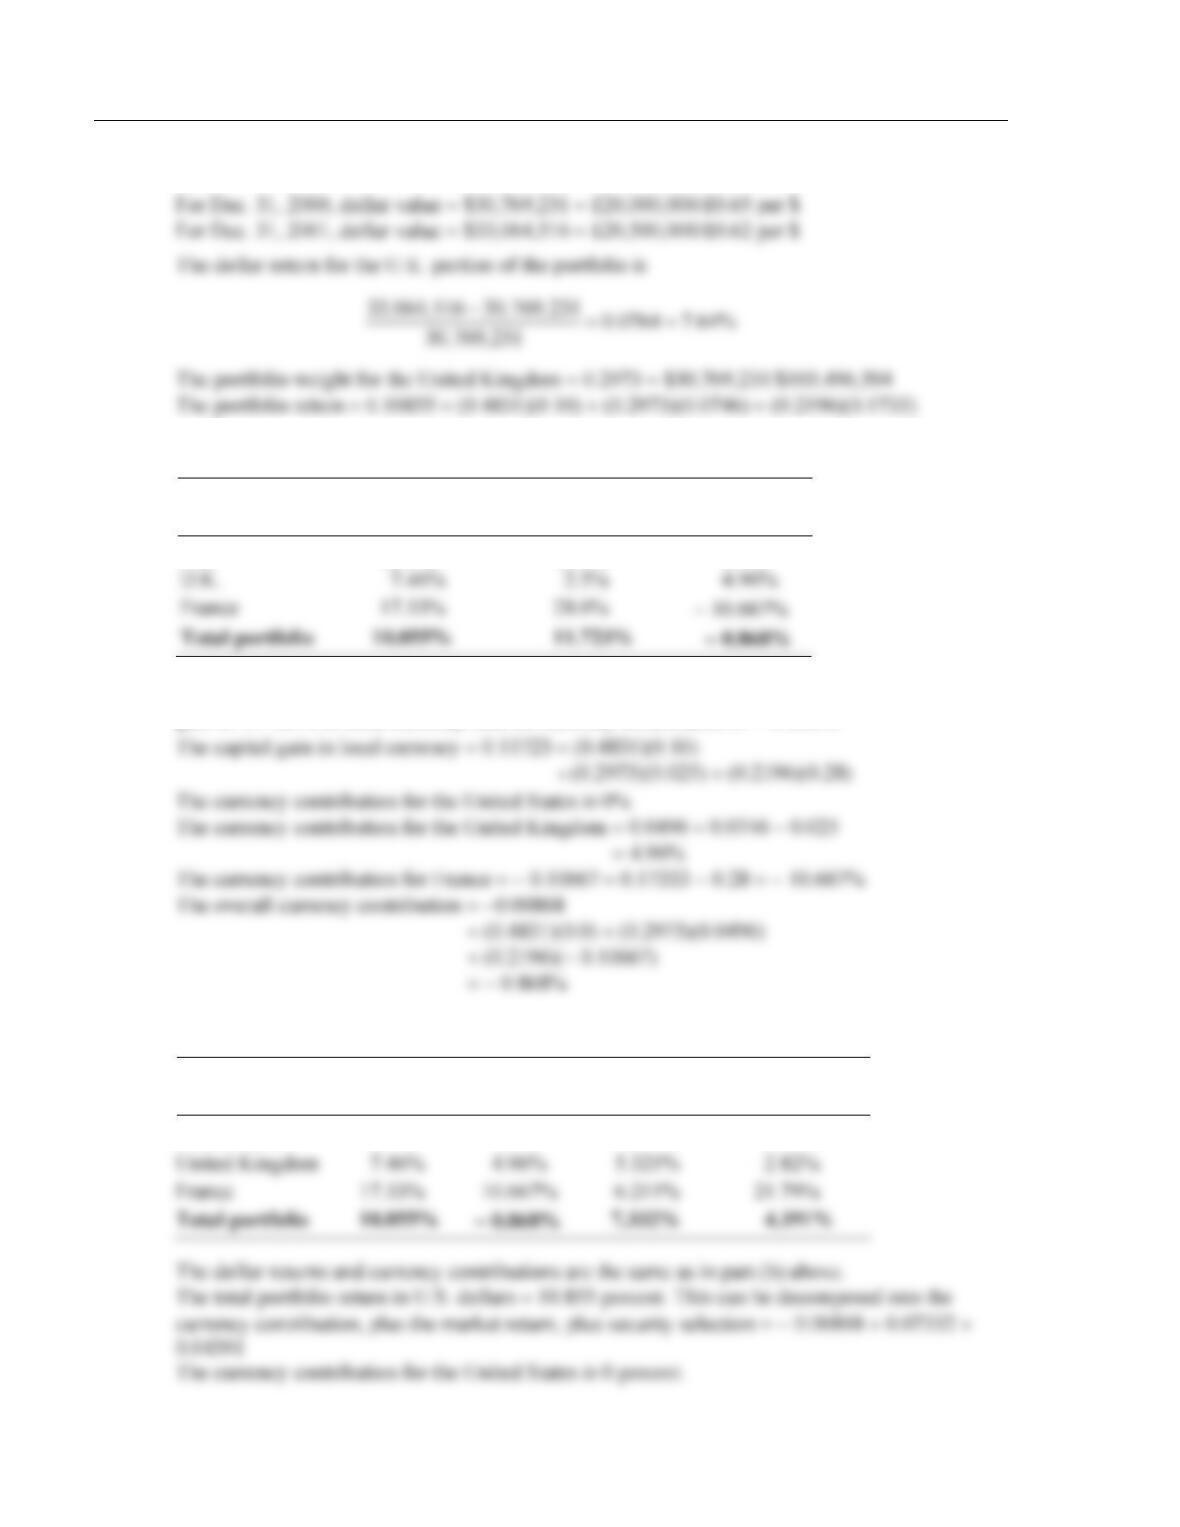
b. The total portfolio return decomposition table is shown here:
Country
Dollar Return
Capital Gain
(local currency)
Currency
Contribution
U.S.
10.0%
10.0%
0.0%
4.96%
The total portfolio return in U.S. dollars = 10.855%. This can be decomposed into the capital
gain of 11.723% in local currency, and the currency contribution of − 0.868%.
c. The total portfolio return decomposition table is shown here:
Country
Dollar
Return
Currency
Contribution
Market
Index
Security
Selection
United States
10.0%
0.0%
9.079%
0.92%
United Kingdom
4.96%
5.321%
France
17.33%
6.211%
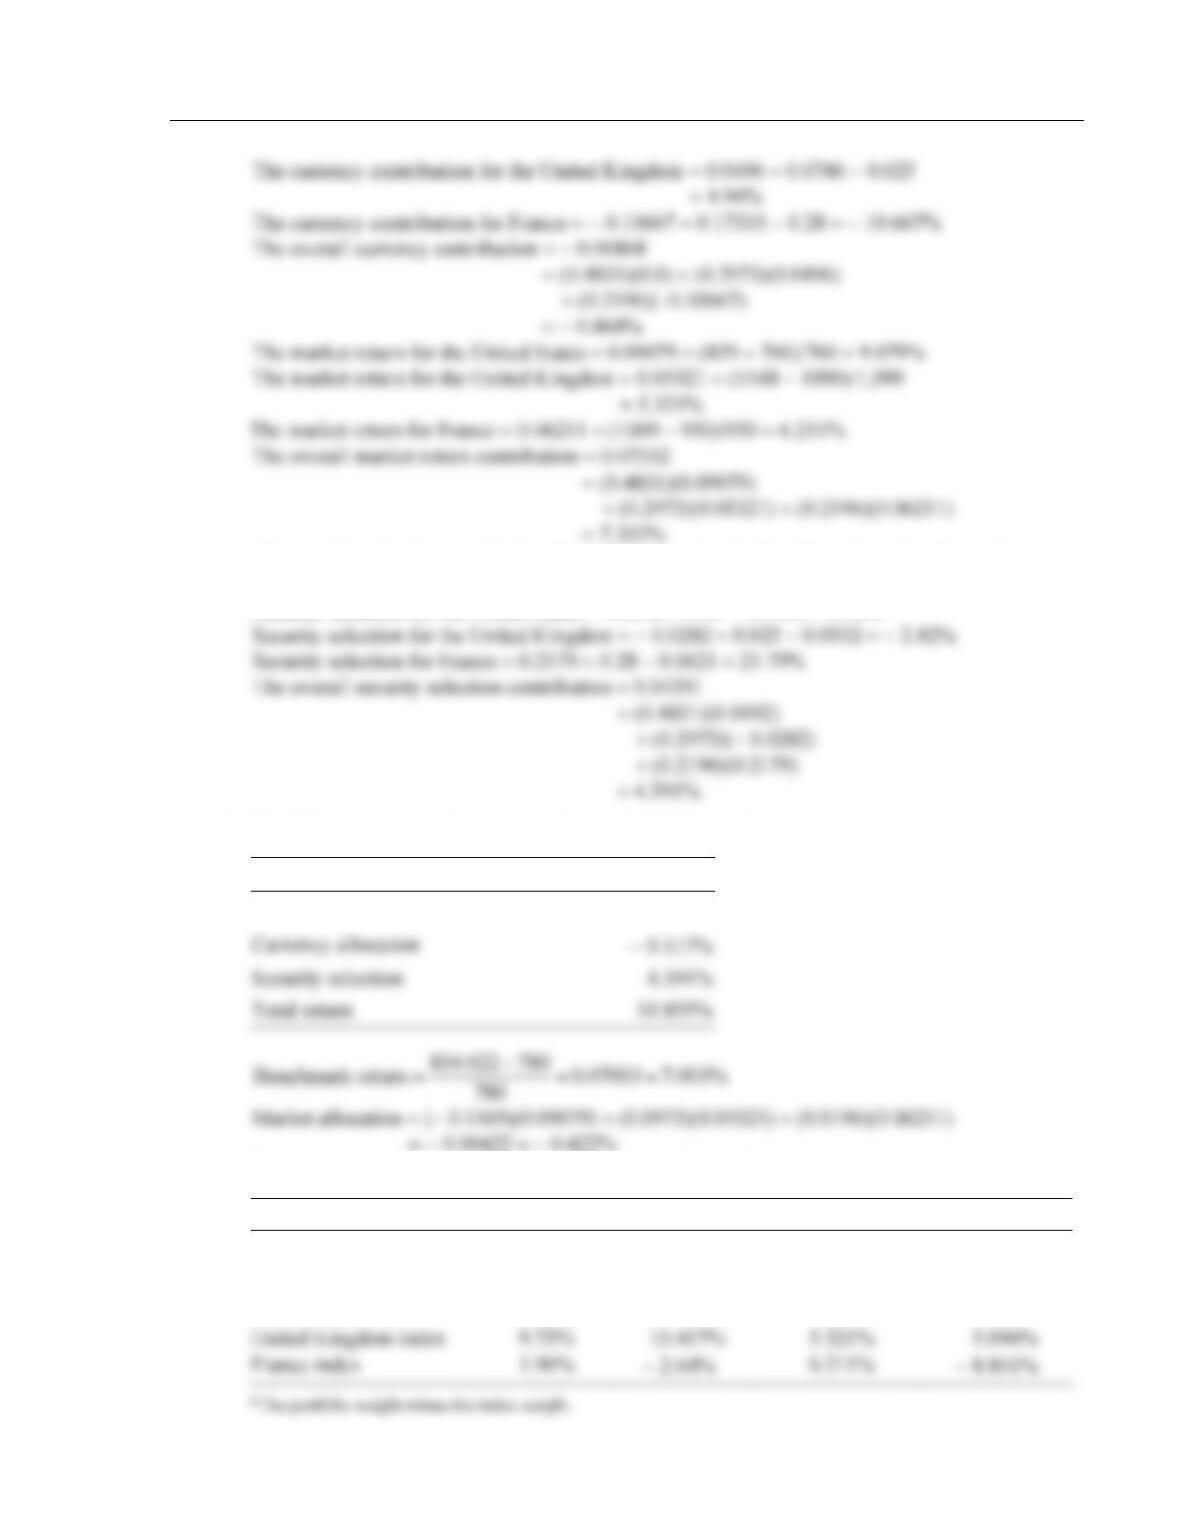
Chapter 12 Global Performance Evaluation 85
The security selection contribution for each country is calculated by subtracting the market return
from the local-currency capital gain.
Security selection for the United States = 0.0092 = 0.10 − 0.0908 = 0.92%
d. The following table indicates the global performance attribution:
Benchmark return
7.003%
Market allocation
− 0.422%
Data are obtained from the following table (Index Return Breakdown).
Index Return Breakdown
Country
Under/Over
Weight*
Dollar
Return
Capital Gain
(local currency)
Currency
Contribution
United States index
− 11.69%
9.079%
9.079%
0.0%
86 Solnik/McLeavey • Global Investments, Sixth Edition
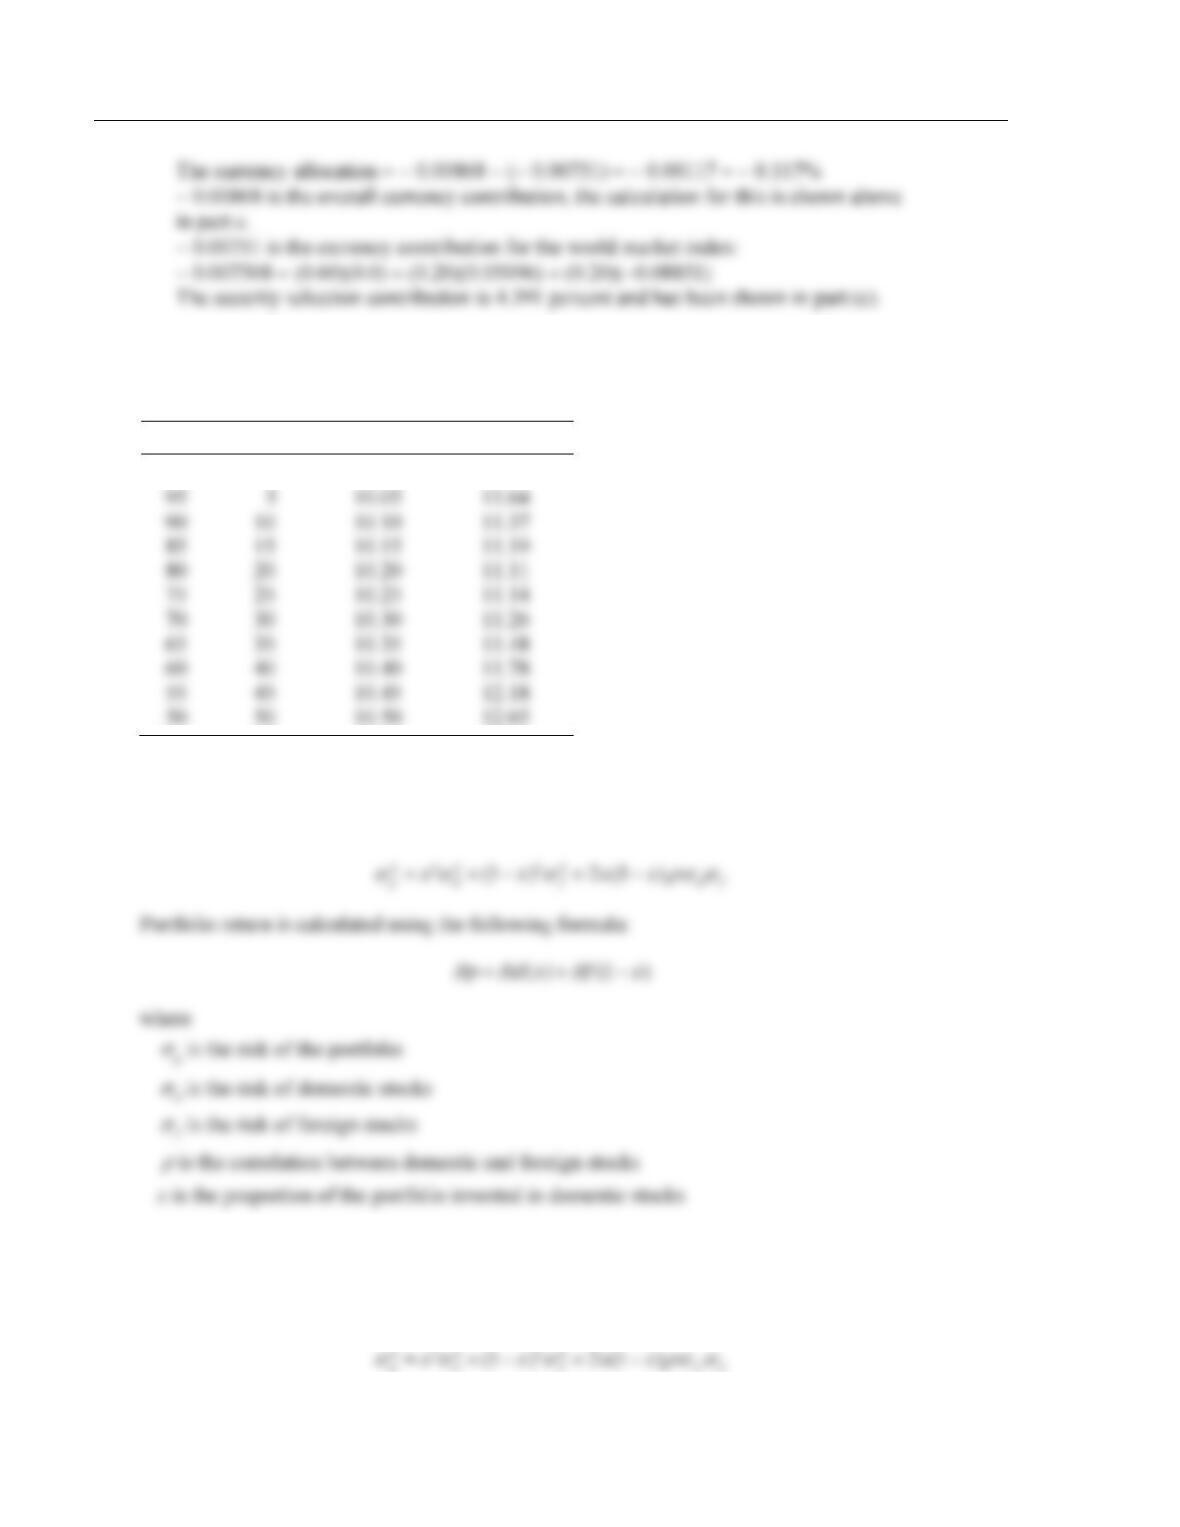
11. Yes. The return on foreign assets looks small relative to its volatility. But the risk that counts is the
contribution to the risk of the total portfolio. Here are some return-and-risk characteristics for global
portfolios with increasing proportions of foreign assets.
%U.S.
% Foreign
Return (%)
Volatility (%)
100
0
10.00
12.00
10.10
11.37
10.20
11.11
10.30
11.26
10.35
11.48
10.45
12.18
A portfolio invested 20 percent in foreign fund increases the return from 10.0 percent to 10.2 percent
and reduces the volatility from 12.0 percent to 11.1 percent. Portfolio risk is calculated using the
following formula:
12. Yes. The risk that counts is the contribution of the foreign assets to the total risk of the global
portfolio. In the proposed example, foreign stocks have a larger standard deviation (20%) than
U.S. stocks (15%). However, let’s calculate the standard deviation of the diversified portfolio
made up of 90 percent domestic stocks and 10 percent foreign stocks. We have
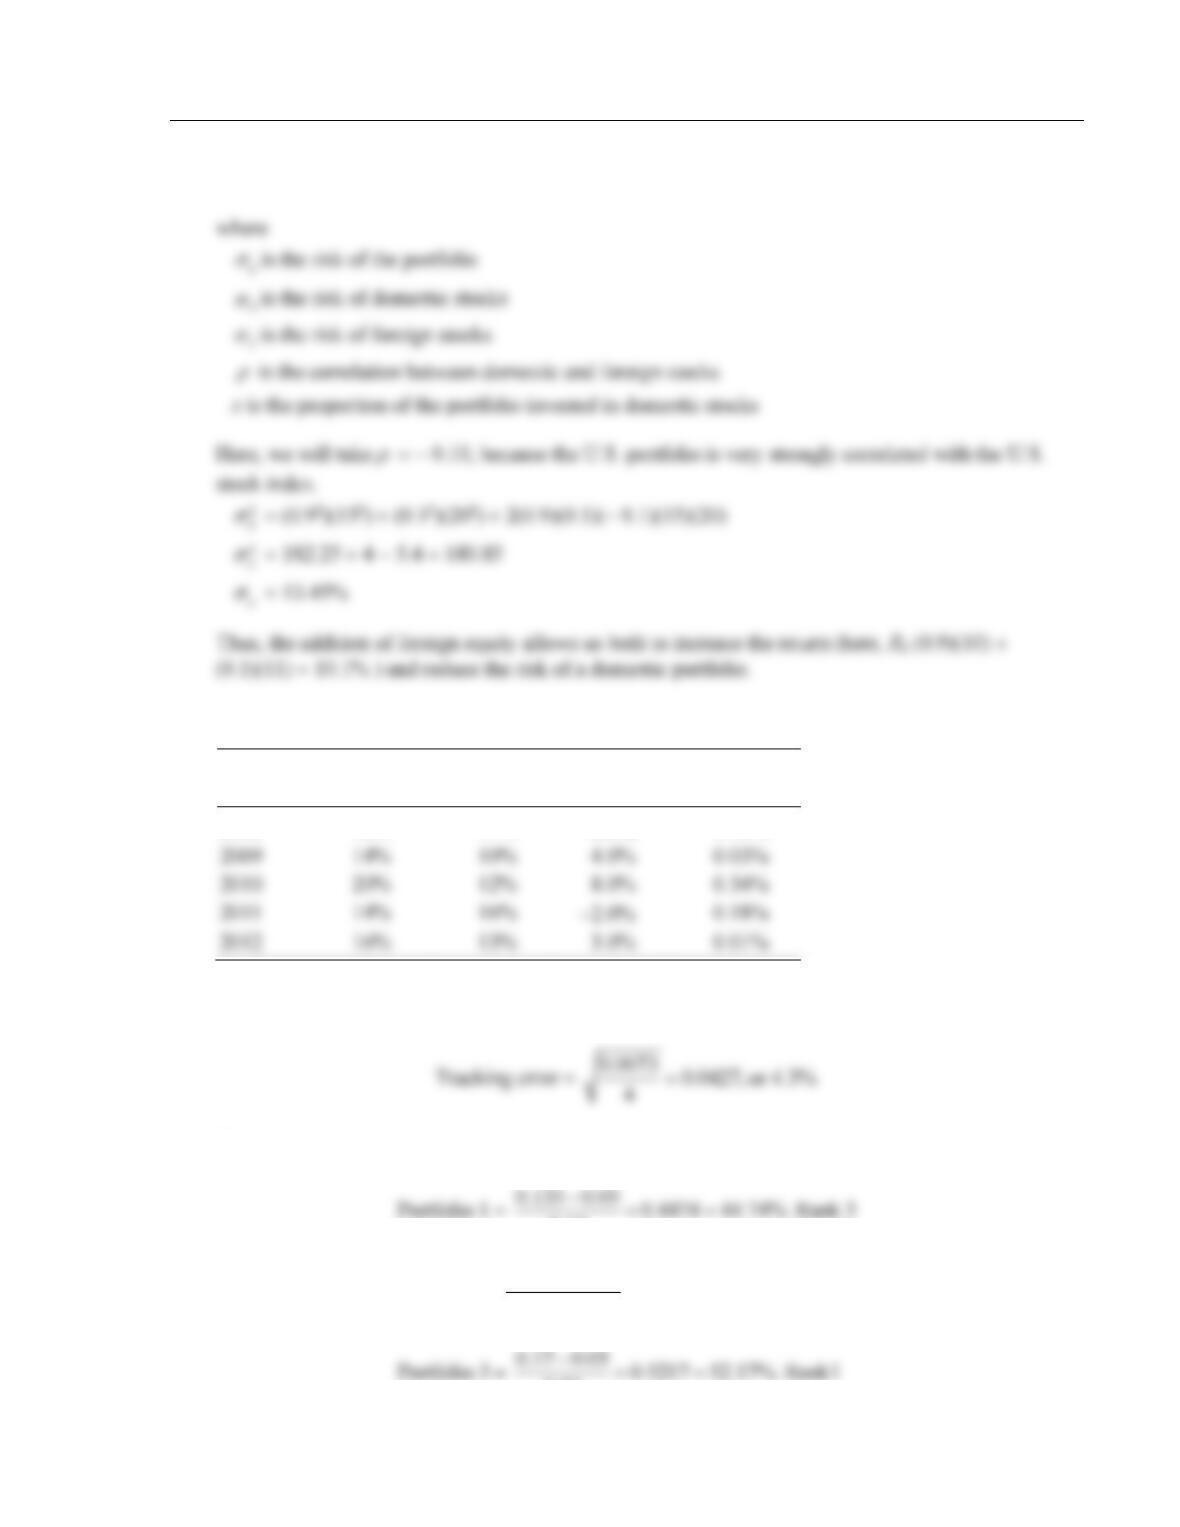
Chapter 12 Global Performance Evaluation 87
13.
Year
Portfolio
Return
Benchmark
Return
Excess
Return
Squared
Deviation
2008
12%
14%
−2.0%
0.18%
2011
14%
16%
−2.0%
0.18%
The squared deviation column is the squared deviation of the excess return for each period from the
mean excess return of 2.20 percent.
14. Sharpe ratio calculations:
0.19
Portfolio 2 =
0.1625 0.05 0.4688 46.88%. Rank 2
0.24
−==
0.23
88 Solnik/McLeavey • Global Investments, Sixth Edition
Information ratio calculations:
Portfolio 1 =
0.135 0.13 0.08. Rank 3
0.065
−=
15. This publicity campaign is misleading because of survivor bias. Only the funds that survive, because
of their good performance, are included in the track record.
16. The average performance should be that of the market index minus costs (transaction costs,
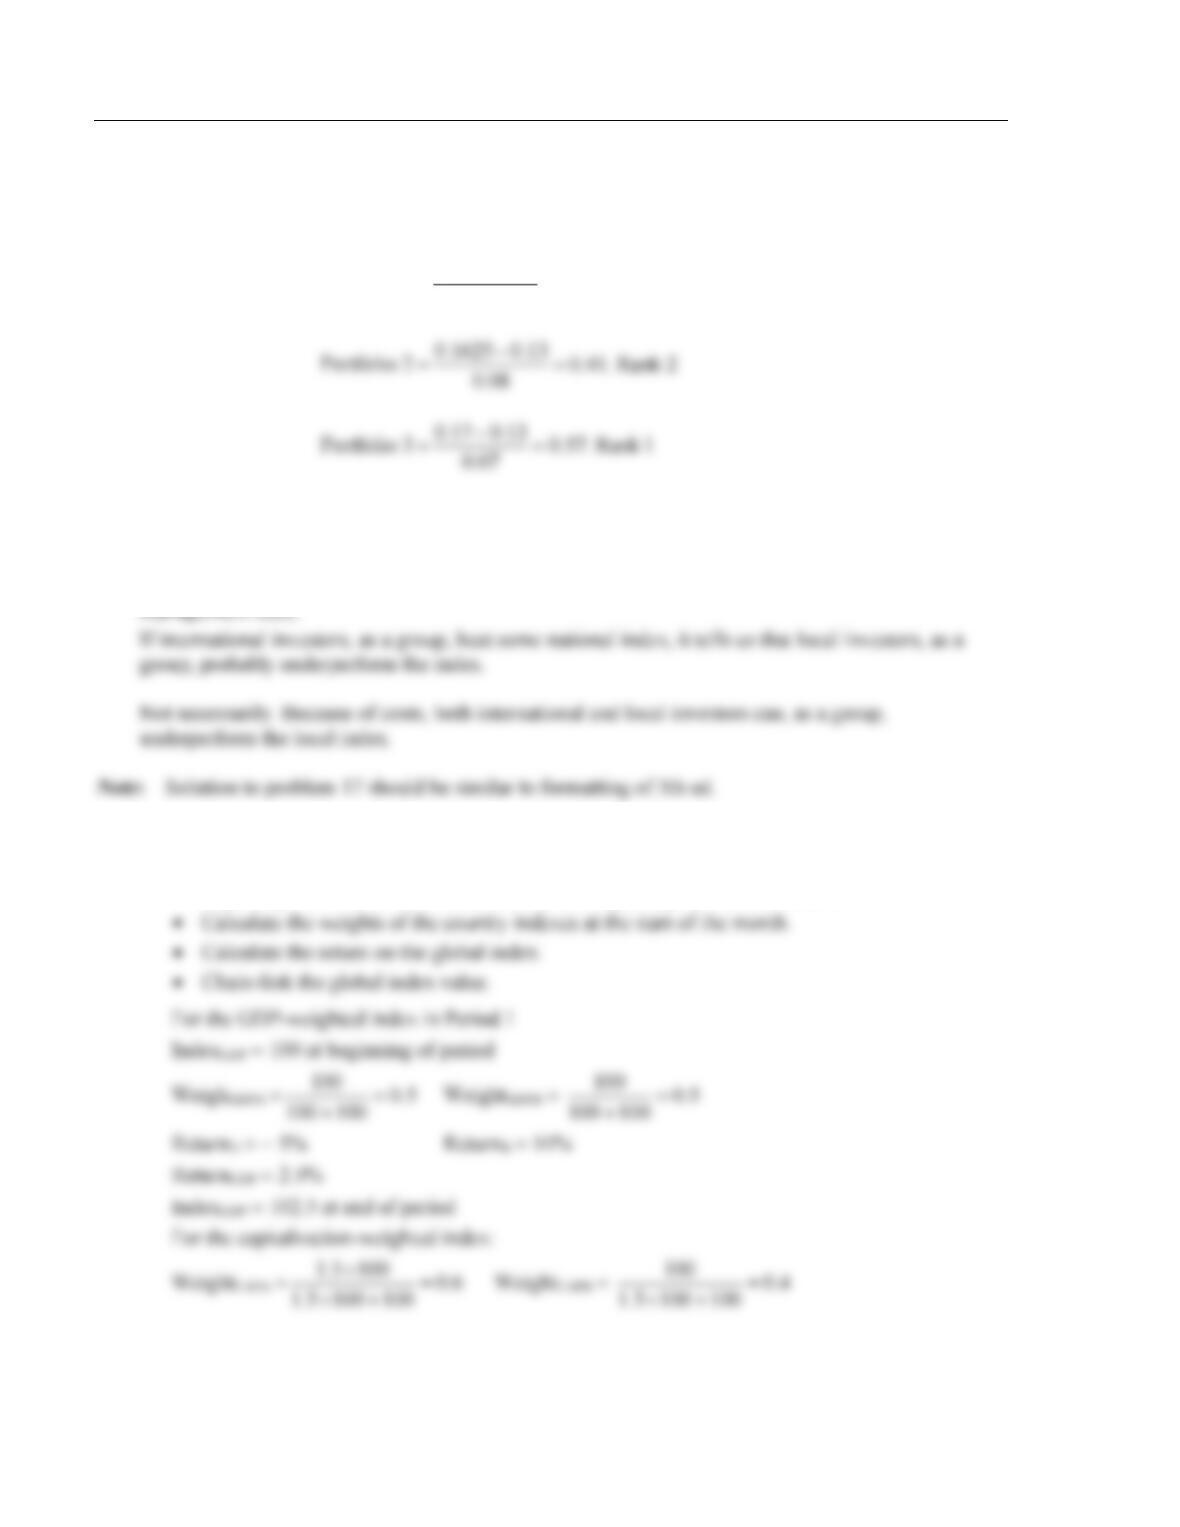
17. a. To calculate the indexes, we proceed in four steps:
• Calculate the return of month t for each market as the difference between the ending and
beginning values of the index, divided by the beginning value of the index.
Chapter 12 Global Performance Evaluation 89
The country index returns are given in the following table:
Month
IndexA
IndexB
ReturnA
ReturnB
0
100
100
For example, for Month 1:
ReturnA =
95 1 0.05
100 − = −
Months
GDPA
GDPB
CAPA
CAPB
0
100
100
150
100
1
100
100
142.5
110
3
102
101
150
120
For example, for Month 1:
Month
WeightGDPA
WeightGDPB
WeightCAPA
WeightCAPB
0
0.5000
0.5000
0.6000
0.4000
For example, for Month 1:
3
100
120
4
105
125
90 Solnik/McLeavey • Global Investments, Sixth Edition
Month
ReturnGDP
IndexGDP
ReturnCAP
IndexCAP
0
—
100
—
100
1
0.0250
102.5
0.01
101
3
0.1
110.5921
0.08
108
4
0.0459
115.6632
0.0463
113
For example, for Month 1:
b. At the end of each month, we must rebalance the portfolio tracking the GDP-weighted index. For
example, at the end of Month 1, the shares of Market B have gone up in value and we must sell
some of them to get back to a 50–50 breakdown.
18. a. The total risk of a portfolio can be decomposed into
• absolute risk on each asset class without regard to risk of active managers, and
b. Risk budgeting refers to the process by which a client allocates the amount of risk it is willing to
assign to different asset classes or portfolio managers. Some portfolio managers are allowed to
19. The following factors can introduce potential biases in the measurement of portfolio risk and
performance:
■ Infrequently traded assets in the portfolio

Chapter 12 Global Performance Evaluation 91
20. a. The results are given in the following table:
Performance Decomposition (in %), January
Weights
Total
Return
Yield
Currency
Gain
Capital
Gain
Market
Index
Security
Selection
U.S. stocks
29.8
−1.45
0.00
0.00
−1.45
2.50
−3.95
−1.38
Japan bonds
14.5
0.64
4.86
−1.39
−0.39
He did better than the World index. The market index returns were, respectively, 2.5%, −2%,
8%, and −1%. If the manager had invested with the same proportions in market indexes, instead
of individual securities, he would have obtained + 0.76% in local currency. So, his security
selection gave him 0.42 − 0.76 = − 0.34%. He underperformed the indexes for U.S. stocks and
yen bonds, but outperformed for French and Japanese stocks.
By way of illustration, a set of calculations is shown for Japanese stocks.
92 Solnik/McLeavey • Global Investments, Sixth Edition
Chapter 12 Global Performance Evaluation 93
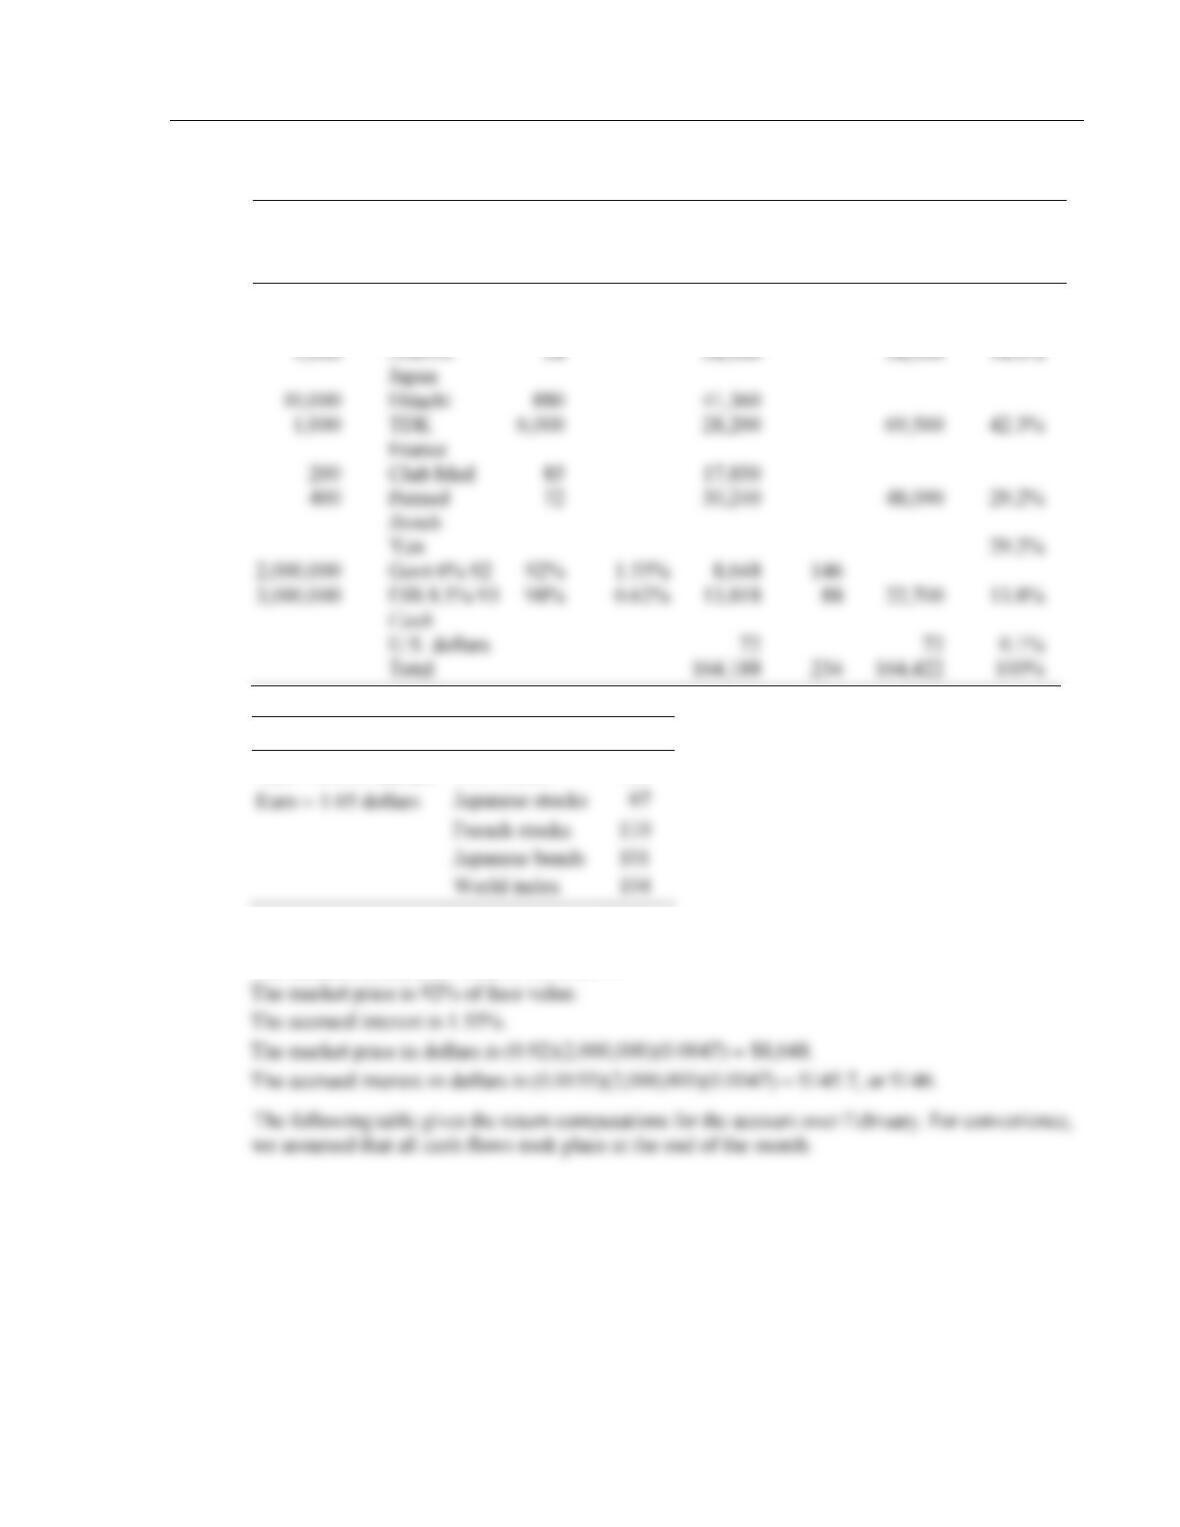
b. The following table gives the valuation report at the end of February.
Number of
Securities or
Nominal
Description
Market
Price
Accrued
Interest
in%
Amount
in $
Accrued
Interest
in $
Subtotal
in $
Sub total
in%
Equity
U.S.
Exchange rates
Market indexes
Yen = 0.0047 dollars
U.S. stocks
103
Euro = 1.05 dollars
Japanese stocks
By way of explanation, consider the valuation numbers for the Japanese Government bond:
The nominal (face) yen value is ¥2,000,000.
AMAX
Japan
Hitachi
TDK
France
Club Med
Pernod
Bonds
Yen
2,000,000
Govt 6% 92
3,000,000
EIB 8.5% 93
U.S. dollars
94 Solnik/McLeavey • Global Investments, Sixth Edition
Otherwise, we would have to adjust the mean capital invested and take account of the currency
rate at the time of each cash flow. The same calculation would yield slightly different results if
the cash flows were assumed to take place at the start of the month or at the middle of the month.
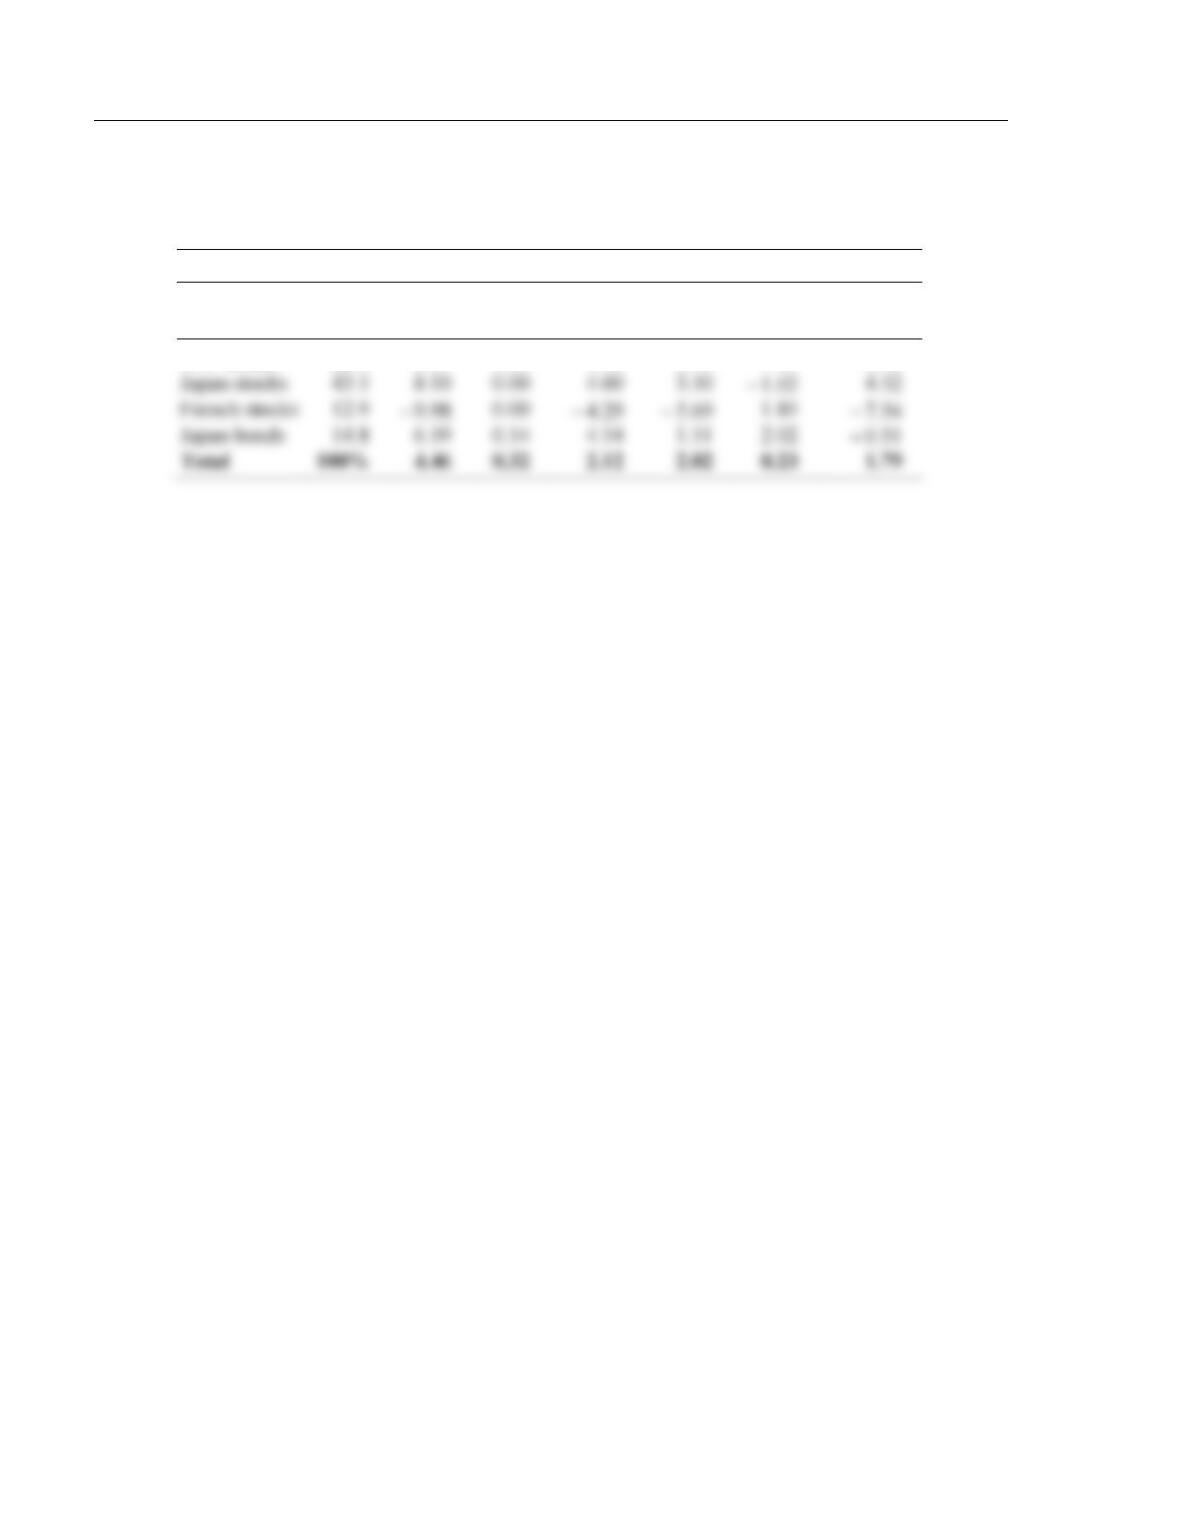
Performance Decomposition (in %), February
Weights
Total
Return
Yield
Currency
Gain
Capital
Gain
Market
Index
Security
Selection
U.S. stocks
28.8
4.37
0.84
0.00
3.53
0.49
3.04