11-1
Cost of Capital
Author’s Overview
Chapter 11 on “Cost of Capital” naturally follows Chapter 10 on “Valuation and Rates of Return.”
The instructor should emphasize at the outset that investors’ required rate of return translates into the
cost of financing for the firm. There should be a dual emphasis on properly determining the aftertax
cost for each type of financing and on determining the appropriate weights to be assigned to the
various sources of financing.
The cost of debt and the cost of preferred stock are reasonably straightforward, but additional
guidance is required in determining the cost of common equity. The instructor should indicate the
firm’s ability to acquire equity capital through retained earnings or through new common stock and
the associated cost of each. The cost of retained earnings should be explained as an opportunity cost
for the use of the stockholders’ funds. For that reason, it is assumed the stockholders can earn as
much on these funds, if distributed, as they are currently earning in the firm. Thus, the cost of
retained earnings is also equal to Ke (the firm’s return on common equity).
Chapter Concepts
LO1. The cost of capital represents the weighted average cost of the source of financing to the
firm.
LO2. The cost of capital is normally the discount rate to use in analyzing an investment.
11

11-2
LO4. A firm attempts to find a minimum cost of capital through varying the mix of its sources of
financing.
LO5. The cost of capital may eventually increase as larger amounts of financing are utilized.
11-3
Annotated Outline and Strategy
I. The Overall Concept
A. A business firm must strive to earn at least as much as the cost of the funds that it
uses.
E. There are several steps in measuring a firm’s cost of capital.
1. Compute the cost of each source of capital.
3. Compute the weighted average of the component costs.
PPT Cost of Capital—Baker Corporation (Table 11-1)
II. Cost of Debt
A. The basic cost of debt to the firm is the effective yield to maturity. The yield to
maturity is a market-determined rate and can be found by examining the relationships
of security price, periodic interest payments, maturity value, and length of time to
maturity. The yield to maturity for a corporate bond may be found by solving for
YTM in the following calculator keystrokes:
N Number of periods to maturity
Table 11-2 on page 343 uses an Excel spreadsheet to calculate the yield to maturity
using the RATE function.
11-4
PPT Yield to Maturity (Table 11-2)
B. Since interest is tax-deductible, the actual cost of debt to the firm is less than the yield
to maturity.
C. The aftertax cost of debt is:
Thus the aftertax cost to a firm of bonds issued at par paying $100 annually in interest
would be 7.05 percent if the firm’s marginal tax rate were 25 percent.
Kd = Y(1 – T)
D. The example of KeySpan Corporation in Table 11-3 on page 344 presents the
opportunity for the professor to expose the students to the information found in
Standard & Poor’s Capital IQ Net Advantage.
PPT Excerpt from S&P Capital IQ Net Advantage (Table 11-3)
Perspective 11-1: Explain that since the cost of preferred stock and common stock is
calculated on an aftertax basis, the cost of debt is adjusted for taxes so all three sources of capital
are on an aftertax cost basis.
III. Cost of Preferred Stock
A. The cost of preferred stock is similar to the cost of debt in that a constant annual
B. The cost of preferred stock to a firm may be determined by examining the
relationship of its annual (usually fixed) dividend and its market-determined price.
Preferred stock, unlike debt, has no maturity, and therefore the dividends are
11-5
expected to be perpetual.
C. The cost of preferred stock Kp is computed by dividing the annual dividend payment
by the net proceeds received by the firm in the sale of preferred stock.
Where:
Kp = Cost of preferred stock
IV. Cost of Common Equity
A. The basis of computation of the price of common stock is the dividend valuation
model.
P0 = Price of the stock today
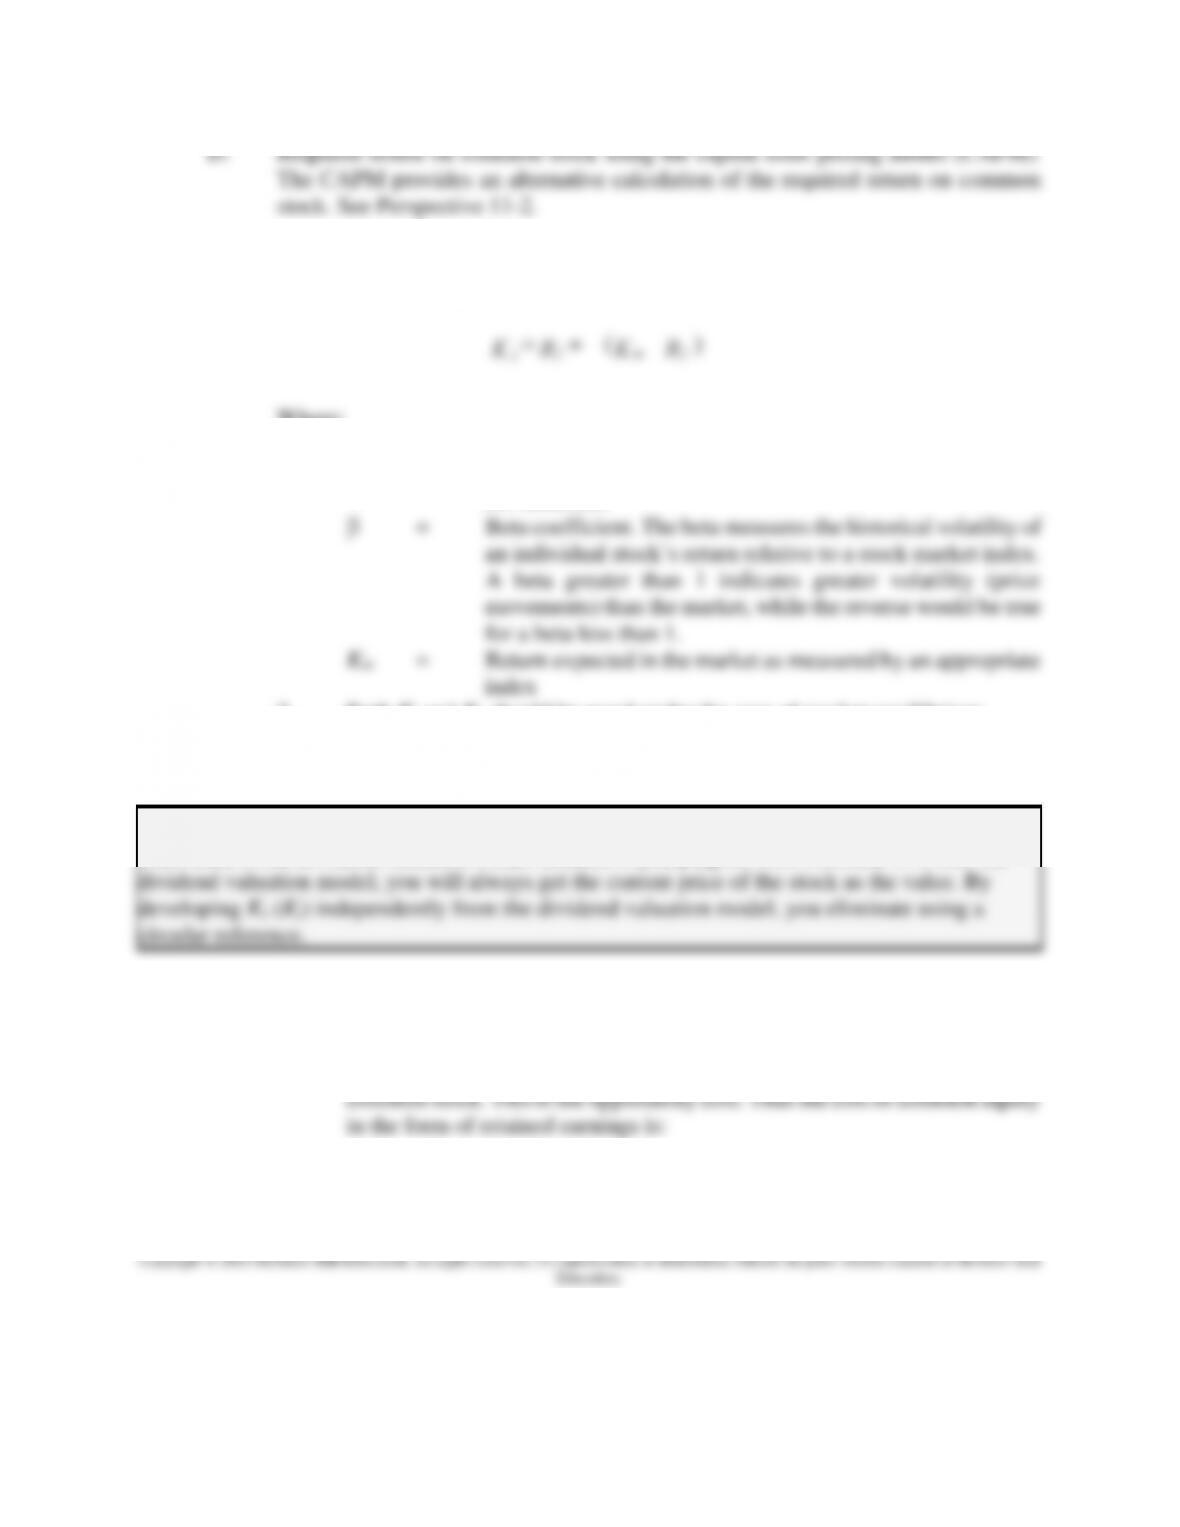
C. The equation for the cost of common equity Ke is equal to the total of the dividend
yield rate plus capital gains on the original investment. D1/P0 represents the dividend
yield. Since the original investment must grow at the same rate as the dividends, the
capital gains on the investment is achieved by adding g, the dividend growth rate.
p
K=Dp
(Pp–F)
(Formula 11-2)
1
0
( )
e
D
Pg
K
=−
(Formula 10-8)
11-6
1. Under the CAPM, the required return for common stock can be described by
the following formula:
Kj = Required return on common stock
Rf = Risk-free rate of return; usually the current rate on Treasury
bill securities
2. Both Kj and Ke should be equal under the case of market equilibrium.
3. Appendix 11A presents the capital asset pricing model in more detail for
those who wish to expand the textbook coverage on this concept.
Perspective 11-2: It is helpful to point out that the Kj in the capital asset pricing model is
often used in the dividend valuation model because if you plug Ke from Formula 11-3 into the
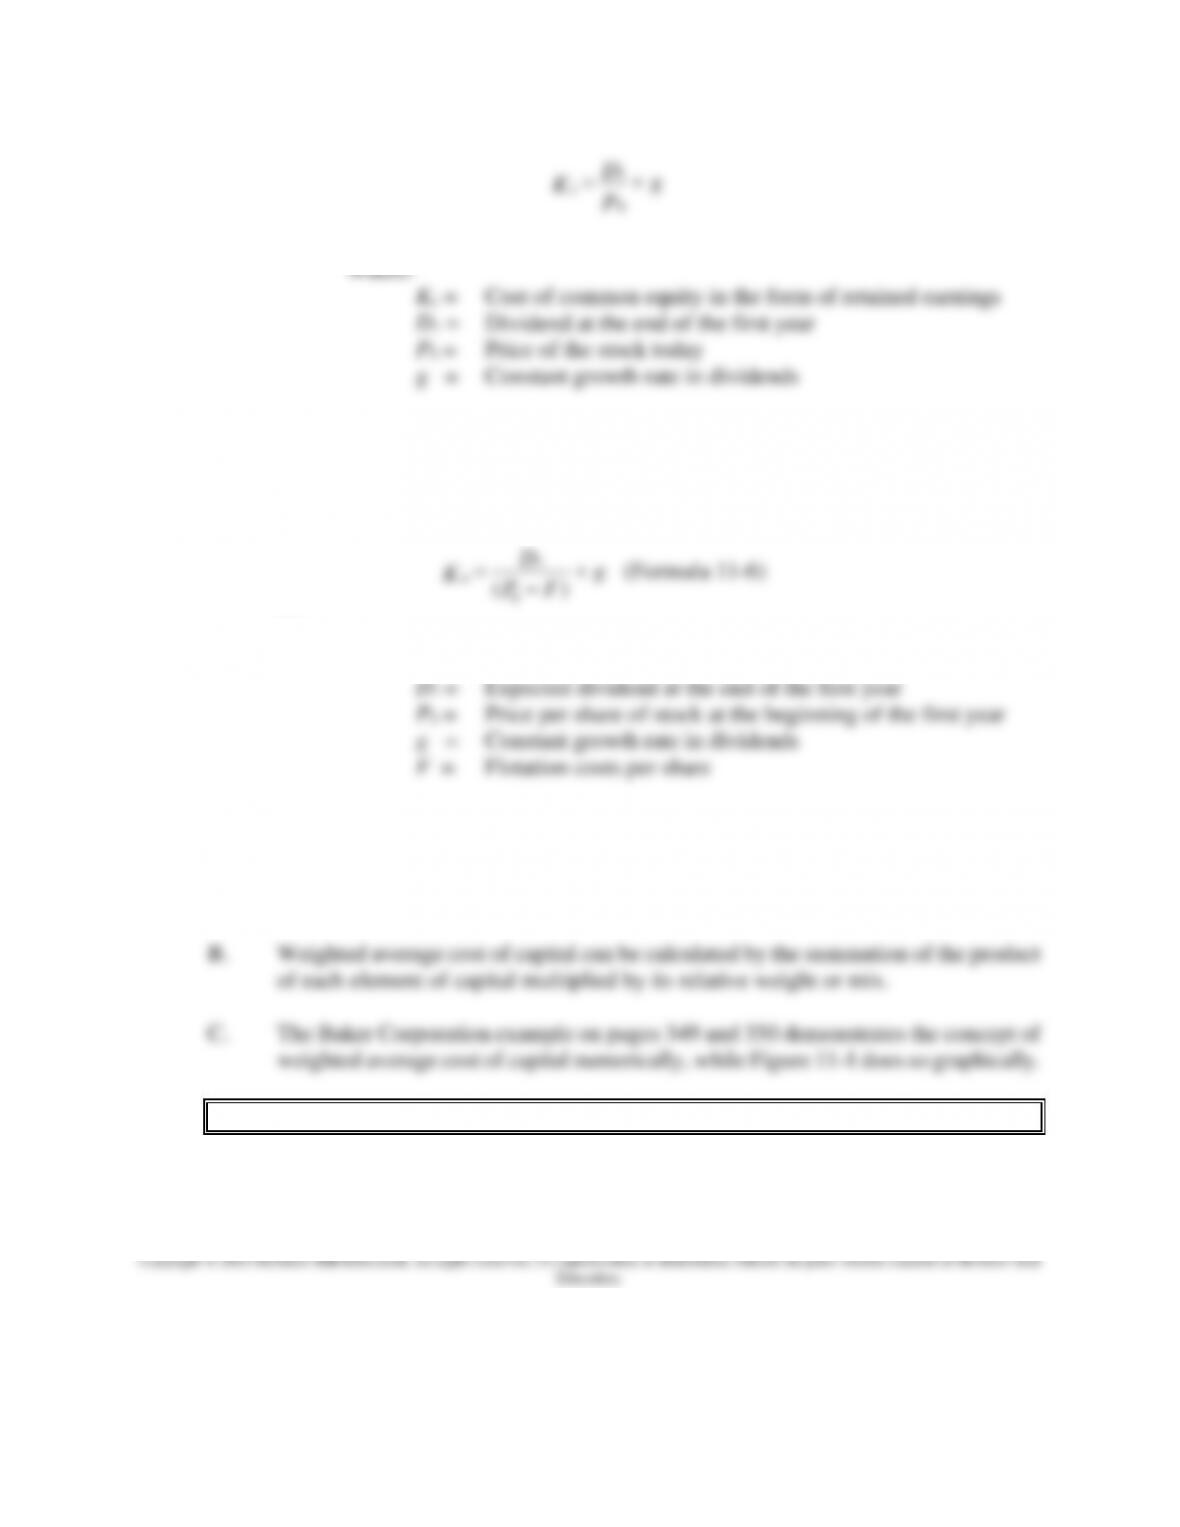
E. Cost of retained earnings: Common stock financing is available through the retention
of earnings belonging to current stockholders or by issuing new common stock.
1. The cost of retained earnings is equivalent to the rate of return on the firm’s
j
K = f
R +
b
( m
K – f
R )
11-7
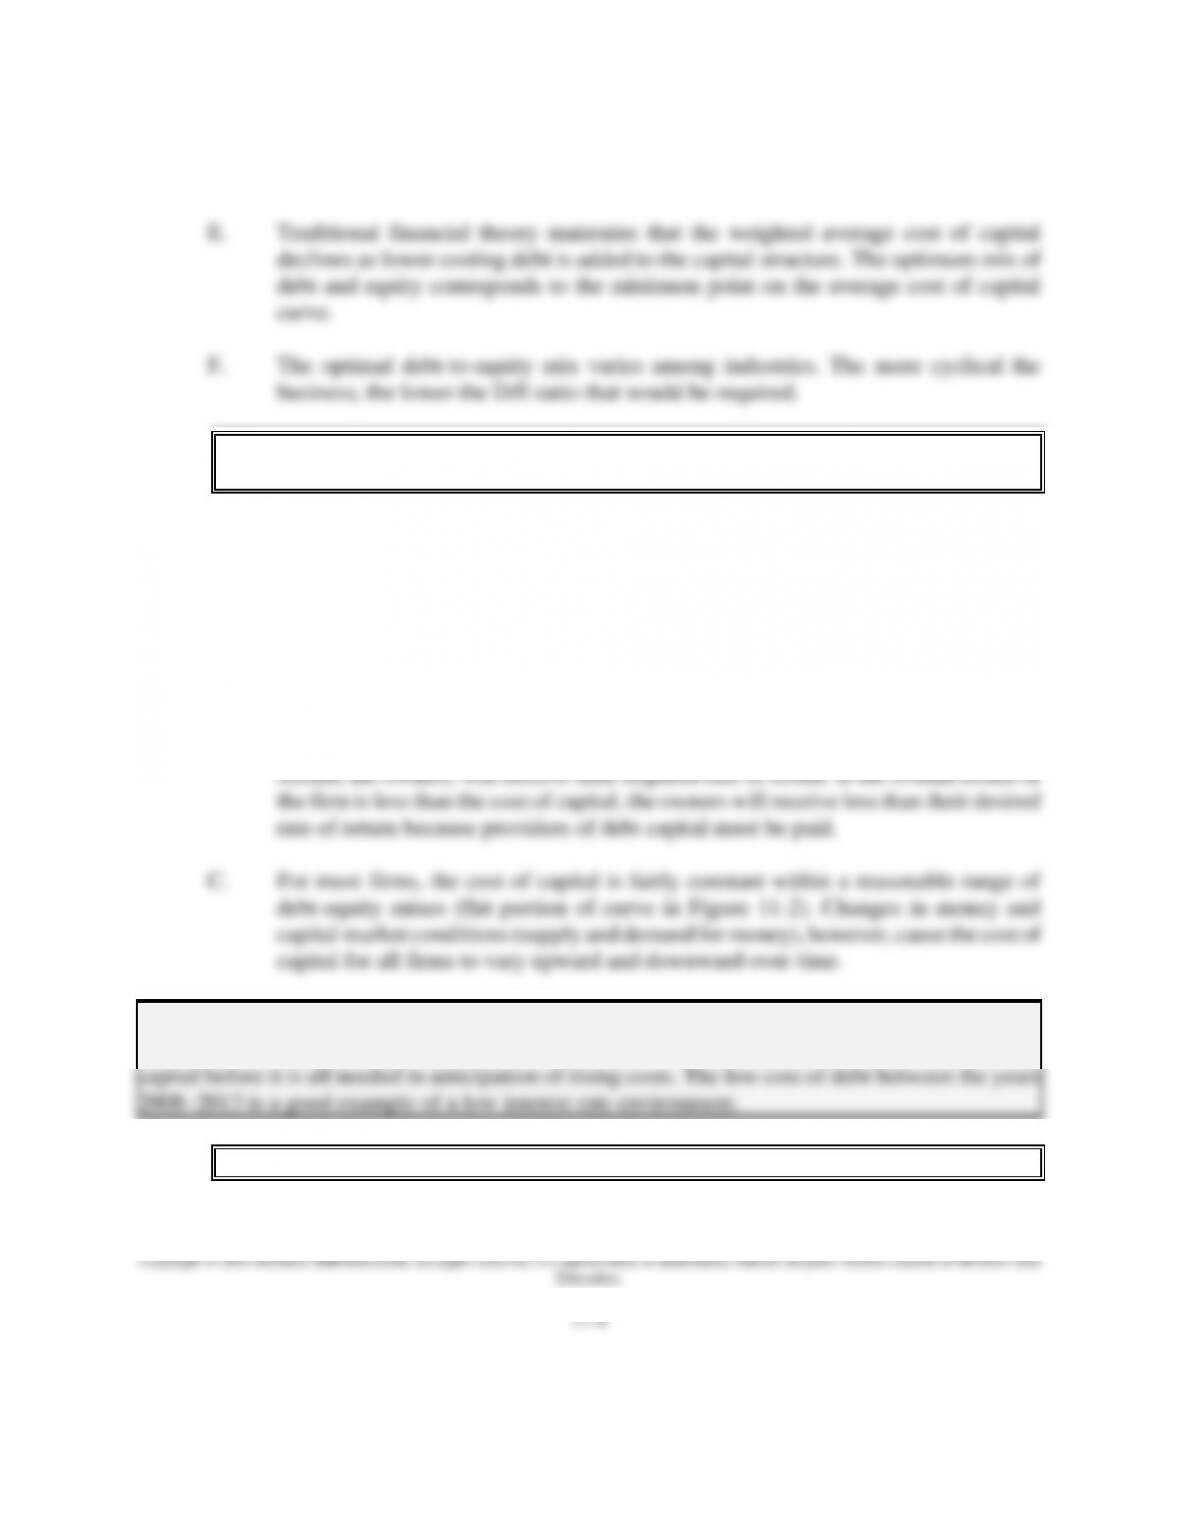
F. Cost of new common stock: The sale of new common stock has a higher cost than
the cost of retained earnings because the firm’s proceeds from the sale of the new
stock are reduced by the flotation costs (F) paid to the investment banker. The cost of
new common stock, Kn is:
Where: Kn = Required rate of return on new common shares
V. Optimum Capital Structure—Weighting Costs
A. The firm should seek to minimize its cost of capital by employing the optimal mix of
capital financing.
PPT Cost of Capital Curve (Figure 11-1)
D. Although debt is the cheapest source of capital, there are limits to the amount of debt
capital that lenders will provide (recall the Debt/Equity (D/E) relationships discussed
1
0
eDg
KP
=+
1
0
( )
nDg
KPF
=+
−
(Formula 11-6)
in Chapter 3). The cost of both debt and equity financing rises as debt becomes a
larger portion of the capital structure.
E. Traditional financial theory maintains that the weighted average cost of capital
PPT 2015 and 2018 Long-Term Debt as a Percentage of Debt + Equity
(MV) (Table 11-4)
G. The weights applied in computing the weighted average cost should be market-value
weights.
VI. Capital Acquisition and Investment Decision Making
A. The discount rate used in evaluating capital projects should be the weighted average
cost of capital.
B. If the cost of capital is earned on all projects, the residual claimants of the earnings
Perspective 11-3: Discuss the impact of economic cycles on the cost of capital. The shifts that
occur in costs of capital demonstrate that companies raise capital in an uneven fashion, often raising
PPT Cost of Capital over Time (Figure 11-2)
11-9
1. It is the current cost of each source of funds that is important.
2. The cost of each source of capital will vary with the amount of capital
Perspective 11-4: Use Table 11-5 and Figure 11-3 together to show that not all projects can
be accepted and that only those projects with expected rates of return greater than the cost of
capital can be accepted as viable capital budgeting projects.
PPT Investment Projects Available to the Baker Corporation (Table 11-5)
PPT Cost of Capital and Investment Projects for the Baker Corporation
(Figure 11-3)
Finance In Action: Big Bonds Are “Liquid” Bonds
Bond issues of $500 million or more may have a lower cost of debt than smaller bond issues.
$500 million seems to be the threshold for creating a market for a company’s bonds where there
VII. Marginal Cost of Capital
A. The marginal cost of debt (the cost of the last amount of debt financing) will rise as
more debt financing is used. The marginal cost of equity also rises when the shift
from retained earnings to external (common stock) equity financing is necessary.
Perspective 11-5: Compare Table 11-6 and Table 11-7 to show how the cost of capital rises as
the Baker Corp. raises its first $39 million, its next $11 million, and then the rising cost of funds
PPT Costs of Capital for Different Amounts of Financing (Table 11-6) and

11–10
PPT Cost of Capital for Increasing Amounts of Financing (Table 11-7)
PPT Marginal Cost of Capital and Baker Corporation Projects
(Figure 11-4)
PPT Cost of Components in the Capital Structure (Table 11-8)
VIII. Appendix 11A: Cost of Capital and the Capital Asset Pricing Model
A. The Capital Asset Pricing Model (CAPM) relates the risk-return tradeoffs of
individual assets to market returns.
B. The CAPM encompasses all types of assets but is most often applied to common
stock.
C. The basic form of the CAPM is a linear relationship between returns on individual
stocks and the market over time. Using least squares regression analysis, the return
on an individual stock Kj is:
Where:
Kj = Return on individual common stock of company
= Alpha, the intercept on the y-axis
PPT Performance of PAI and the Market (Table 11A-1)
PPT Linear Regression of Returns between PAI and the Market
(Figure 11A-1)
D. Using historical data, the beta coefficient is computed. The beta coefficient is a
measurement of the return performance of a given stock versus the return
performance of the market.
jm
e
KK
= + +
1. Investors expect higher returns if higher risks are taken.
2. The minimum return expected by investors will never be less than can be
obtained from a riskless asset (usually considered to be U.S. Treasury bills).
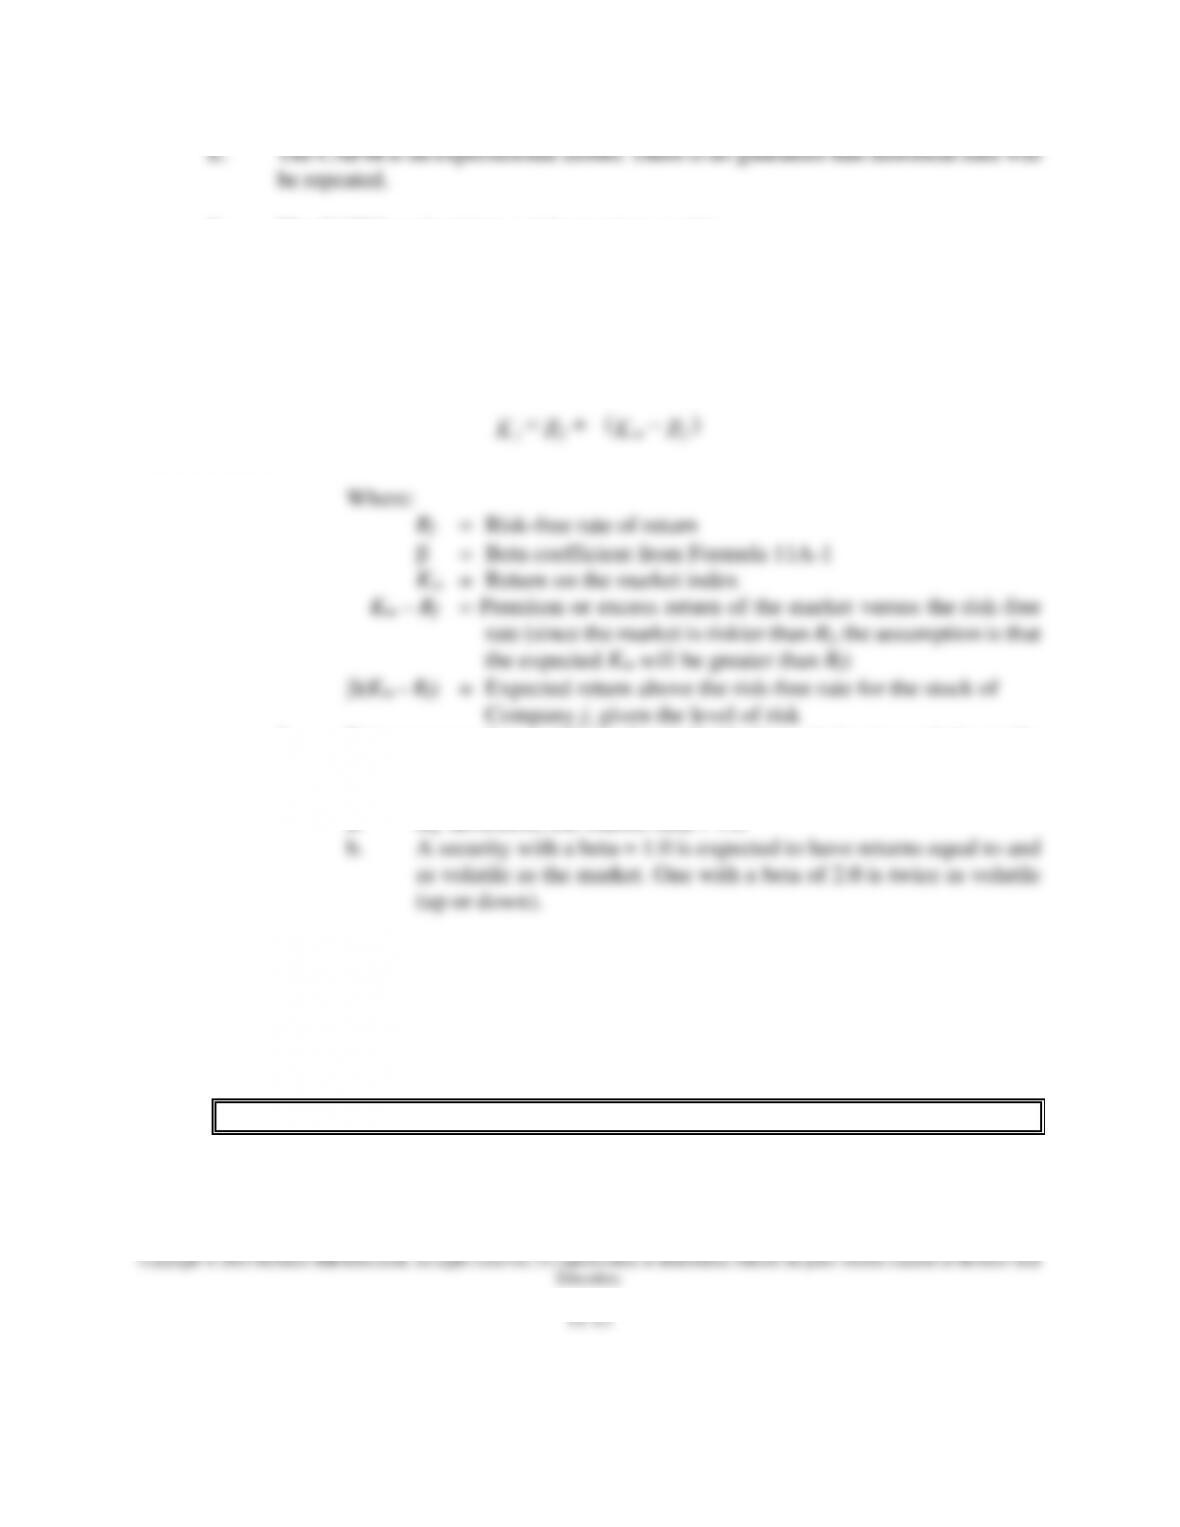
The relationship is expressed as follows:
3. Beta measures the sensitivity of an individual security’s return relative to the
market.
a. By definition, the market beta = 1.0
4. Beta measures the impact of an asset on an individual’s portfolio of assets.
G. A risk-return graph can be derived from the risk premium model. The graphed
relationship between risk (measured by beta) and required rates of return is called the
security market line (SML).
PPT The Security Market Line (SML) (Figure 11A-2)
H. Cost of capital considerations
j
K = f
R +
b
(m
K – f
R)
1. If required returns rise, prices of securities fall to adjust to the new
PPT The Security Market Line and Changing Interest Rates (Figure 11A-3)
a. The new SML will be parallel to the previous one if investors attempt
to maintain the same risk premium over the risk-free rate.
PPT The Security Market Line and Changing Investor Expectations
(Figure 11A-4)
Other Chapter Supplements
Cases for Use with Foundations of Financial Management