3-1
Valuation and Rates of Return
Author’s Overview
The student can clearly see that the material covered in the previous chapter on time value of money
is now being applied. The recurring theme throughout the chapter is that valuation is based on the
present value of benefits to be received in the future. The instructor should establish this point at the
outset and then repeatedly demonstrate it in the evaluation of bonds, preferred stock, and common
stock. The instructor should also emphasize the relationship of the discount rate in present value
analysis to the required rate of return demanded by security holders. The authors suggest that the
instructor go through the process of defining the investor’s required return in terms of a real rate of
return, an inflation premium, and a risk premium. The instructor can then vary one of these
Chapter Concepts
LO2. The required rate of return in valuing an asset is based on the risk involved.
LO4. Preferred stock valuation is based on the dividend paid and the market required return.
10
3-2
Annotated Outline and Strategy
PPT The Relationship between Time Value of Money, Required Return,
Cost of Financing, and Investment Decisions (Figure 10-1)
I. Valuation Concepts
A. The value of an asset is the present value of the expected cash flows associated with
the asset. In order to compute the present value of an asset, an investor must know or
II. Valuation of Bonds
A. The value of a bond is derived from cash flows composed of periodic interest
B. The present value (price) of a bond is equal to the present value of the interest
payments plus the present value of the principal (Face Value or Par Value) payment.
It is given in Formula 10-1 as follows:
Where:
Pb = price of the bond
It = interest payments
Pn = principal payment at maturity
1. The present value of interest payments can be calculated using Formula 9-6
from the previous chapter.
1
(1 ) (1 )
ntn
btn
t
IP
PYY
=
=+
++
1
1(1 )
PV n
Ai
Ai
−+
=
3-3
2. The present value of the principal payment (par value) at maturity may be
computed by applying Formula 9-2 from the previous chapter.
3. The present value (price) of the bond will be the sum of the present value of
the interest payments plus the present value of the principal.
Perspective 10-1: Sometimes it is instructive to have the students calculate the present value
of the interest payments and principal independently rather than just the final bond price. This
C. Bond valuation using a financial calculator or an Excel spreadsheet is presented on
pages 306–307 of the text. The Excel spreadsheet is a very instructive way to do
sensitivity testing by varying the years to maturity and the required rate of return.
D. Concept of yield to maturity
1. Three factors influence an investor’s required rate of return on a bond.
a. The required real rate of return: the rate of return demanded for
giving up current use of funds on a no-risk, noninflation-adjusted
basis.
(2) Financial risk is the possibility that a firm will be unable to
meet its debt obligations as they come due.
E. Changing the yield to maturity and the impact on bond valuation
1. Bond prices are inversely related to required rates of return. A change in the
1
PV FV (1 )n
i
=
+

3-4
PPT Bond Price Table (Table 10-1)
Perspective 10-2: Table 10-1 illustrates the impact of differences between yield to maturity
and coupon rates on bond prices and reinforces the inverse relationship between bond prices and
required yield to maturity.
2. The impact of the change in required rate of return on the bond price is
dependent upon the remaining time to maturity. The impact will be greater as
the time to maturity increases.
PPT Impact of Time to Maturity on Bond Prices (Table 10-2)
Perspective 10-3: Table 10-2 shows the critical effect of time to maturity on bond price
sensitivity. The longer the time to maturity, the bigger the change in bond price.
PPT Relationship between Time to Maturity and Bond Price (Figure 10-2)
Perspective 10-4: The critical effect of time to maturity on bond price sensitivity is further
supported by this figure.
F. Determining yield to maturity from the bond price
1. If the bond price, interest rate on the bond, and number of years to maturity
2. The yield to maturity can most easily be found using a financial calculator.
The keystrokes are as follows:
N Number of years to maturity
PV Present value of the bond (current bond price)
3. The yield to maturity can also be found by using the Goal Seek function in
Excel. The Goal Seek function can be found in the most recent version of
PPT Finding the Goal Seek Function in Excel (Figure 10-3)
3-5
G. Semiannual interest and bond prices: Often interest payments are made more
frequently than once a year. Semiannual interest payments are common. To compute
the price of such a bond, we divide the annual amount of interest and the yield to
maturity by two and multiply the number of years to maturity by two. For example,
Perspective 10-5: Students have the opportunity to use both the annual and semiannual
approaches in working problems at the back of the chapter.
III. Valuation and Preferred Stock
A. Preferred stock is usually valued as a perpetual stream of fixed dividend payments
Where:
B. Since the dividend stream is a perpetuity, the preferred stock valuation formula can
be reduced to a more usable form
C. If Kp changes after preferred stock is issued, Pp will change in an inverse fashion.
D. If the market price of preferred stock and the annual dividend are known, the market-
determined required rate of return can be computed by using the valuation equation
and solving for Kp.
IV. Valuation of Common Stock
1 2 3
….
(1 ) (1 ) (1 ) (1 )
p p p p
pn
p p p
D D D D
PK
K K K
= + + + +
+ + + +
p
p
p
D
PK
=
p
p
p
D
PK
=
then
p
p
p
D
KP
=
3-6
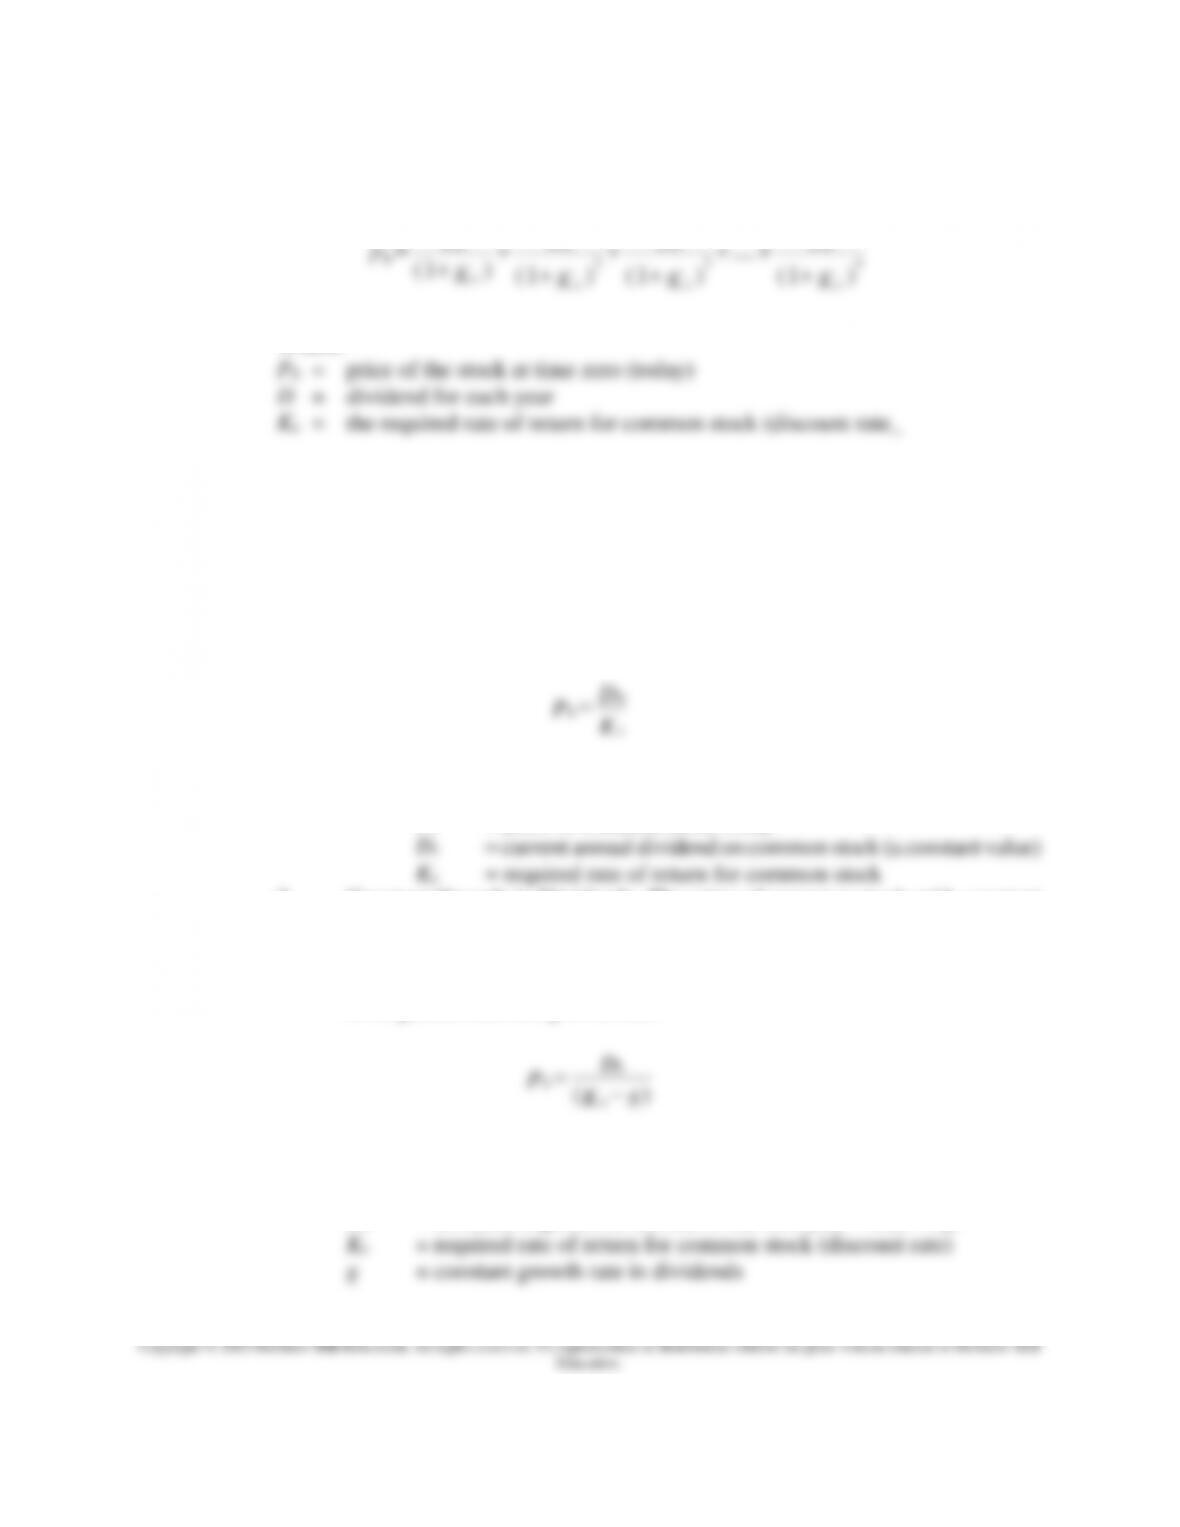
A. The value of a share of common stock is the present value of an expected stream of
future dividends
Where:
B. Unlike dividends on most preferred stock, common stock dividends may vary. The
valuation formula may be applied, with modification, to three different
circumstances: no growth in dividends, constant growth in dividends, and variable
growth in dividends.
1. No Growth in Dividends. Common stock with constant (no growth)
dividends is valued in the same manner as preferred stock.
Where:
P0 = price of common stock today
2. Constant Growth in Dividends. The price of common stock with constant
growth in dividends is the present value of an infinite stream of growing
dividends. Fortunately, in this circumstance the basic valuation equation can
be reduced to the more usable form below if the discount rate (Ke) is assumed
to be greater than the growth rate.
Where:
P0 = price of stock today
D1 = dividend expected at the end of the first year = D0(1 + g)
0
P = 1
D
( 1+e
K ) + 2
D2
( 1+e
K ) + 3
D3
( 1+e
K ) + …. + n
D
n
( 1+e
K )
0
0
e
D
PK
=
1
0()
e
D
Pg
K
=−
a. The above formula can also be thought to represent the present value
of dividends for a period of time (such as n = 3) plus the present
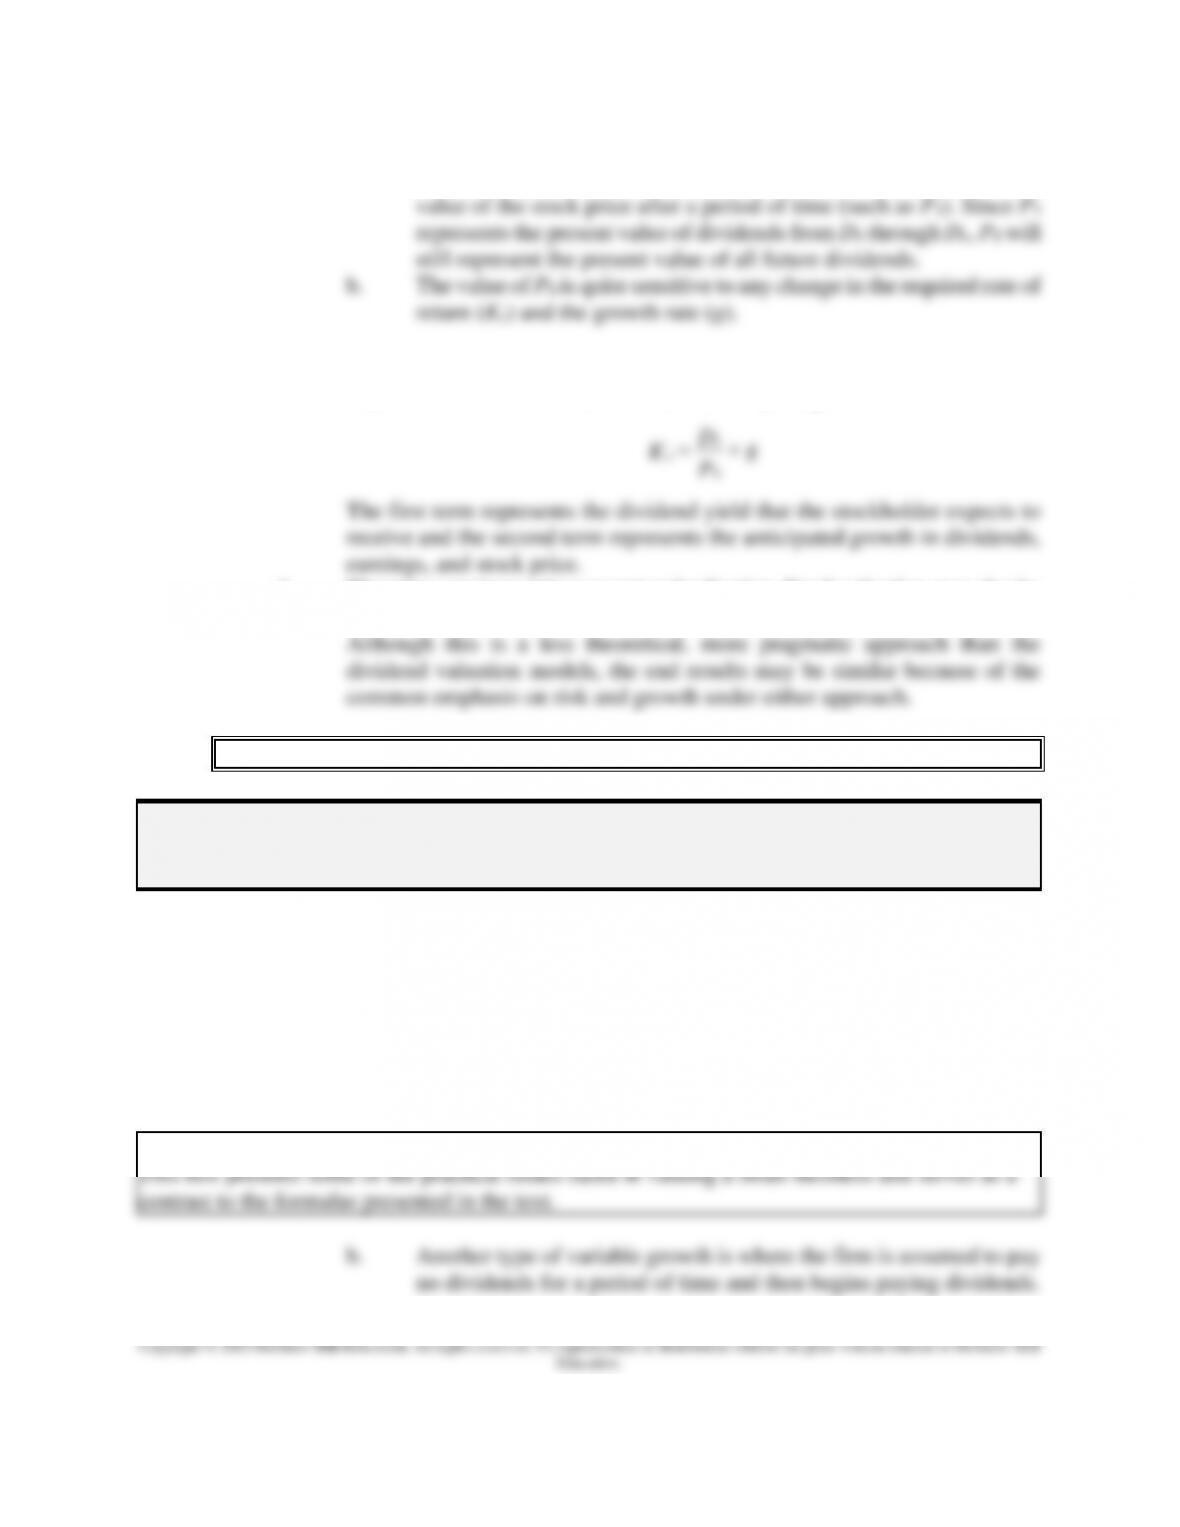
3. Rearrangement of the constant growth equation allows the calculation of the
required rate of return, Ke, when P0, D1, and g are given.
4. The price-earnings ratio concept and valuation. Stock valuation may also be
linked to the concept of price-earnings ratios discussed in Chapter 2.
PPT Quotations from Barron’s (Table 10-4)
Perspective 10-6: Table 10-4 from Barron’s illustrates how P/E ratios are shown in the
financial press. IBM can be used as an example, and dividend yield and price changes can also
be mentioned to stimulate interest.
5. Variable growth in dividends. The most likely variable growth case is one of
supernormal growth followed by constant growth.
a. Value can be found through taking the present value of the dividends
during the supernormal growth period plus the price of the stock at
end of the supernormal growth period. Since growth is then constant,
Formula 10-8 can be used for the terminal value.
Finance in Action: An Important Question—What’s a Small Business Really Worth?
1
0
eDg
KP
=+

3-8
In this case, the present value of deferred dividends can be computed
as a representation of value.
Perspective 10-7: Appendix 10A Valuation of a Supernormal Growth Firm is optional
and is found on pages 338–340.

Other Chapter Supplements
Cases for Use with Foundations of Financial Management
Case 13, Gilbert Enterprises (Stock Valuation)