Cash
Computer equipment
Bank loan
Software cost
# of Microsoft shares
Microsoft price/share
Solution
a.
Assets Liabilities & Equity
Cash –$ Bank Loan –$
Computer equipment –$ Shareholder’s Equity –$
Total –$ –$
Lanni Products is a start-up computer software development firm. It currently owns computer equipment worth
$30,000 and has cash on hand of $20,000 contributed by Lanni’s owners. Lanni takes out a bank loan. It
receives $50,000 in cash and signs a note promising to pay back the loan over three years. Lanni uses the cash
from the bank plus $20,000 of its own funds to finance the development of new financial planning software.
Lanni sells the software product to Microsoft, which will market it to the public under the Microsoft name. Lanni
accepts payment in the form of 2,500 shares of Microsoft stock. Lanni sells the shares of stock for $50 per
share and uses part of the proceeds to pay off the bank loan.
a. Prepare its balance sheet just after it gets the bank loan. What is the ratio of real assets to total assets?
b. Prepare the balance sheet after Lanni spends the $70,000 to develop its software product. What is the ratio of
real assets to total assets?
c. Prepare the balance sheet after Lanni accepts the payment of shares from Microsoft. What is the ratio of real
assets to total assets?
Liabilities and
Assets $ Billion % Total Net Worth $ Billion % Total
Real assets Liabilities
Equipment and premises #DIV/0! Deposits #DIV/0!
Other real estate #DIV/0! #DIV/0!
Total real assets –$ #DIV/0! #DIV/0!
Other #DIV/0!
Total liabilities –$ #DIV/0!
Financial assets
Cash #DIV/0!
Investment securities #DIV/0!
Loans and leases #DIV/0!
Other financial assets #DIV/0!
Total financial assets –$ #DIV/0!
Other assets
Intangible assets #DIV/0!
Other #DIV/0!
Total other assets –$ #DIV/0! Net worth #DIV/0!
TOTAL –$ #DIV/0! –$ #DIV/0!
#DIV/0!
Non Financial Frims
Liabilities and
Assets $ Billion % Total Net Worth $ Billion % Total
Financial assets Total liabilities –$ #DIV/0!
Deposits and cash #DIV/0!
Marketable securities #DIV/0!
Trade and consumer credit #DIV/0!
Other #DIV/0!
Total financial assets –$ #DIV/0! Net worth #DIV/0!
TOTAL –$ #DIV/0! –$ #DIV/0!
Solution #DIV/0!
Real Asset to Total Asset Ratio =
Real Asset to Total Asset Ratio =
Examine the balance sheet of commercial banks in Table 1.3. What is the ratio of real assets to total assets?
What is that ratio for nonfinancial firms (Table 1.4)? Why should this difference be expected?
Debt and other
borrowed funds
Federal funds and
repurchase agreements
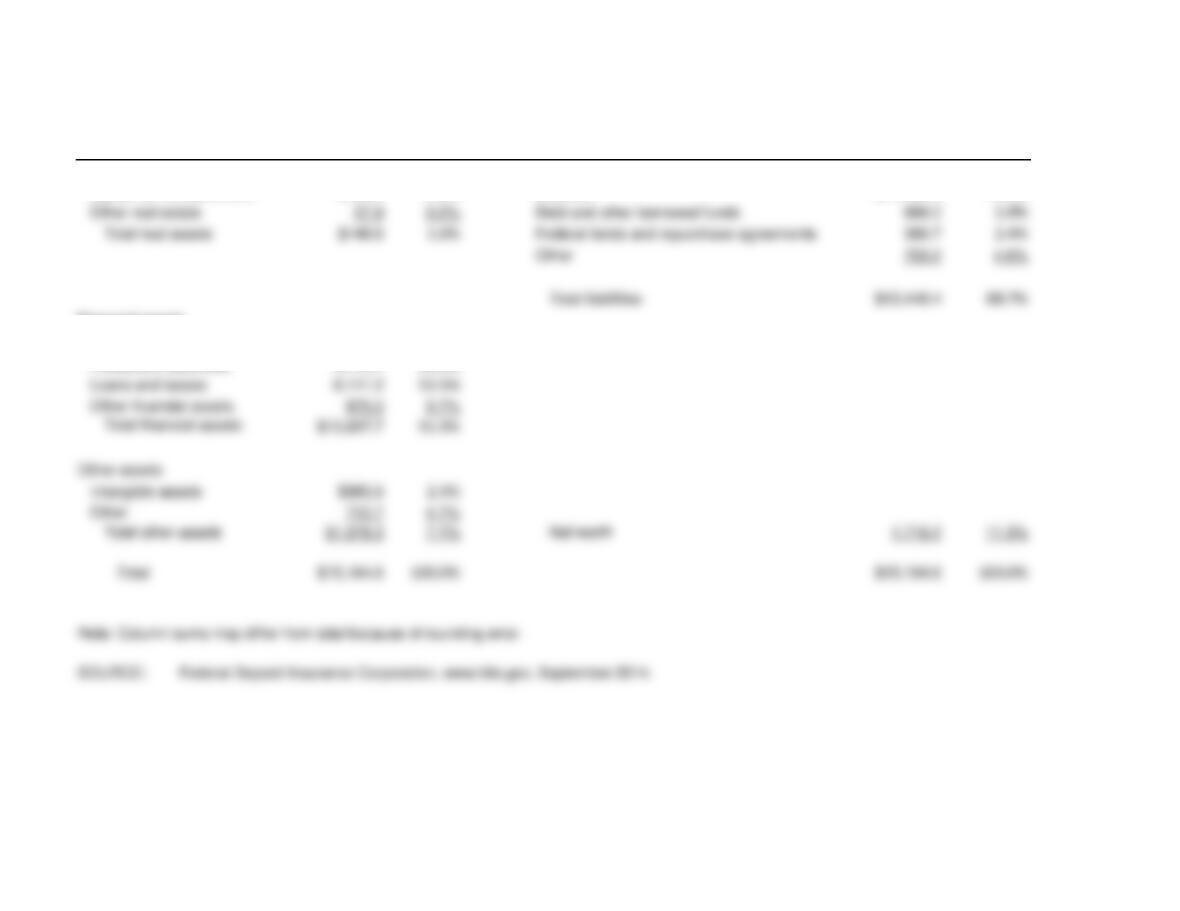
Table 1.3 Balance sheet of FDIC-insured commercial banks and savings institutions
Liabilities and
Assets $ Billion % Total Net Worth $ Billion % Total
Real assets Liabilities
Equipment and premises $120.7
0.8% Deposits $11,490.3 75.8%
Financial assets
Cash $1,843.1
12.2%
Investment securities 3,113.1
20.5%
53.5%
1.0% Federal funds and repurchase agreements 366.7 2.4%
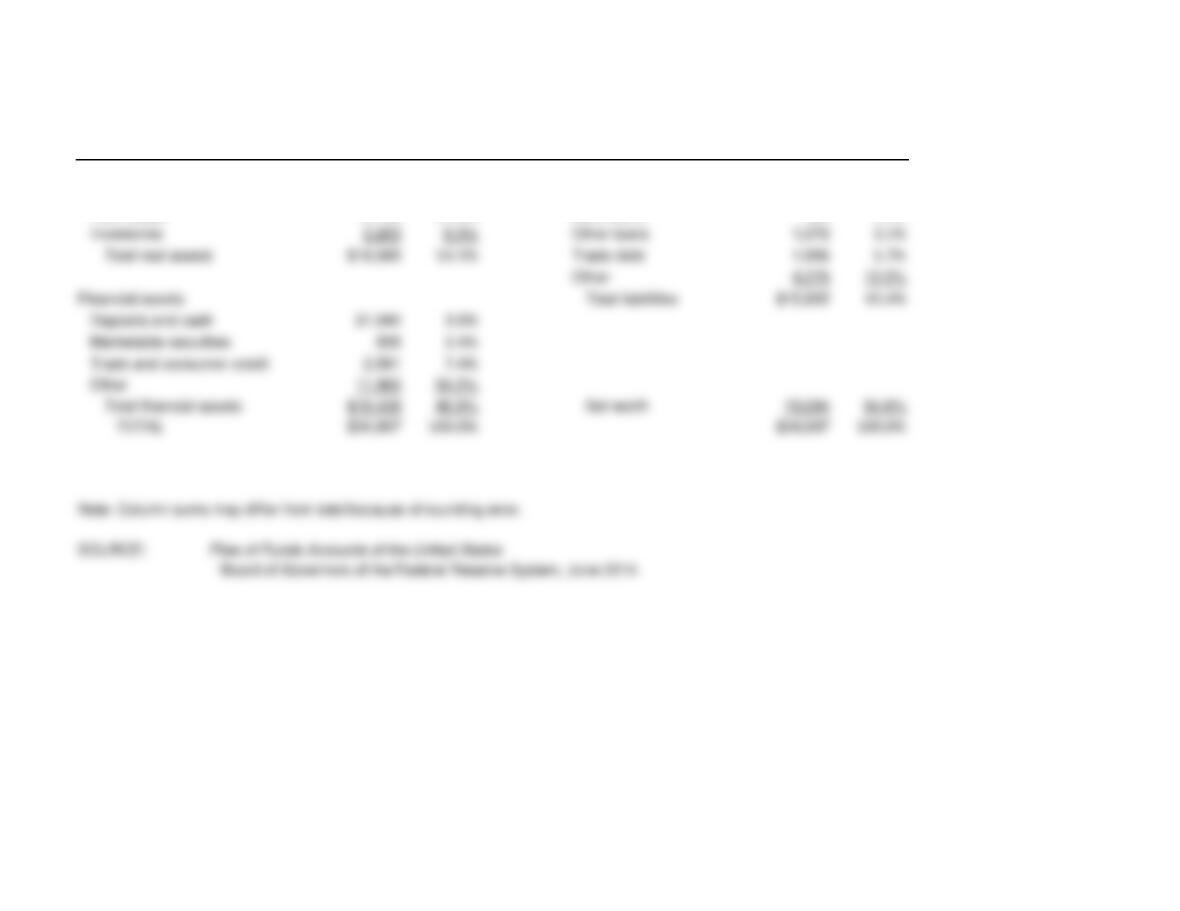
Table 1.4: Balance sheet of U.S. nonfinancial corporations
Liabilities and
Assets $ Billion % Total Net Worth $ Billion % Total
Real assets Liabilities
Equipment & intellectual property $6,200
17.7% Bonds and mortgages $7,905 22.6%
Real estate 10,166
29.0% Bank loans 654 1.9%
53.1% Trade debt 1,996 5.7%