1. Find three points on the efficient frontier corresponding to three different expected
returns.
First select the correct tab, and scroll down to the Portfolio Efficient Frontier
[Select Tab “International Port”]
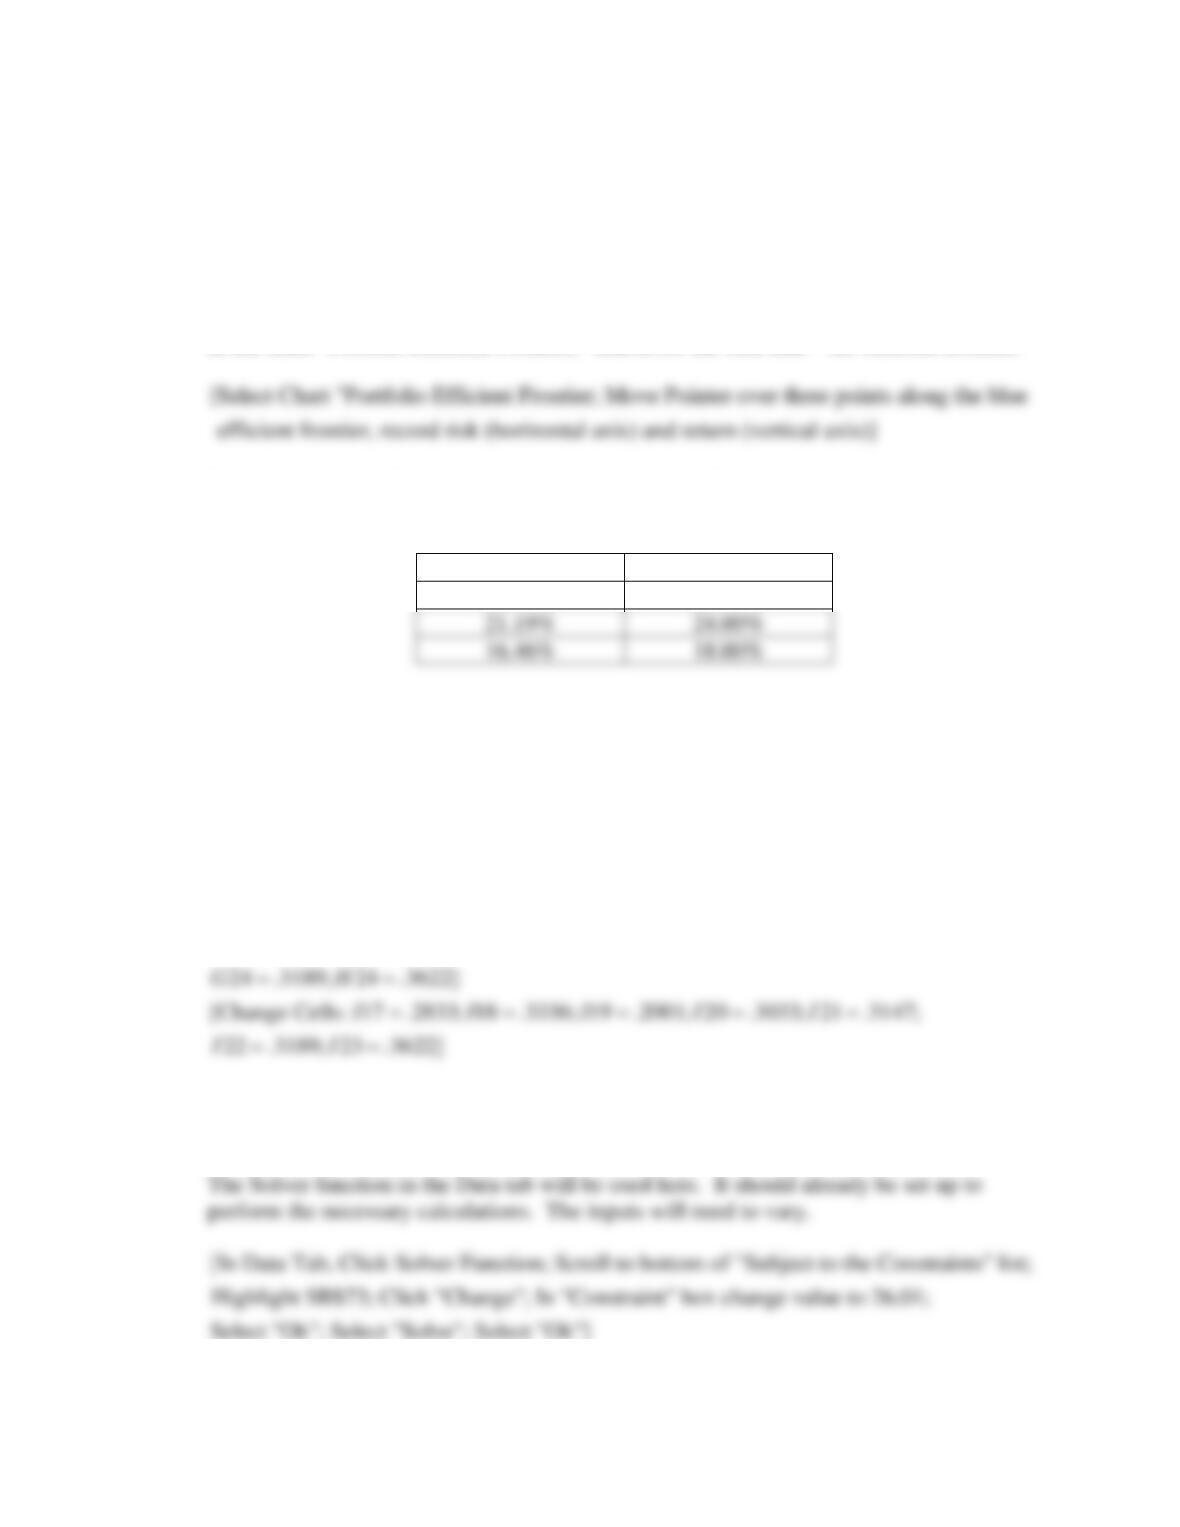
In the chart “Porfolio Efficient Frontier,” search for the blue line—the efficient frontier.
What are the portfolio standard deviations corresponding to each expected return?
For example:
Standard Deviation
Return
26.60%
26.10%
21.19%
24.00%
16.46%
18.00%
2. Now assume that the correlation between the S&P 500 and the other country indexes is
cut in half.
In the correlation matrix (cells B17:I24, still in the International Port tab), the S&P500
row (B24:I24) and the S&P column (I17:I24) will need to be updated by divided each
entry by two.
Results may vary slightly due to rounding:
[Change Cells: 24 .2833; 24 .3336; 24 .2001; 24 .3033; 24 .3147;
B C D E F
= = = = =
Find the new standard deviations corresponding to each of the three expected returns.
Are they higher or lower? Why?
Note the new values in B72 (24.65%) and B73 (26.10%).
Repeat for the other two selected return levels (e.g., 24% and 18%):
[In Data Tab, Click Solver Function; Scroll to bottom of “Subject to the Constraints” list;
[In Data Tab, Click Solver Function; Scroll to bottom of “Subject to the Constraints” list;
Highlight $B$73; Click “Change”; In “Constraint” box change value to 18;
Select “Ok”; Select “Solve”; Select “Ok”]
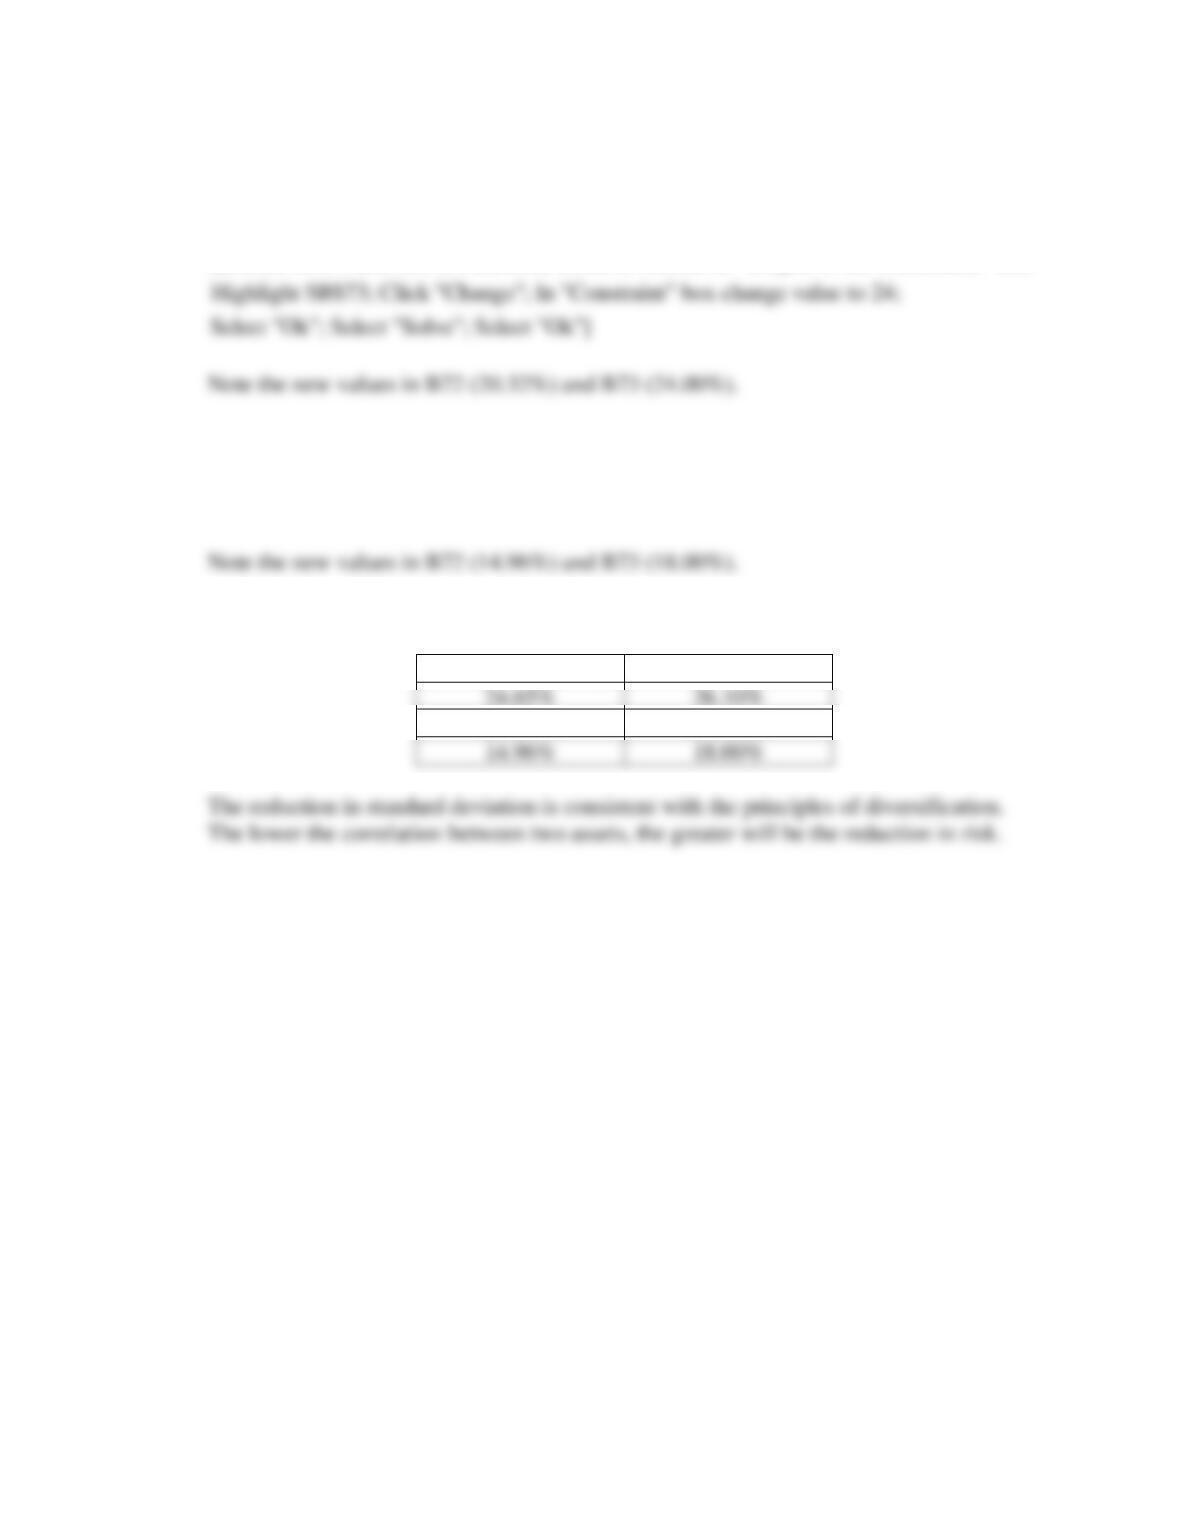
For the selected three expected returns, the new standard deviations:
Standard Deviation
Return
24.65%
26.10%
20.32%
24.00%
14.96%
18.00%
Highlight $B$73; Click “Change”; In “Constraint” box change value to 24;
Select “Ok”; Select “Solve”; Select “Ok”]