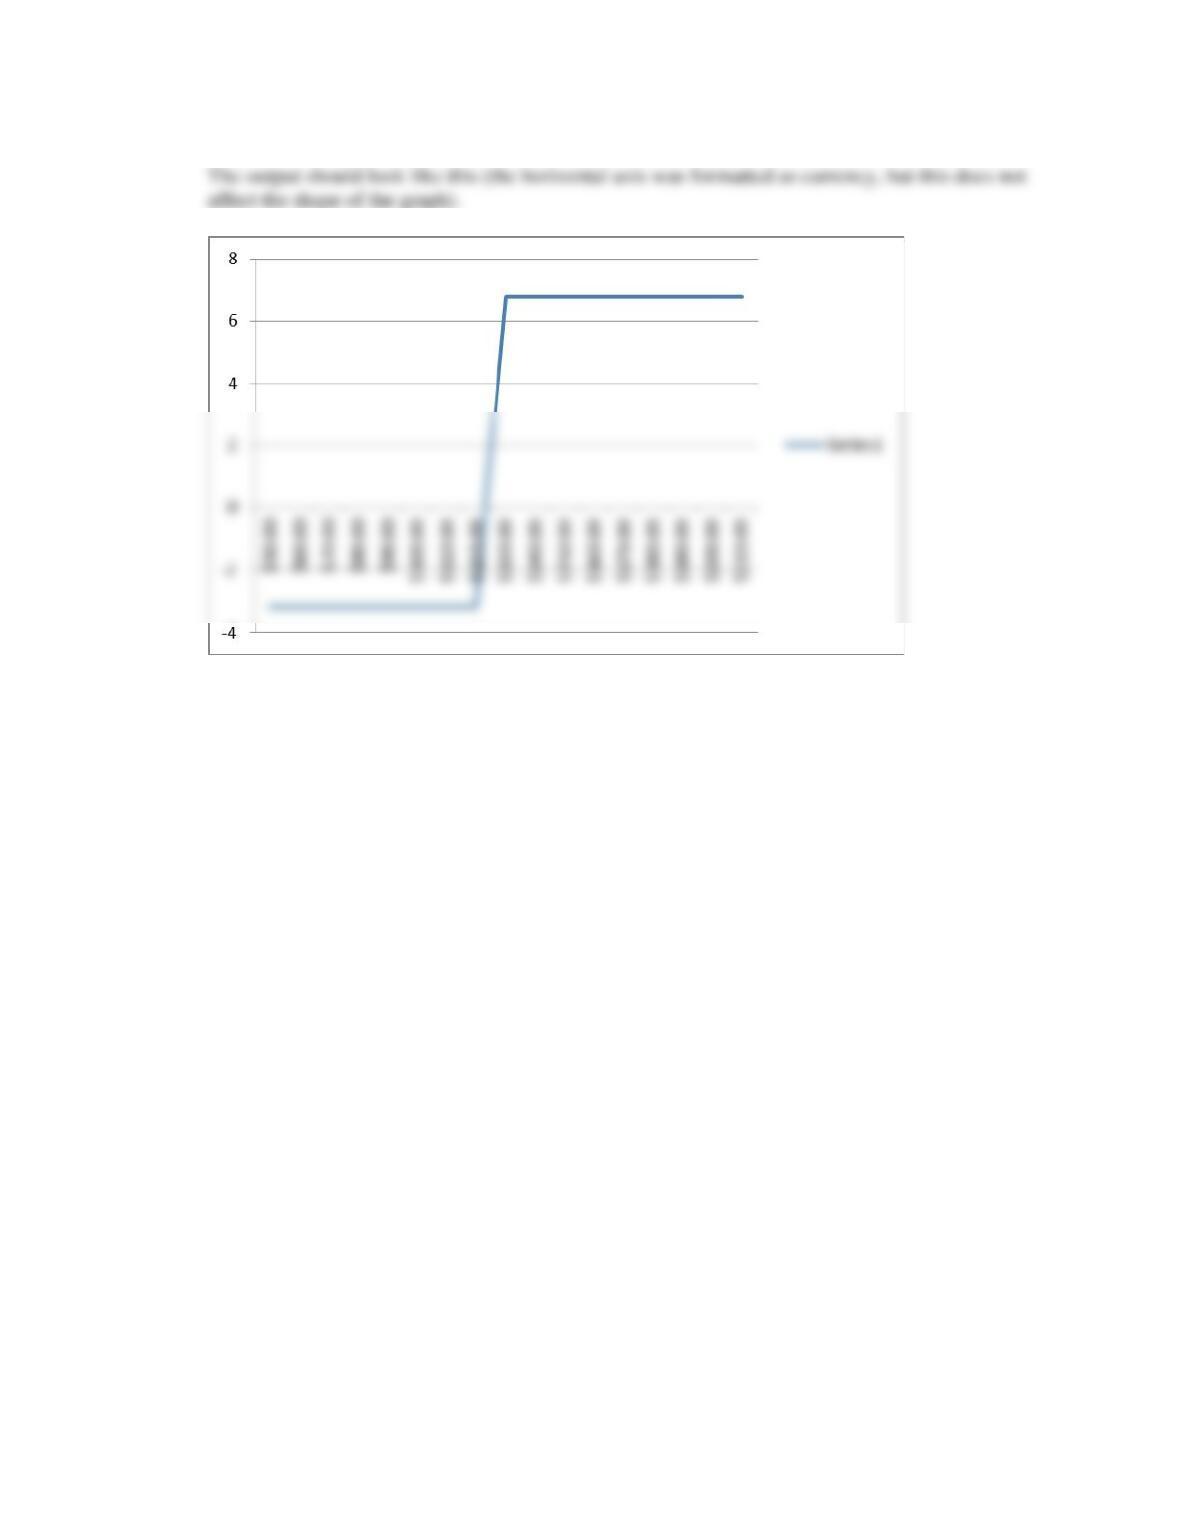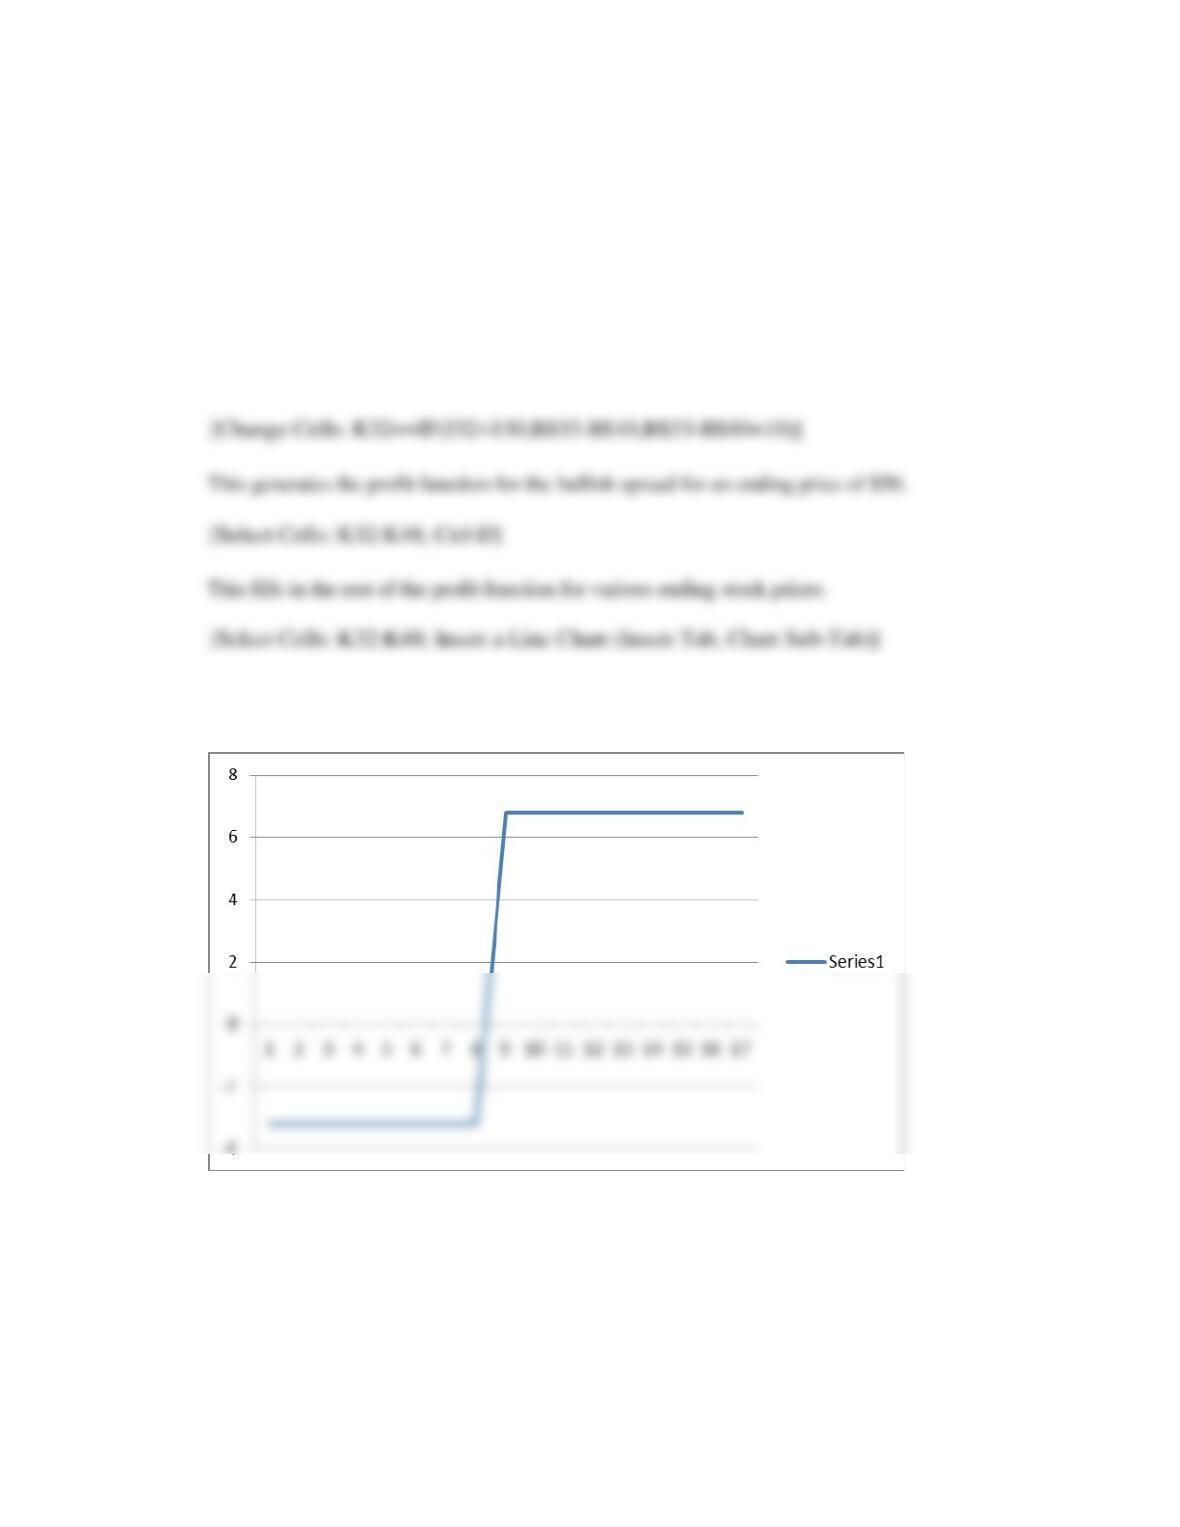
Chapter 15 Excel Application: Spreads and Straddles
1. Use the data in this spreadsheet to plot out the profit on a bullish spread (see Figure
15.10) with X1 = 120 and X2 = 130.
Answers can vary slightly.
[Select Cells: G30:G48; Ctrl-C; Move to Cell J30; Ctrl-V]
This will set up the horizontal axis, the ending share prices
The following should appear (depending on the individual excel settings, the output may slightly
vary):
[Select Chart; Right Click Center of Chart; Select “Select Data…”;
Under “Horizontal (Category) Axis Labels” Select Edit; Select Cells J32:J48;
Click on Ok twice]