
Chapter 9
The Instruments of Trade Policy
◼ Chapter Organization
Basic Tariff Analysis
Supply, Demand, and Trade in a Single Industry
Effects of a Tariff
Measuring the Amount of Protection
Costs and Benefits of a Tariff
Consumer and Producer Surplus
Measuring the Costs and Benefits
Box: Tariffs for the Long Haul
Other Instruments of Trade Policy
Export Subsidies: Theory
Case Study: Europe’s Common Agricultural Policy
Import Quotas: Theory
Case Study: An Import Quota in Practice: U.S. Sugar
Voluntary Export Restraints
Case Study: A Voluntary Export Restraint in Practice
Local Content Requirements
Box: Bridging the Gap
Other Trade Policy Instruments
The Effects of Trade Policy: A Summary
Summary
APPENDIX TO CHAPTER 9: Tariffs and Import Quotas in the Presence of Monopoly
The Model with Free Trade
The Model with a Tariff
The Model with an Import Quota
Comparing a Tariff and a Quota

46 Krugman/Obstfeld/Melitz • International Economics: Theory & Policy, Tenth Edition
◼ Chapter Overview
This chapter and the next three focus on international trade policy. Students will have heard in the media
various arguments for and against restrictive trade practices. Some of these arguments are sound, and some
are clearly not grounded in fact. This chapter provides a framework for analyzing the economic effects of
trade policies by describing the tools of trade policy and analyzing their effects on consumers and
producers in domestic and foreign countries. Case studies discuss actual episodes of restrictive trade
practices. An instructor might try to underscore the relevance of these issues by having students scan
newspapers and magazines for other timely examples of protectionism at work.
The analysis presented here takes a partial equilibrium view, focusing on demand and supply in one market,
rather than the general equilibrium approach followed in previous chapters. Import demand and export
supply curves are derived from domestic and foreign demand and supply curves. There are a number of
trade policy instruments analyzed in this chapter using these tools. Some of the important instruments
of trade policy include specific tariffs, defined as taxes levied as a fixed charge for each unit of a good
imported; ad valorem tariffs, levied as a fraction of the value of the imported good; export subsidies, which
are payments given to a firm or industry that ships a good abroad; import quotas, which are direct restrictions
on the quantity of some good that may be imported; voluntary export restraints, which are quotas on trading
that are imposed by the exporting country instead of the importing country; and local content requirements,
which are regulations that require that some specified fraction of a good is produced domestically.
The import supply and export demand analysis assumes a large country tariff, in which the imposition of a
tariff drives a wedge between prices in domestic and foreign markets, and increases prices in the country
imposing the tariff and lowers the price in the other country by less than the amount of the tariff. This
contrasts with most textbook presentations, which make the small country assumption that the domestic
internal price equals the world price plus the tariff. The chapter also discusses how the actual protection
provided by a tariff may not equal the tariff rate if imported intermediate goods are used in the production
of the protected good. The proper measurement, the effective rate of protection, is described in the text and
calculated for a sample problem.
The analysis of the costs and benefits of trade restrictions require tools of welfare analysis. The text explains
the essential tools of consumer and producer surplus. Consumer surplus on each unit sold is defined as the
difference between the actual price and the amount that consumers would have been willing to pay for
the product. Geometrically, consumer surplus is equal to the area under the demand curve and above the
price of the good. Producer surplus is the difference between the minimum amount for which a producer
is willing to sell his product and the price that he actually receives. Geometrically, producer surplus is
equal to the area above the supply curve and below the price line. These tools are fundamental to the
student’s understanding of the implications of trade policies and should be developed carefully.
The costs of a tariff include distortionary efficiency losses in both consumption and production. A tariff
provides gains from terms of trade improvement when and if it lowers the foreign export price. Summing
the areas in a diagram of internal demand and supply provides a method for analyzing the net loss or gain
from a tariff. The gain from a tariff is larger the greater is the decrease in foreign export price from the
tariff (as the tariff-imposing country is able to pass some of the costs of the tariff on to foreign exporters).
Because large countries will have a larger influence on export prices than small countries, a large country
is more likely to gain and, therefore, impose an import tariff.
Other instruments of trade policy can be analyzed with this method. An export subsidy operates in
exactly the reverse fashion of an import tariff. For example, Europe’s common agricultural policy has
raised the price European farmers receive so much that Europe ends up exporting agricultural goods
despite very high labor and land costs. The net cost of this shift to consumers is about $30 billion a year.
Chapter 9 The Instruments of Trade Policy 47
An import quota has similar effects as an import tariff upon prices and quantities, but revenues, in the form
of quota rents, accrue to the quota license holders, who are often foreign producers. For example, a quota
on sugar imported into the United States has greatly increased the fortunes of foreign sugar producers
(many of which are owned by American sugar refiners), at a significant cost to American consumers.
Estimates place the cost of each job in the American sugar industry “saved” by protection at $1.75 million.
Voluntary export restraints are a form of quotas in which import licenses are held by foreign governments.
For example, Japan voluntarily limited exports of cars to the United States to forestall any import tariffs on
cars from Japan in the wake of the oil price spike of 1979. The net result of these VER’s was to raise the
price of Japanese cars, with the gains accruing directly to Japanese manufacturers. A similar story is
happening now with voluntary export restraints on solar panels exported from China to the European
Union.
Another trade instrument is to mandate local content requirements. These raise the price of imports as well
as domestic goods competing with imports but do not yield either tariff revenue or quota rents. The recent
construction of the new Bay Bridge linking San Francisco and Oakland is used as a case study. Federal
◼ Answers to Textbook Problems
1. The import demand equation, MD, is found by subtracting the Home supply equation from the Home
48 Krugman/Obstfeld/Melitz • International Economics: Theory & Policy, Tenth Edition
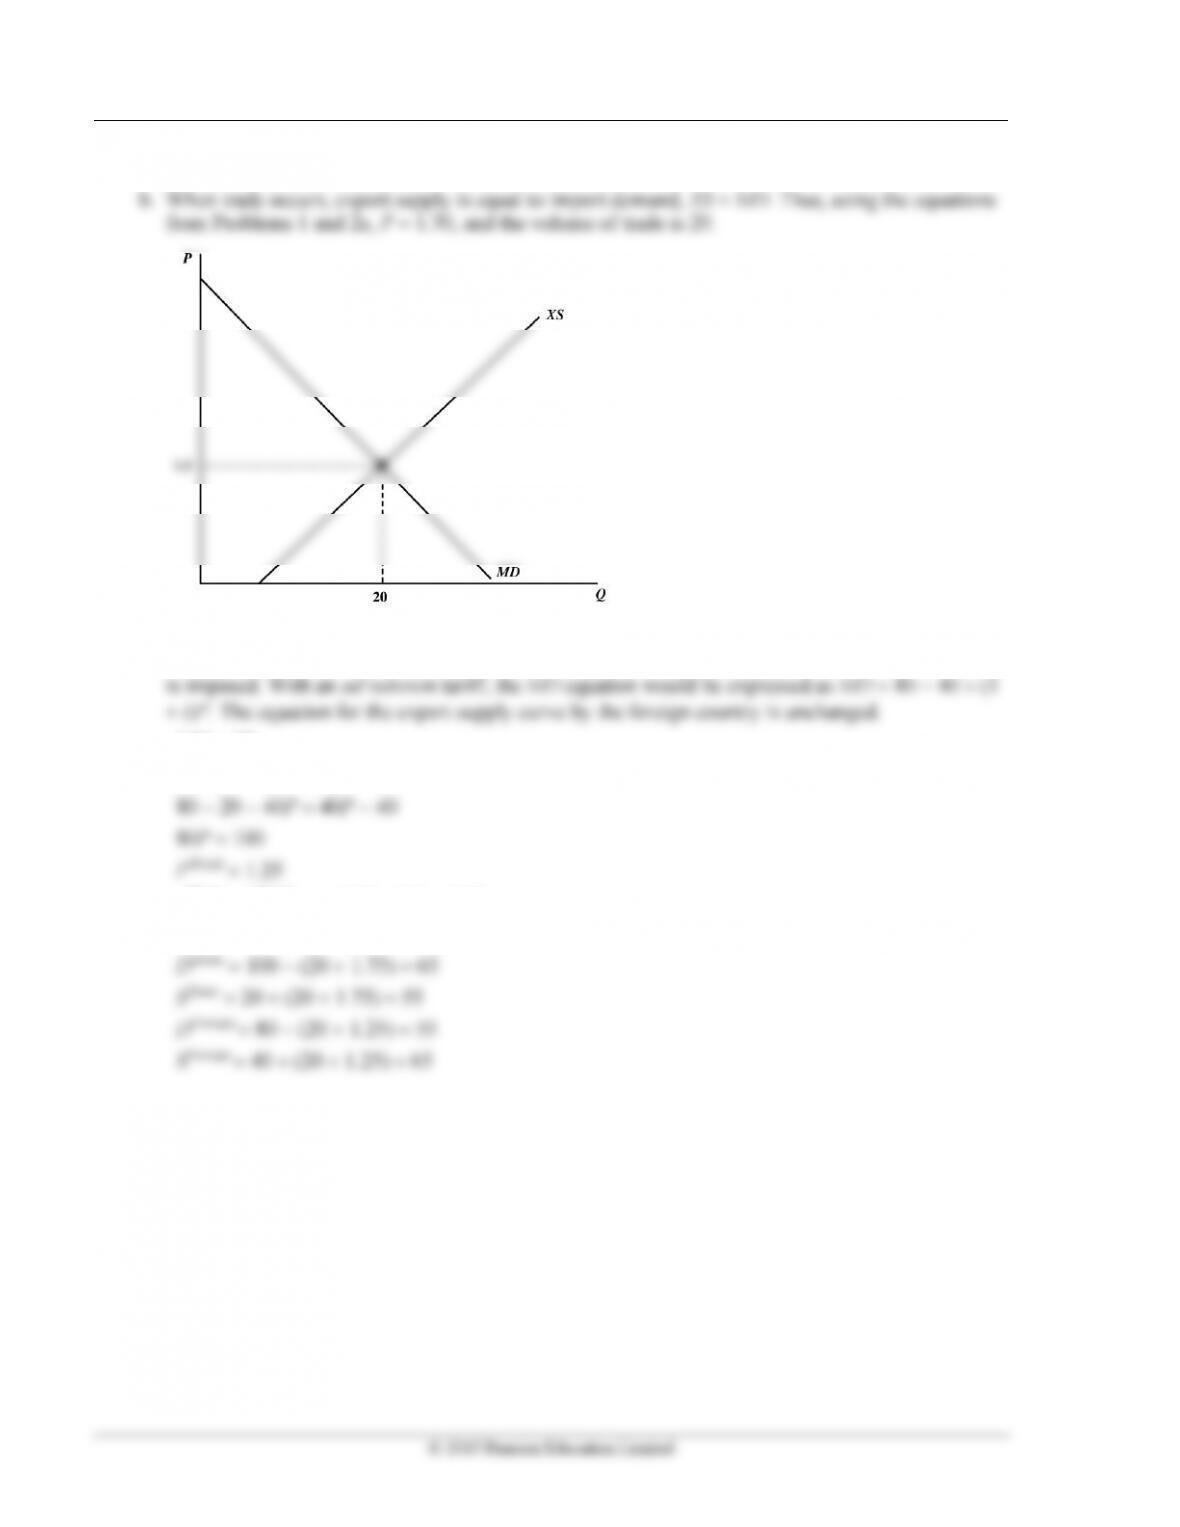
2. a. Foreign’s export supply curve, XS, is XS = −40 + 40 P. In the absence of trade, the price is 1.
3. a. The new MD curve is 80 − 40 (P + t) where t is the specific tariff rate, equal to 0.5. (Note: In
solving these problems, you should be careful about whether a specific tariff or ad valorem tariff
MD = XS
80 − 40 (P + 0.5) = 40P − 40
PHome = PWorld + t = 1.25 + 0.5 = 1.75
Trade = MD = XS = (40 1.25) − 40 = 10
Chapter 9 The Instruments of Trade Policy 49
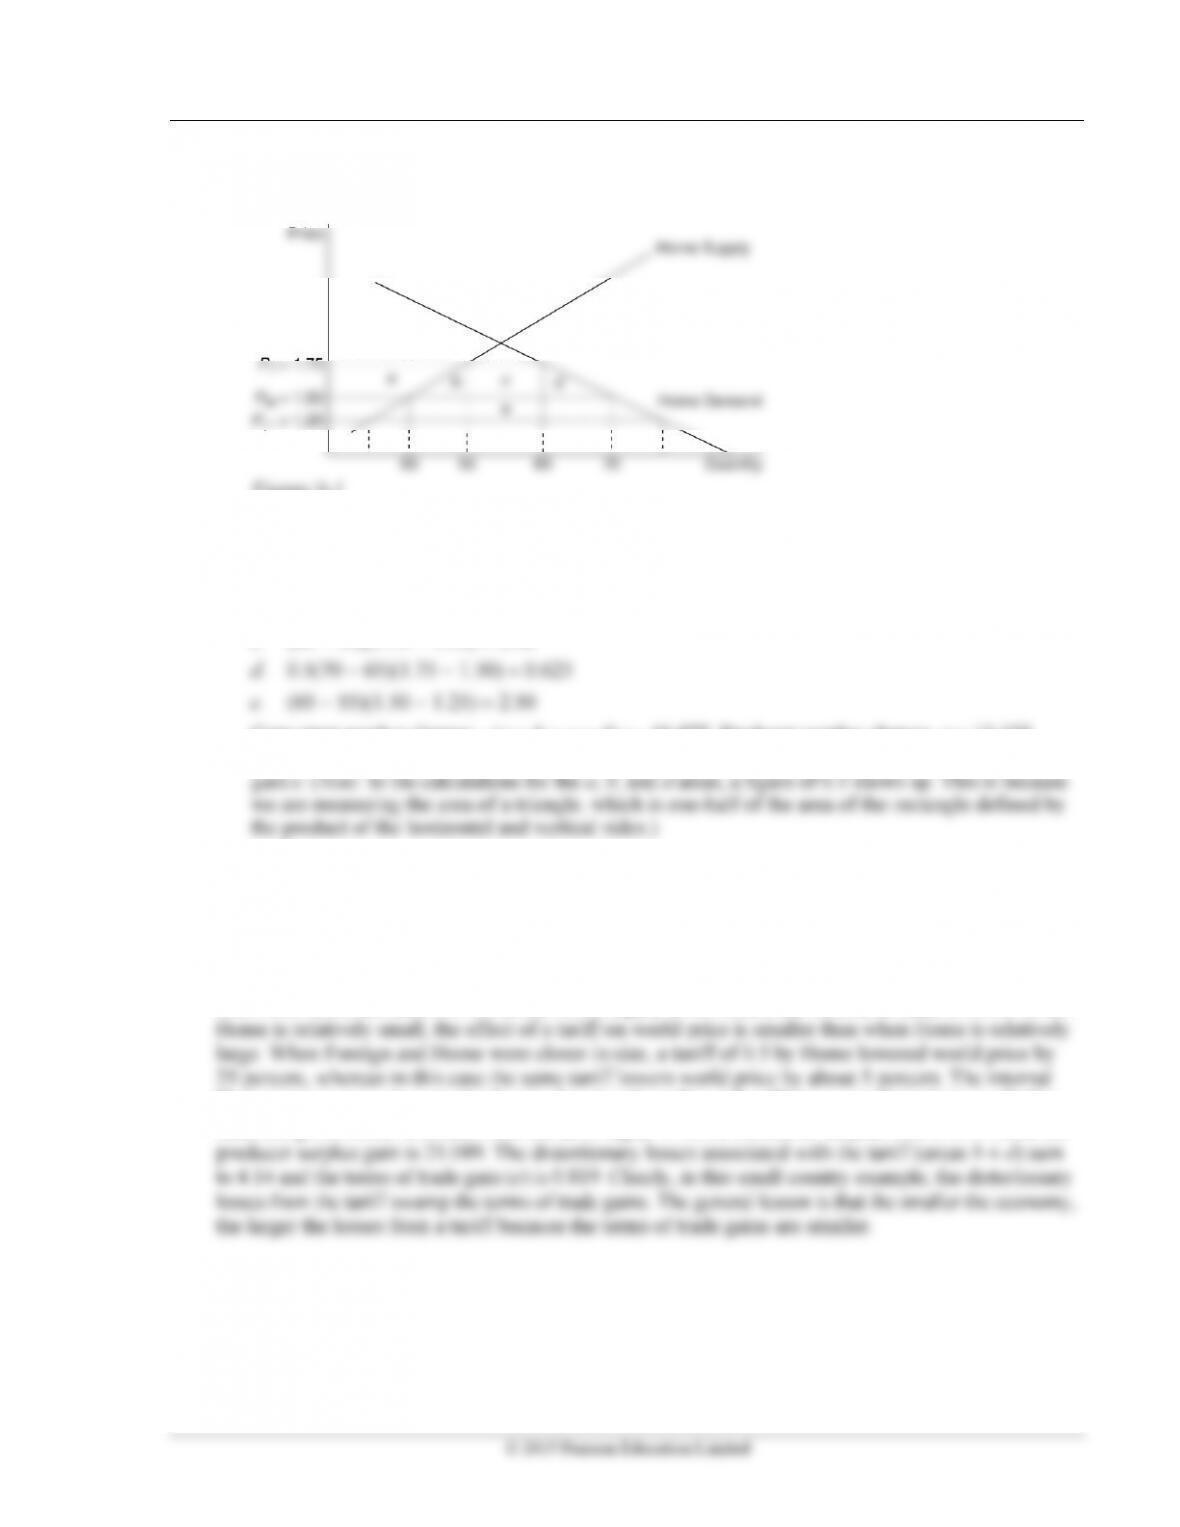
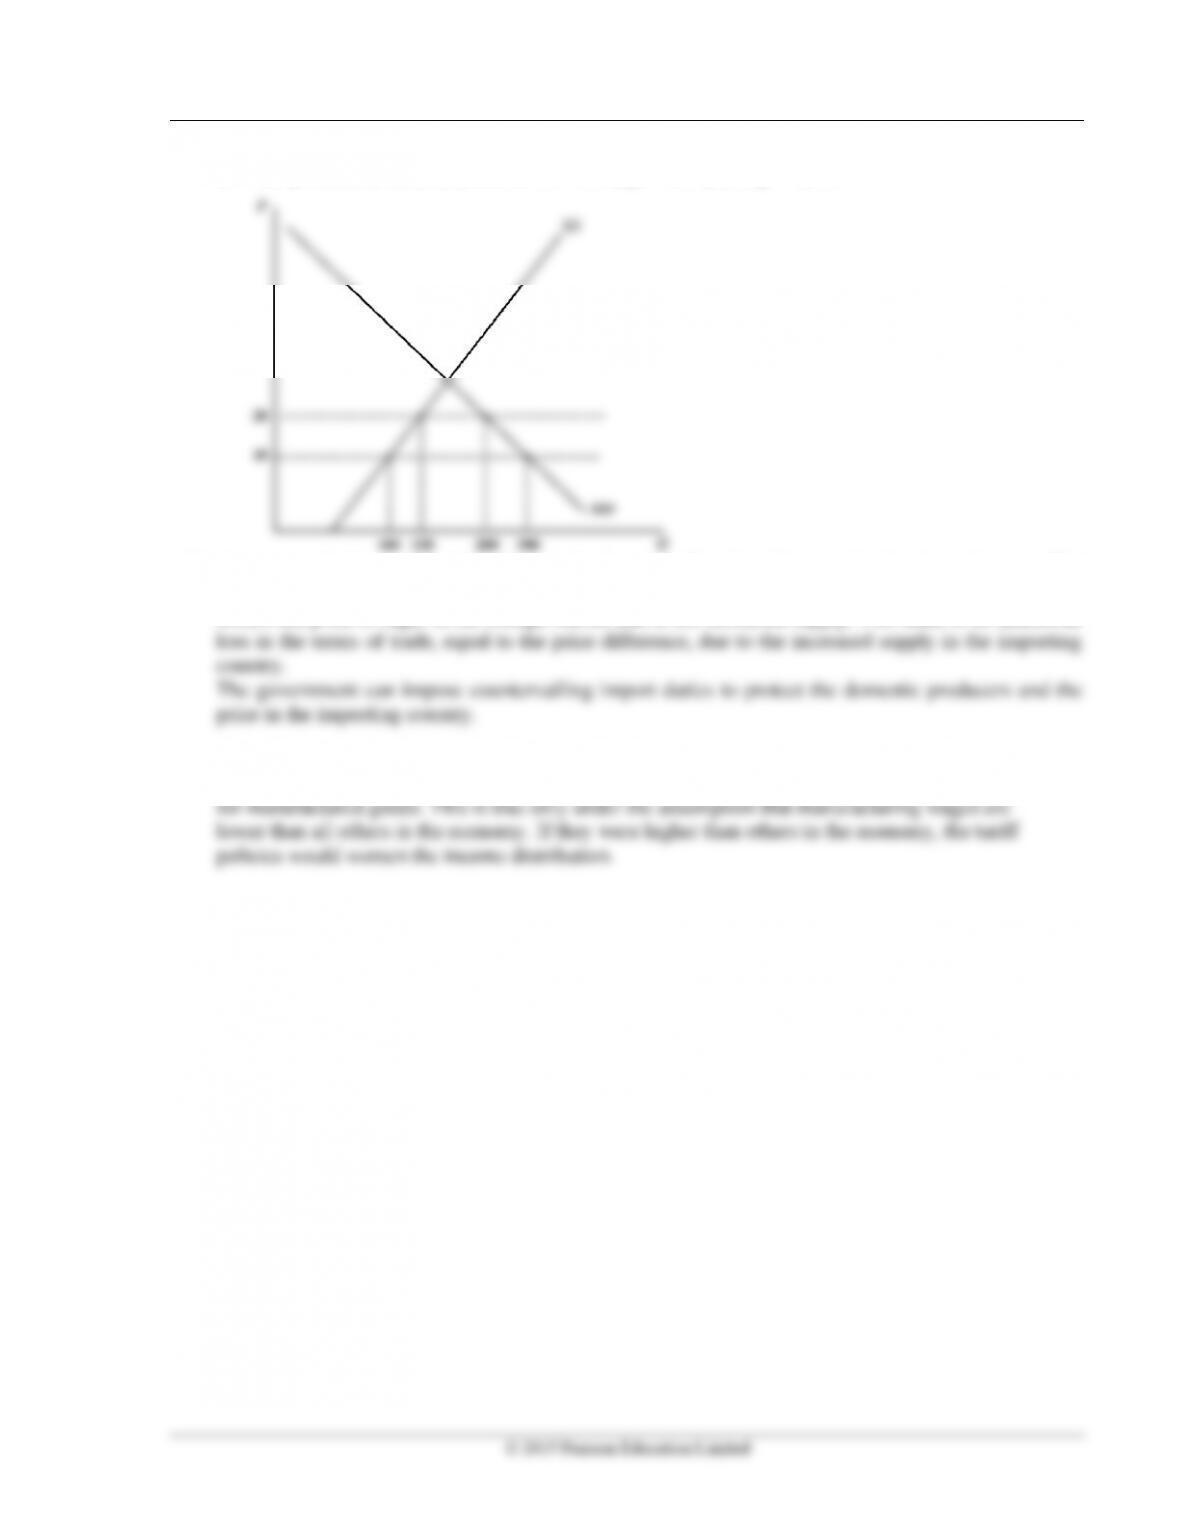
b. and c. The welfare of the Home country is best studied using the combined numerical and
graphical solutions presented below in Figure 9-1.
Figure 9-1
where the areas in the figure are:
a. 55(1.75 − 1.50) − 0.5(55 − 50)(1.75 − 1.50) = 13.125
b. 0.5(55 − 50)(1.75 − 1.50) = 0.625
c. (65 − 55)(1.75 − 1.50) = 2.50
Consumer surplus change: −(a + b + c + d) = −16.875. Producer surplus change: a = 13.125.
Government revenue change: c + e = 5. Efficiency losses b + d are exceeded by terms of trade
4. Using the same solution methodology as in Problem 3, when the Home country is very small relative
to the Foreign country, its effects on the terms of trade are expected to be much smaller. The small
country is much more likely to be hurt by its imposition of a tariff. Indeed, this intuition is shown in this
problem. The free trade equilibrium is now at the price $1.09 and the trade volume is now 36.40.
With the imposition of a tariff of 0.5 by Home, the new world price is $1.045, the internal Home price
is $1.545, Home demand is 69.10 units, Home supply is 50.90, and the volume of trade is 18.20. When
Home price is now closer to the free trade price plus t than when Home was relatively large. In this
case, the government revenues from the tariff equal 9.10, the consumer surplus loss is 33.51, and the
50 Krugman/Obstfeld/Melitz • International Economics: Theory & Policy, Tenth Edition
5. Dumping is a situation of selling the product at a lower price in the international market compared to
the domestic market. An anti-dumping shows that the companies sell the product lower than the cost
6. An imposition of tariff increases the price of the product at home. This leads to a decrease in quantity
demanded, hence a decrease in import. As demand decreases the income of the exporting country
also falls. A decline in income of the export country leads to a reduction in demand for foreign goods.
This means, the export of the home country also declines. An imposition of protective tariff increases
domestic employment, competing with the foreign industries. This is because, a low import of
7. We first use Foreign’s export supply and Home’s import demand curves to determine the new
world price. The Foreign supply of exports curve, with a Foreign subsidy of 0.5 per unit, becomes
XS = −40 + 40(1 + 0.5) P. The equilibrium world price is 1.2, and the internal Foreign price is 1.8.
The volume of trade is 32. The Foreign demand and supply curves are used to determine the costs
and benefits of the subsidy. Construct a diagram similar to that in the text and calculate the area of
8. a. False, unemployment has more to do with labor market issues and the business cycle than with
tariff policy. Empirical estimates suggest that the cost to society of jobs saved through tariffs is
exorbitantly high, and tariffs may actually increase unemployment in nonprotected industries.
9. At a price of $10 per bag of peanuts, Acirema imports 200 bags of peanuts. A quota limiting the
import of peanuts to 50 bags has the following effects:
Chapter 9 The Instruments of Trade Policy 51
d. The production distortion loss is 0.5 50 bags $10 per bag = $250.
10. An export subsidy would reduce the supply of sugar in Brazil and hence raise the domestic price. The
rise in domestic price is less than 20%. The terms of trade will worsen for Brazil. This is because it
lowers the price of sugar in the foreign market due to the increased supply. This leads to an additional
11. It would improve the income distribution within the economy because wages in manufacturing
would increase, and real incomes for others in the economy would decrease due to higher prices