
Assumptions Rate Values
Initial spot rate, 1999 (Sucre/$) S1 5,000
Ending spot rate, 1999 (Sucre/$) S2 25,000
Problem 9.1 Ecuadorian Sucre
The Ecuadorian sucre (S) suffered from hyper-inflationary forces throughout 1999. Its value
moved from S5,000/$ to S25,000/$. What was the percentage change in its value?
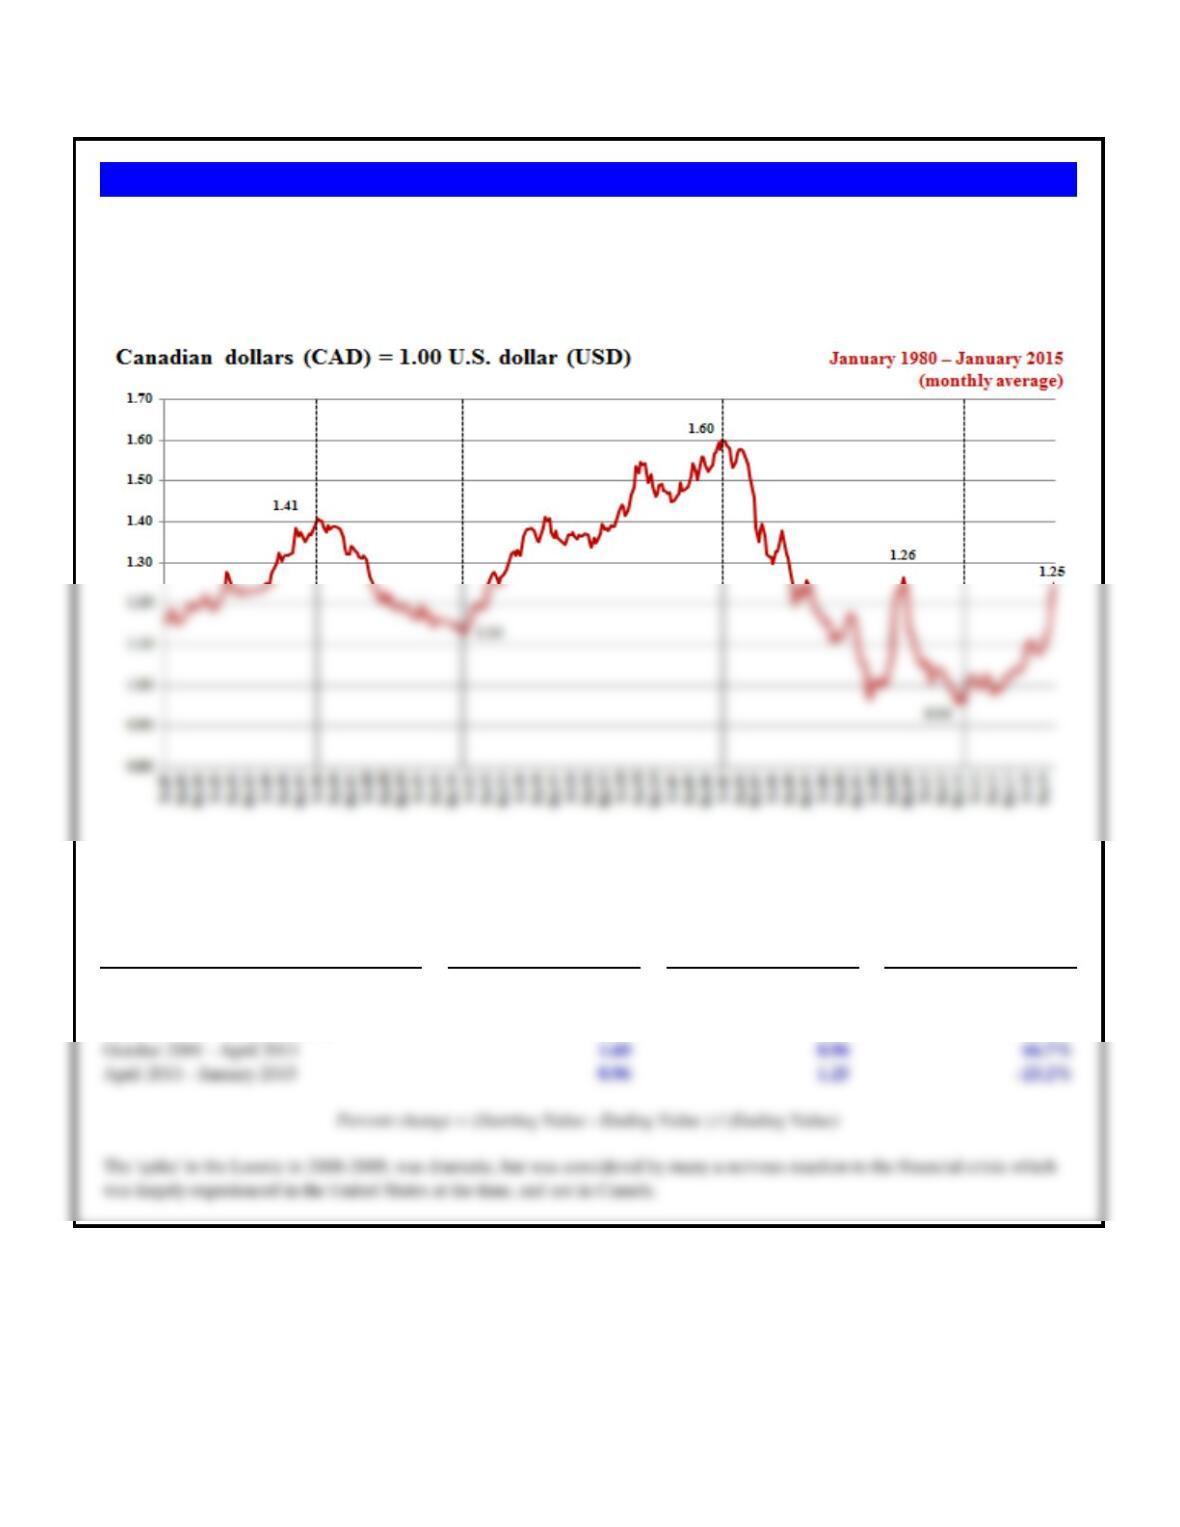
The following values are taken from the graph.
Change in the value
Starting Value Ending Value of the loonie
Time Period (C$/US$) (C$/US$) (percent)
January 1980 – January 1986 1.16 1.41 -17.7%
January 1986 – October 1991 1.41 1.13 24.8%
October 1991 – December 2001 1.13 1.60 -29.4%
The Canadian dollar’s value against the U.S. dollar has seen some significant changes over recent history. Using the following
graph of the C$/US$ exchange rate for the 30 year period between 1980 and end-of-year 2010 to estimate the percentage change in
the Canadian dollar’s value (its affectionately known as the “loonie”) versus the dollar for the following periods.
Problem 9.2 Canadian Dollar

a. What was the percentage change in the value of the Nigerian naira versus the dollar the first trading day?
b. What was the percentage change in the value of the naira versus the dollar by August 18, 2016?
NGN NGN
Assumptions Rate Per USD Per EUR
Initial spot rate, June 17 S1 196.50 221.2001
Closing spot rate, June 20 S2 279.50 316.7294
Closing spot rate, August 17 S3 324.50 347.7721
Calculation of percentage change:
a) and c) Percentage change in the first day of trading -29.70% -30.16%
Problem 9.3 Nigerian Naira’s Nightmare
On Friday June 17, 2016, the Central Bank of Nigeria (CBN) abandoned the Nigerian naira’s (NGN or ₦) fixed exchange
rate and allowed the currency to float. Previously fixed against the U.S. dollar at NGN 196.50 = 1.00 USD, the naira closed
at NGN 279.50/USD on Monday June 20, the first day of trading following the float. The naira quickly quickly floated
(sunk) to NGN 324.50/USD by August 18. Similarly, the naira fell from NGN 221.2001 = 1.00 EUR toNGN316.7294 /EUR
on June 20, and NGN 347.7721/EUR on August 18.

Assumptions Values
Spot rate, February 20, 2001 (TL/$) 68,000
a. What was the exchange rate after devaluation?
Spot rate after devaluation 85,000
Check calculation: percentage change in values -20.0%
b. What was percentage change after falling to TL100,000/$?
Problem 9.4 Istanbul’s Issues
The Turkish lira (TL) was officially devalued by the Turkish government in February 2001
during a severe political and economic crisis. The Turkish government announced on February
21st that the lira would be devalued by 20%. The spot exchange rate on February 20th was
TL68,000/$.
“Eye-balled”
Date Values
October 1st
496.740307
November 4th
515.490775
Percent change -3.64%
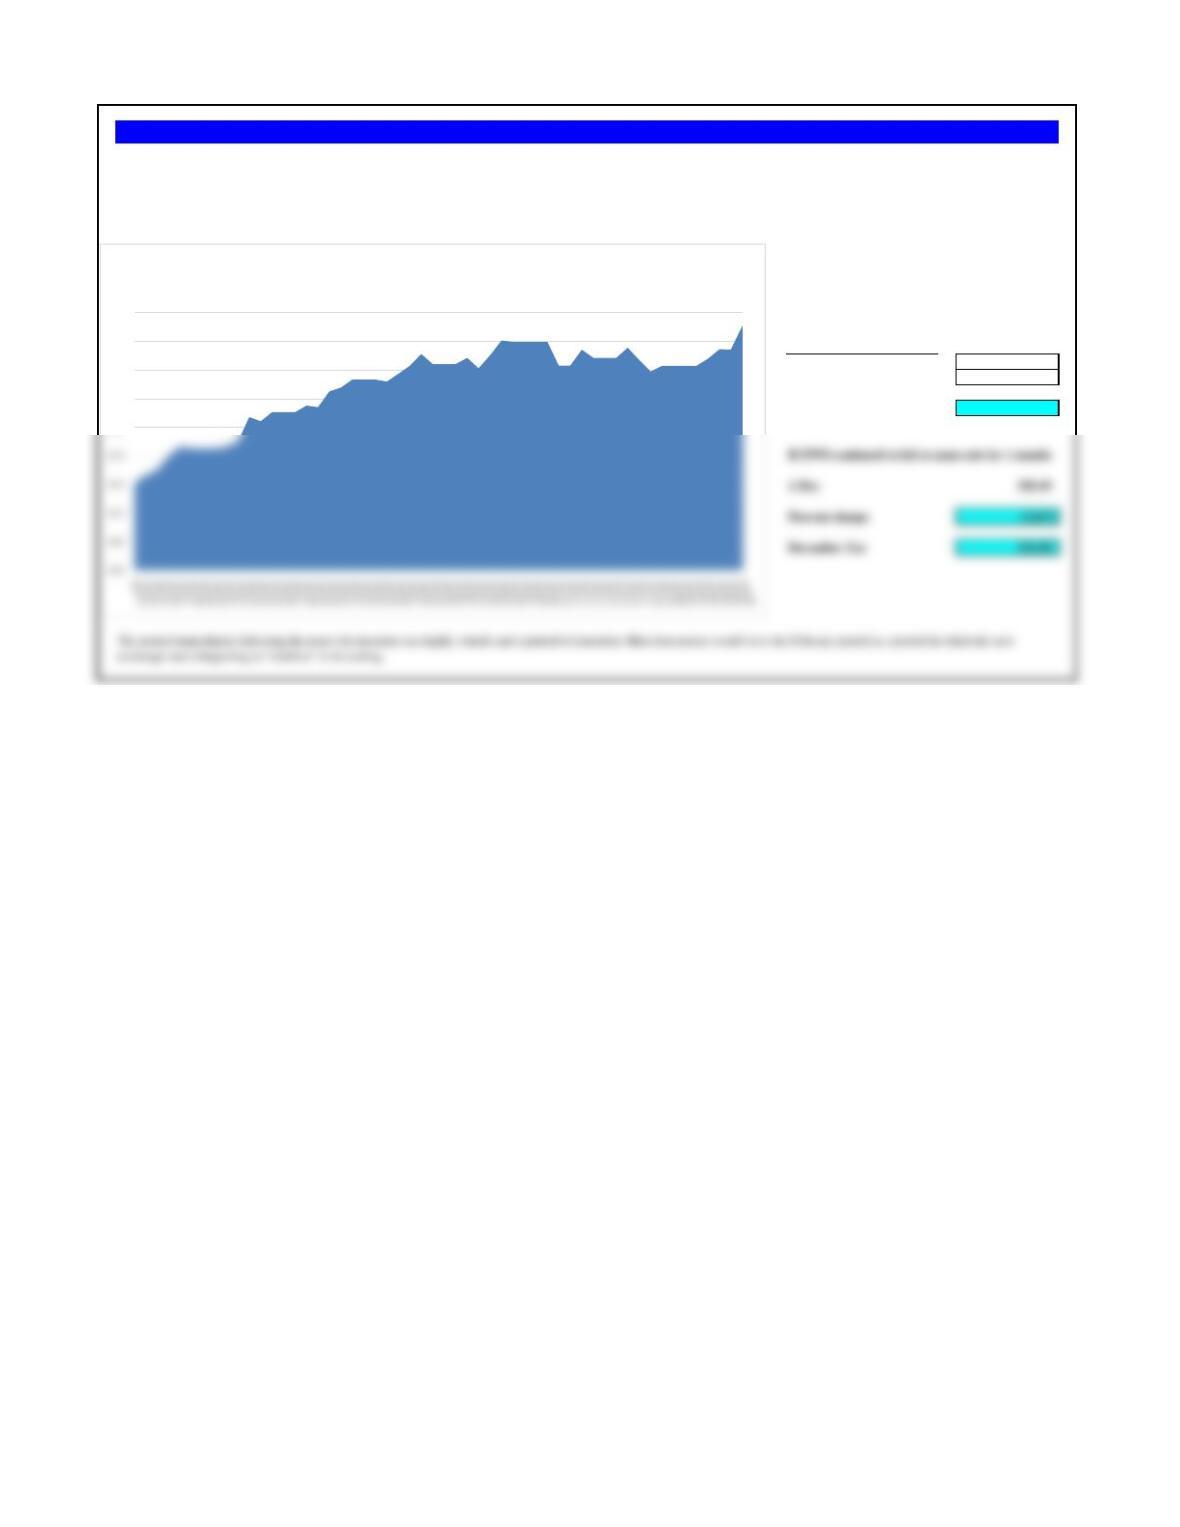
exchange rate is beginning to “stabilize” in its trading.
Problem 9.5 Zimbabwean Devaluation
As illustrated in the graph at the top of this page, the Zimbabwe dollar depreciated against the euro from ZWD 460.52 to ZWD 515.49 in a span of three months. After a brief period of high
volatility, the Zimbabwean dollar appeared to settle down into a range varying from 501 to 515 Zimbabwean dollars per euro. If you were forecasting the Zimbabwean dollar further into the
future, to December 5, 2010, how would you use the information in the graphic—the value of the Zimbabwean dollar freely floating in the weeks following devaluation—to forecast its
future value?
490
500
510
520
Problem 9.5: Zimbabwe Devaluation
Zimbabwe dollar (ZWD) = 1.00 Euro (€)

Assumptions Rate Values
Opening spot rate, July 2, 1997 (Bt/$) S1 25.00
Closing spot rate, July 2, 1997 (Bt/$) S2 29.00
Problem 9.6 Bangkok Broken
The Thai baht (Bt) was devalued by the Thai government from BT25/$ to BT29/$ on July 2,
1997. What was the percentage devaluation of the baht?

Assumptions Values
Spot rate, Thursday, January 24, 2008, R$/$ 1.80
Spot rate, Monday, January 26, 2009, R$/$ 2.39
Problem 9.7 Reais Crisis
The Brazilian reais’ (BRL or R$) value was BRL 1.80 to 1.00 USD on Thursday
January 24, 2008, then plunged in value to BRL 2.39 to 1.00 USd on January 26, 2009.
What was the percentage change in its value?
a. What is the value of Conchita’s portfolio as measured in Mexican pesos?
Mikhail’s balances by currency:
(in millions)
US dollars
USD 450
Swiss francs
CHF 200
Mexican pesos
MXN 950.00
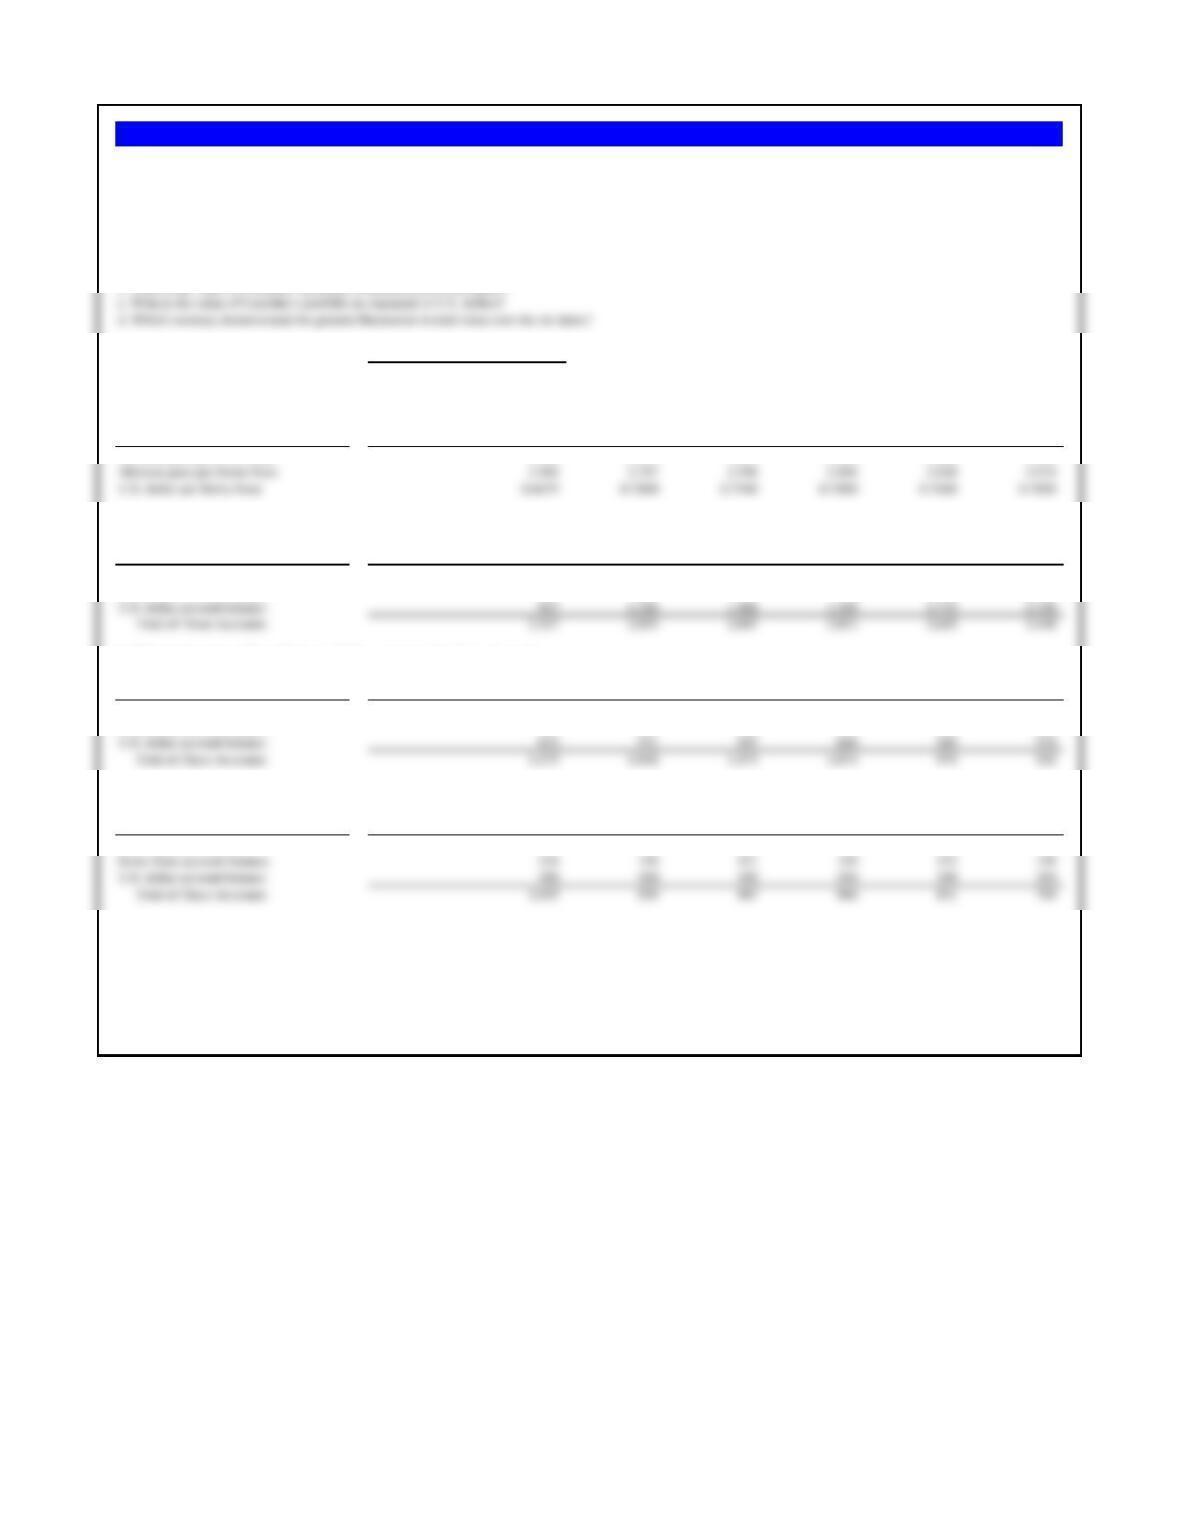
Exchange Rates 11/3/1993 11/3/1994 12/5/1994 12/16/1994 12/30/1994 1/30/1995
a. What is the value of Conchita’s portfolio as measured in Mexican pesos?
Portfolio Value as Measured in MXN 11/3/1993 11/3/1994 12/5/1994 12/16/1994 12/30/1994 1/30/1995
MXN account balance 950 950 950 950 950 950
Swiss franc account balance 630 687 689 693 1,000 1,260
b. What is the value of Conchita’s portfolio as measured in Swiss francs?
Portfolio Value as Measured in francs 11/3/1993 11/3/1994 12/5/1994 12/16/1994 12/30/1994 1/30/1995
MXN account balance 302 277 276 274 190 151
Swiss franc account balance 200 200 200 200 200 200
c. What is the value of Conchita’s portfolio as measured in U.S. dollars?
Portfolio Value as Measured in dollars 11/3/1993 11/3/1994 12/5/1994 12/16/1994 12/30/1994 1/30/1995
MXN account balance 452 351 366 366 249 191
d. Which currency demonstrated the greatest fluctuation in total value over the six dates?
Problem 9.8 Conchita’s Dilemma
Conchita Marquez is a famous Mexican entrepreneur with a multi-million-dollar business dealing in copper. In 1994, she decided to take up residence in Switzerland as part of
her longterm retirement plans, which included transferring all her wealth.
In November 1994, Conchita held a portfolio of USD 450 million and CHF 200 million in Swiss banks, in addition to accounts in Mexico holding MXN 950 million. Using the
exchange rate table, answer the following:

Exchange Rates 11/3/1993 11/3/1994 12/5/1994 12/16/1994 12/30/1994 1/30/1995
Mexican peso per U.S. dollar 3.150 3.433 3.443 3.464 5.000 6.300
Mexican peso per Swiss franc 2.104 2.707 2.596 2.598 3.820 4.974
U.S. dollar per Swiss franc 0.6679 0.7880 0.7540 0.7500 0.7640 0.7890
Percentage Change 11/3/1993 11/3/1994 12/5/1994 12/16/1994 12/30/1994 1/30/1995
11/3/1993-12/16/1994
MXN vs Swiss franc, period -45.5%
MXN vs US dollar, period -45.6%
Problem 9.9 La Conquista—The Mexican Dance
Calculate the percentage change in the value of the peso for the three different cross-rates shown in the table for the six dates. Did the peso fall further against
the U.S. dollar or the Swiss franc?
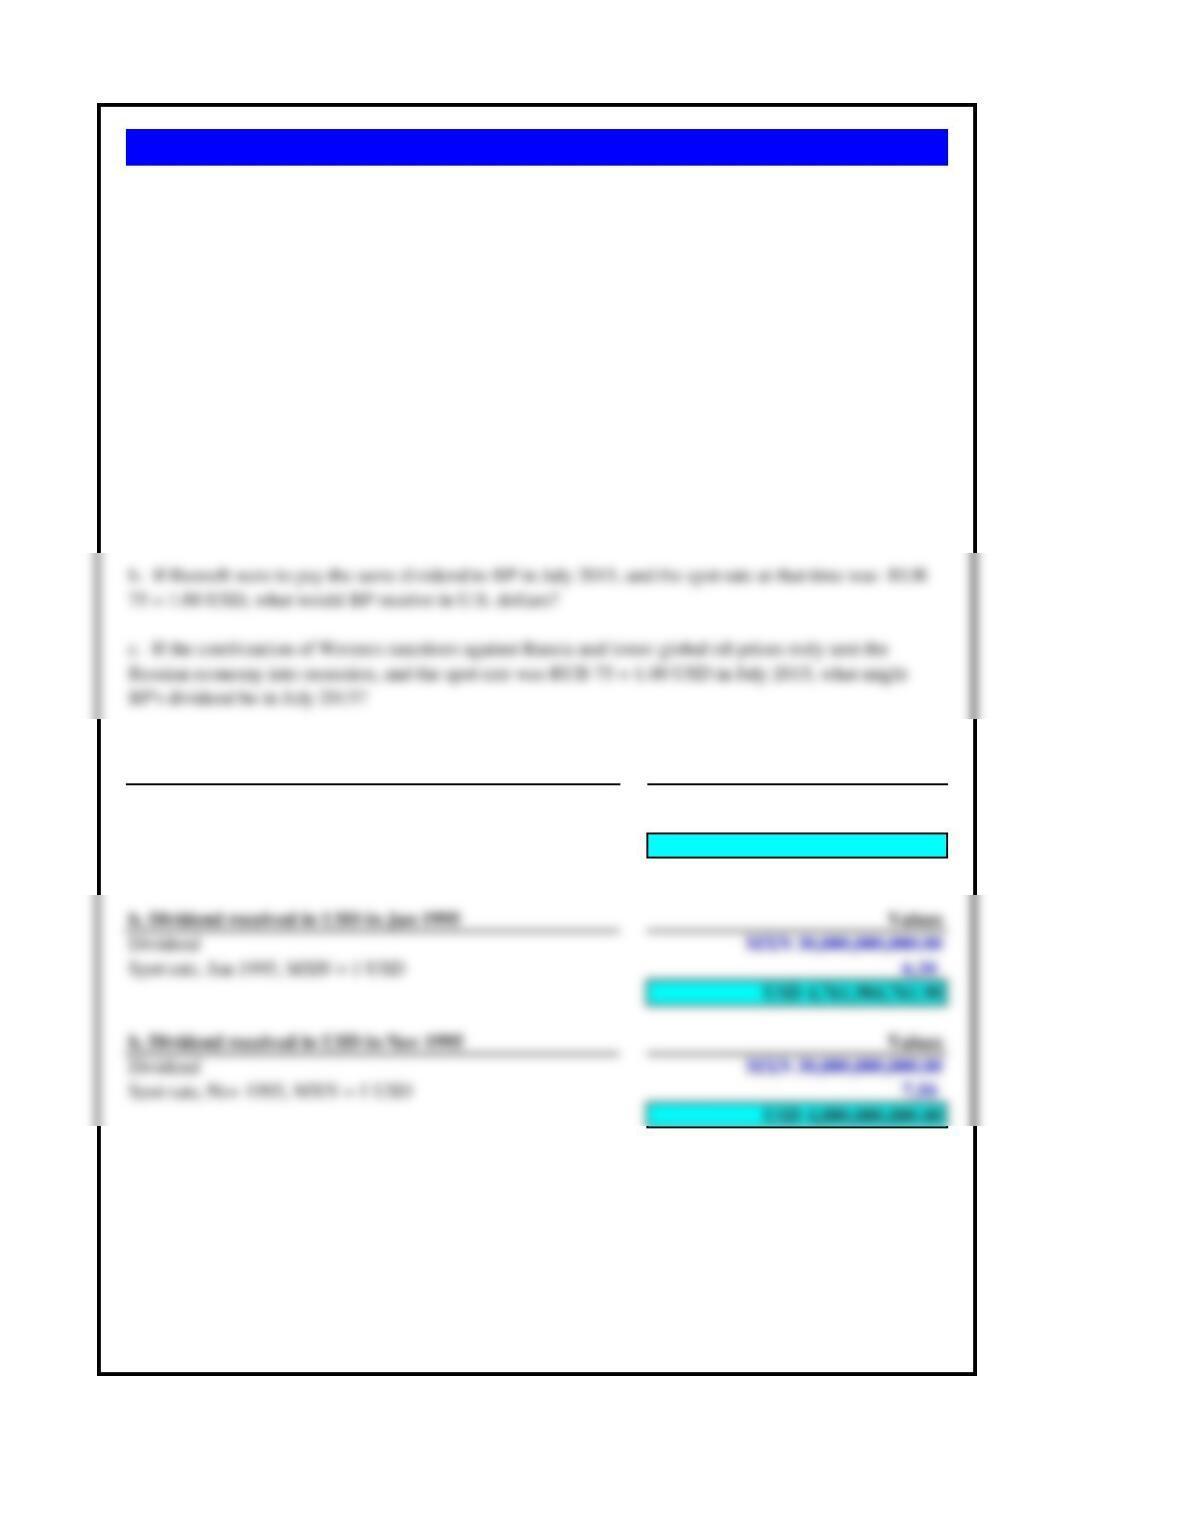
a. Dividend received in USD in Nov 1994 Values
Dividend MXN 30,000,000,000.00
Spot rate, November 1994, MXN = 1 USD 3.44
USD 8,713,331,397.04
Problem 9.10 BP and Mexicana Oil 1995
BP (UK) and Mexicana Oil (Mexico) severed a long-term joint venture in 1993, with Mexicana buying
out BP with $75 billion in cash and a 30% interest (equity interest) in Mexicana itself. Mexicana financed
a large part of the buyout by borrowing heavily. The following year, November 1994, BP received a
dividend on its ownership interest in Mexicana of MXN 30 billion.
But Mexicana’s performance had been declining, as was the Mexican peso. The winter of 1994–1995 in
Europe was a relatively mild one and Europe’s purchases of Mexicana’s oil output had fallen, as had the
price of oil. Mexicana’s total sales were down, and the peso had clearly fallen dramatically (see previous
table). And to add debt to injury, Mexicana was due to make a payment of USD 22.5 billion in 1995 on
its debt from the BP buyout.
a. Assuming a spot rate of RUB 34.78 = 1.00 USD in July 2014, how much was the dividend paid to BP
in U.S. dollars?
b. If Rosneft were to pay the same dividend to BP in July 2015, and the spot rate at that time was RUB
75 = 1.00 USD, what would BP receive in U.S. dollars?
Russian economy into recession, and the spot rate was RUB 75 = 1.00 USD in July 2015, what might
BP’s dividend be in July 2015?
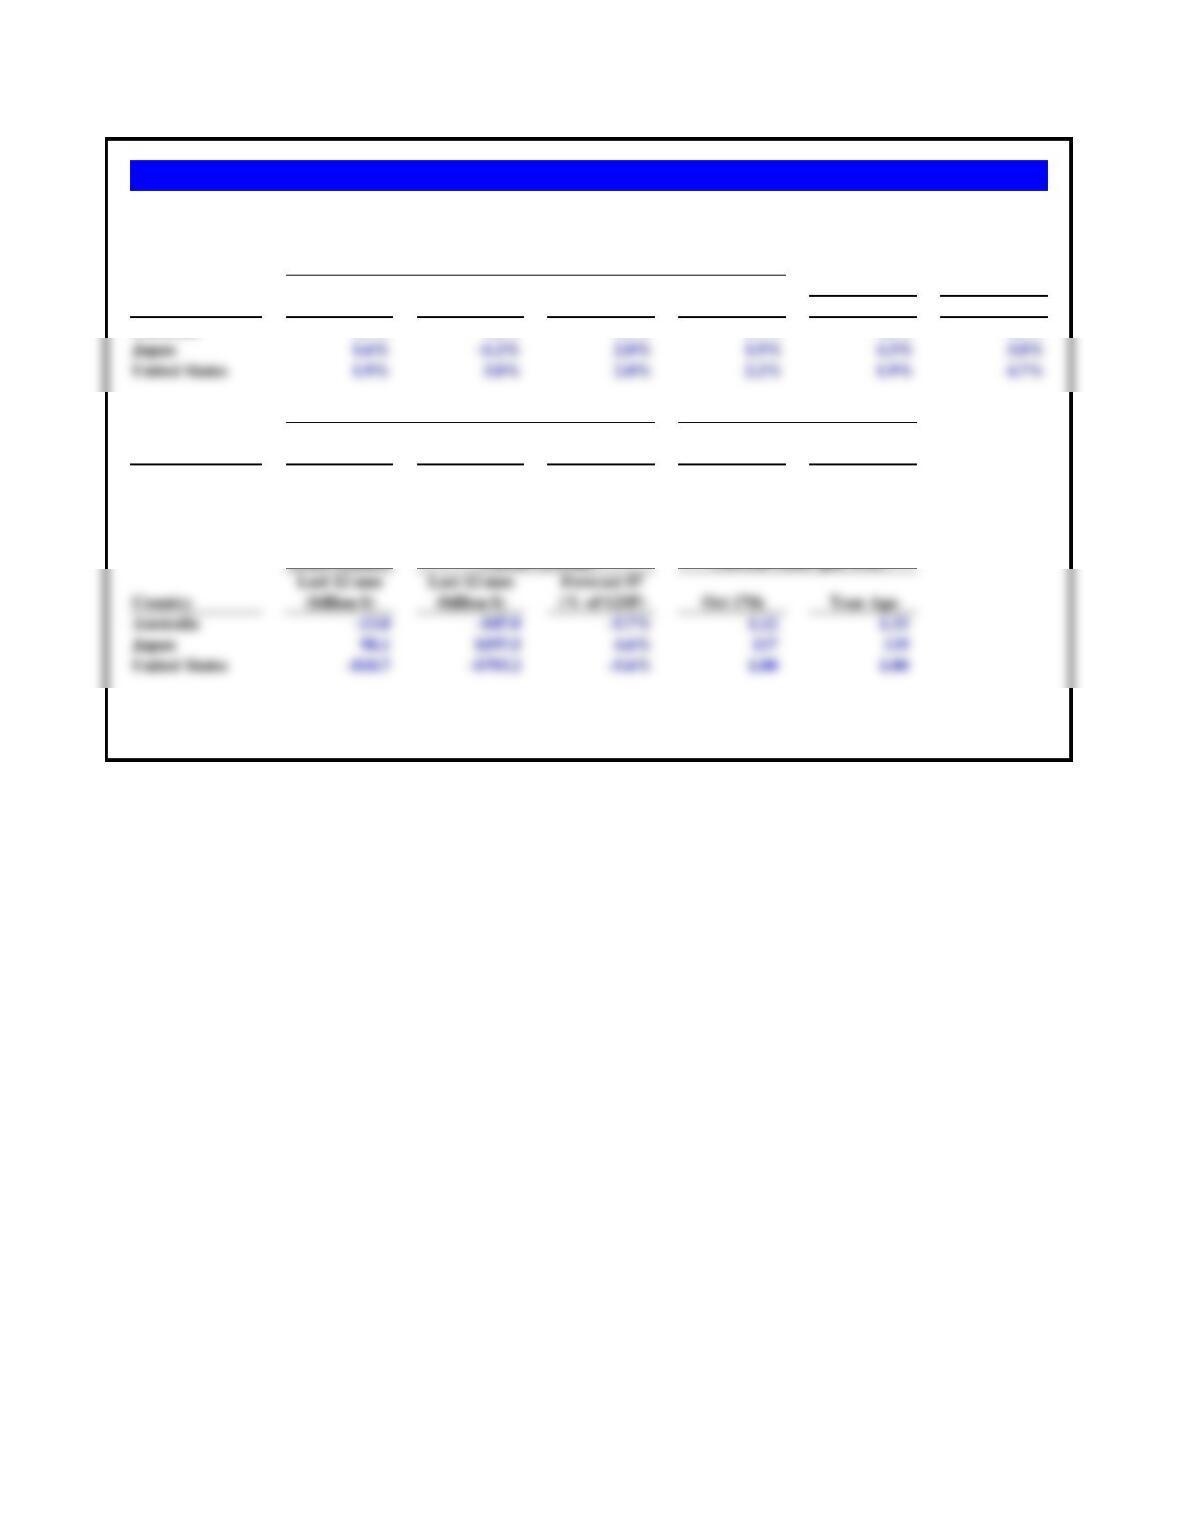
Use the following data in answering problems 9.11-9.16.
Industrial Unemployment
Forecast Forecast Production Rate
Country Latest Qtr Qtr* 2007e 2008e Recent Qtr Latest
Forecast 3-month 1-yr Govt
Country Year Ago Latest 2007e Latest Latest
Australia 4.0% 2.1% 2.4% 6.90% 6.23%
Japan 0.9% -0.2% 0.0% 0.73% 1.65%
United States 2.1% 2.8% 2.8% 4.72% 4.54%
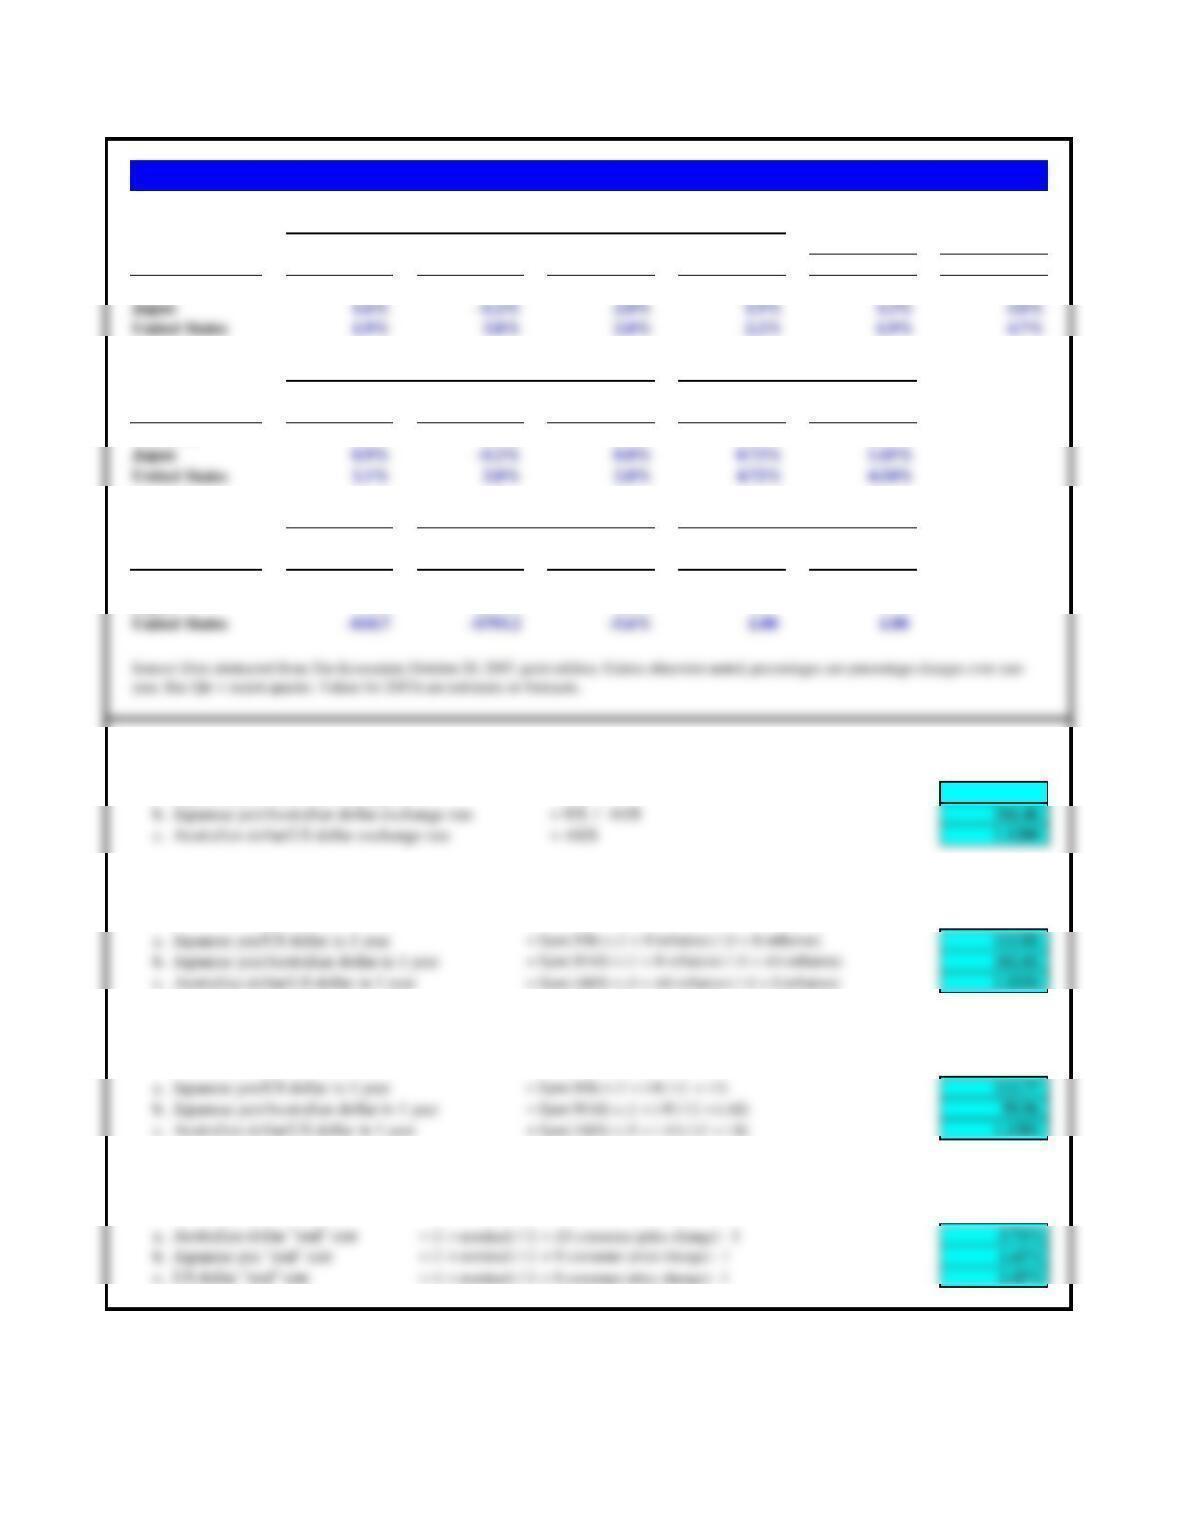
Source: Data abstracted from The Economist , October 20, 2007, print edition. Unless otherwise noted, percentages are percentage changes over one-
year. Rec Qtr = recent quarter. Values for 2007e are estimates or forecasts.
Forecasting the Pan-Pacific Pyramid:
Gross Domestic Product
Consumer Prices
Interest Rates
Industrial Unemployment
Forecast Forecast Production Rate
Country Latest Qtr Qtr* 2007e 2008e Recent Qtr Latest
Australia 4.3% 3.8% 4.1% 3.5% 4.6% 4.2%
Forecast 3-month 1-yr Govt Bond
Country Year Ago Latest 2007e Latest Latest
Australia 4.0% 2.1% 2.4% 6.90% 6.23%
Trade Balance
Last 12 mos Last 12 mos Forecast 07
Country (billion $) (billion $) (% of GDP) Oct 17th Year Ago
Australia -13.0 -$47.0 -5.7% 1.12 1.33
Japan 98.1 $197.5 4.6% 117 119
11. Current spot rates. What are the current spot exchange rates for the following cross rates?
a. Japanese yen/US dollar exchange rate
= ‘¥/$ 117.00
Problems 9.11-9.14 Forecasting the Pan-Pacific Pyramid
Gross Domestic Product
Consumer Prices
Interest Rates
13. International Fischer forecasts. Asssuming International Fisher applies to the coming year, forecast the following future spot
exchange rates using the government bond rates for the respective country currencies:
14. Implied real interest rates. If the nominal interest rate is the government bond rate, and the current change in consumer prices is
used as expected inflation, calculate the implied “real” rates of interest by currency.
Current Account
Current Units (per US$)
12. Purchasing power parity forecasts. Assuming purchasing power parity, and assuming that the forecasted change in consumer
prices is a good proxy of predicted inflation, forecast the following cross rates:
Industrial Unemployment
Forecast Forecast Production Rate
Country Latest Qtr Qtr* 2007e 2008e Recent Qtr Latest
Australia 4.3% 3.8% 4.1% 3.5% 4.6% 4.2%
Japan 1.6% -1.2% 2.0% 1.9% 4.3% 3.8%
United States 1.9% 3.8% 2.0% 2.2% 1.9% 4.7%
Forecast 3-month 1-yr Govt Bond
Country Year Ago Latest 2007e Latest Latest
Trade Balance
Last 12 mos Last 12 mos Forecast 07
Country (billion $) (billion $) (% of GDP) Oct 17th Year Ago
Australia -13.0 -$47.0 -5.7% 1.12 1.33
Japan 98.1 $197.5 4.6% 117 119
15. Forward rates. Using the spot rates and three-month interest rates above, calculate the 90-day forward rates for:
a. Japanese yen/US dollar exchange rate = Spot (¥/$) x (1 + i¥ 3 month) / (1 + i$ 3 month) 115.85
b. Japanese yen/Australian dollar exchange rate = Spot (¥/A$) x (1 + i¥ 3 month) / (1 + iA$ 3 month) 102.88
c. Australian dollar/US dollar exchange rate = Spot (A$/$) x (1 + A$ 3 month) / (1 + i$ 3 month) 1.1260
Note: All interest rates need to be adjusted for a 90 day period of a 360 day year for the calculation.
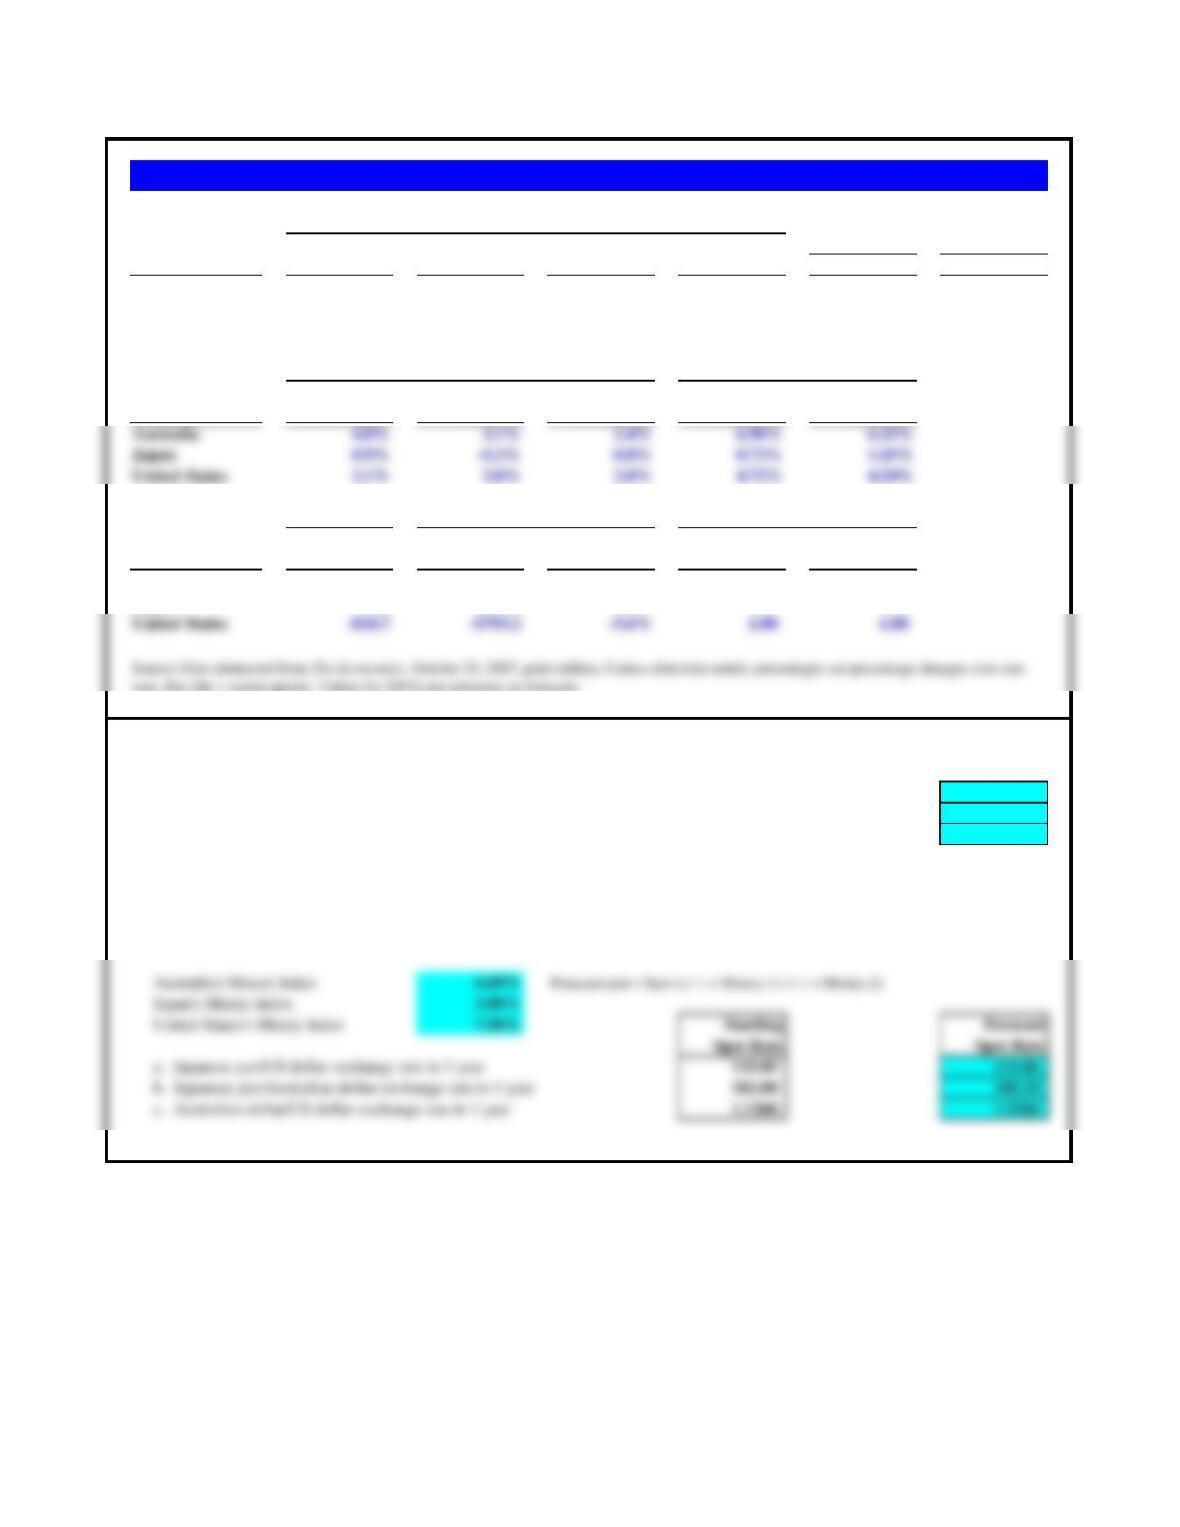
16. Real economic activity and misery. Calculate the country’s Misery Index (unemployment + inflation) and then use it like interest
differentials to forecast the future spot exchange rate, one year into the future.
Current Account
Current Units (per US$)
year. Rec Qtr = recent quarter. Values for 2007e are estimates or forecasts.
Problems 9.15-9.16 Forecasting the Pan-Pacific Pyramid
Gross Domestic Product
Consumer Prices
Interest Rates
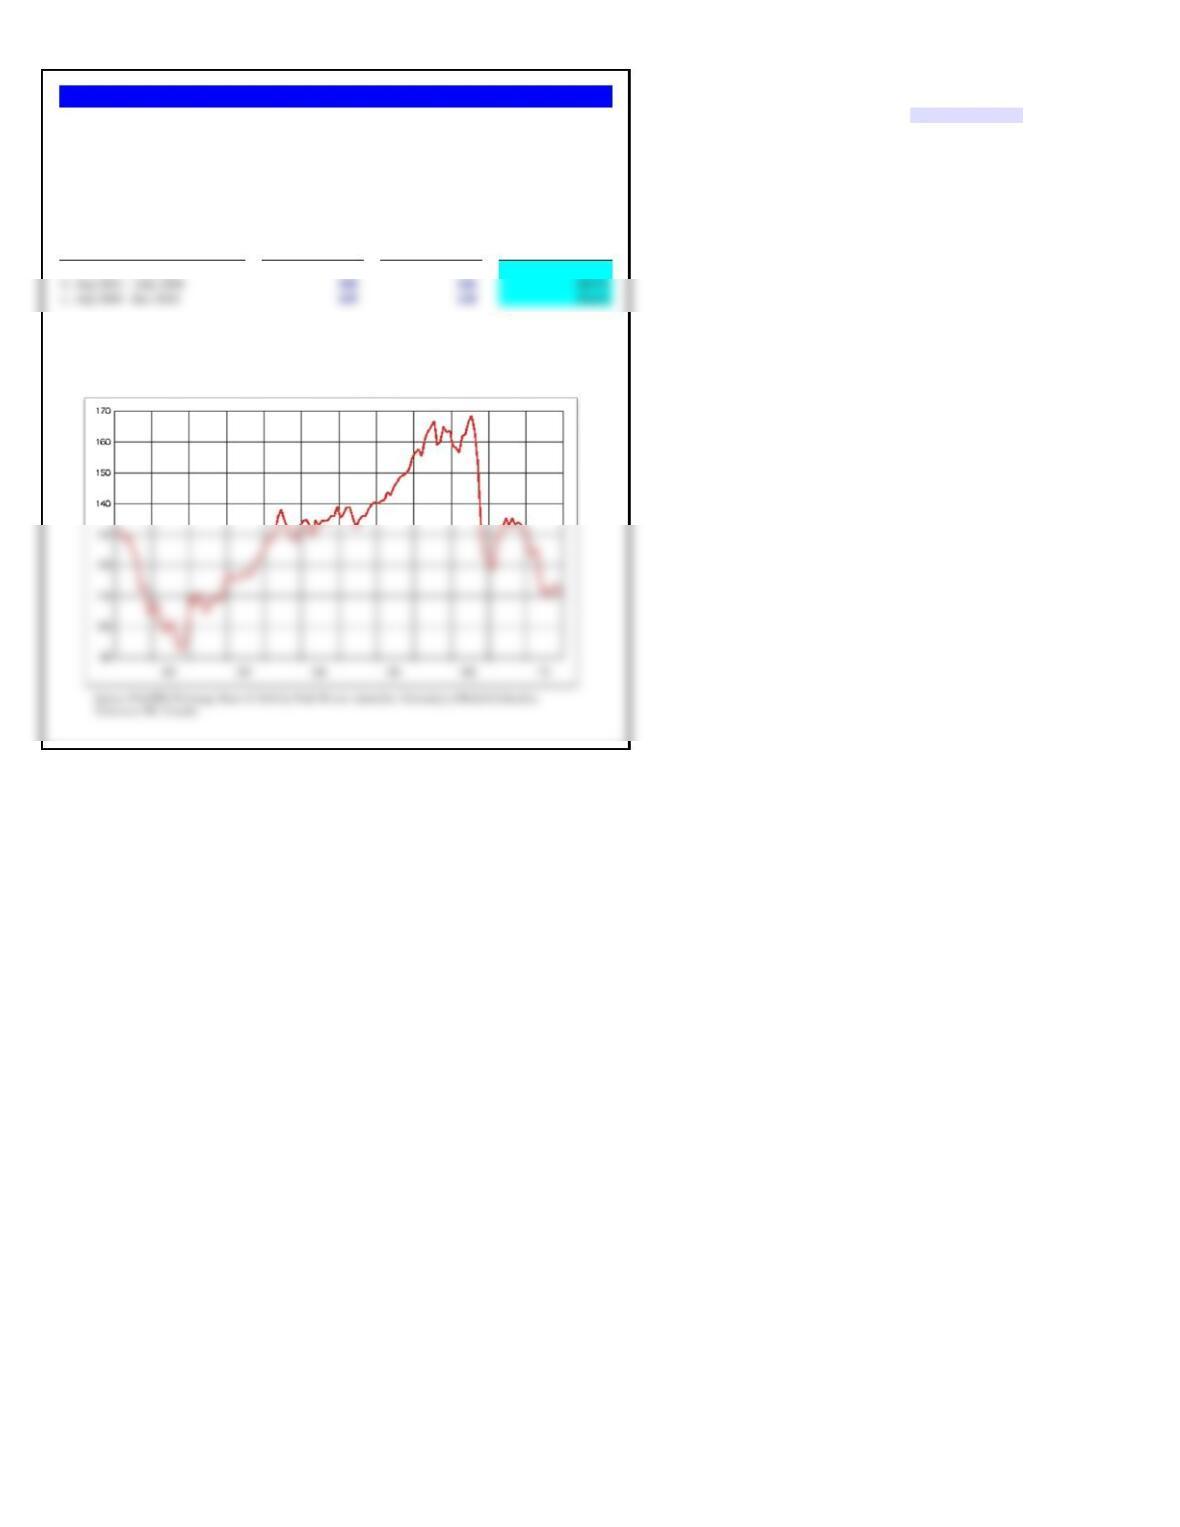
Change in the
Starting Value Ending Value value of the yen
Time Period
(¥/€) (¥/€)(percent)
a. Jan 1999 – Aug 2001 131 109 20.2%
Problem 9.17 The Rising Sun and Europe
Percent change = ( S1 – S2 ) ÷ ( S2 )
The Japanese yen-euro cross rate is one of the more significant currency values for global trade and commerce.
The graphic at right shows this cross-rate from when the euro was launched in January 1999 through the end-of-
year 2010. Estimate the change in the value of the yen over the following three periods of change.
Monthly Average Exchange Rates:
Japanese Yen per European Euro