Assumptions Rate Values
Initial spot rate, 1999 (Sucre/$) S1 5,000
Problem 9.1 Ecuadorian Hyper-Inflation
The Ecuadorian sucre (S) suffered from hyper-inflationary forces throughout 1999. Its value
moved from S5,000/$ to S25,000/$. What was the percentage change in its value?
Change in the value
Starting Value Ending Value of the loonie
Time Period (C$/US$) (C$/US$) (percent)
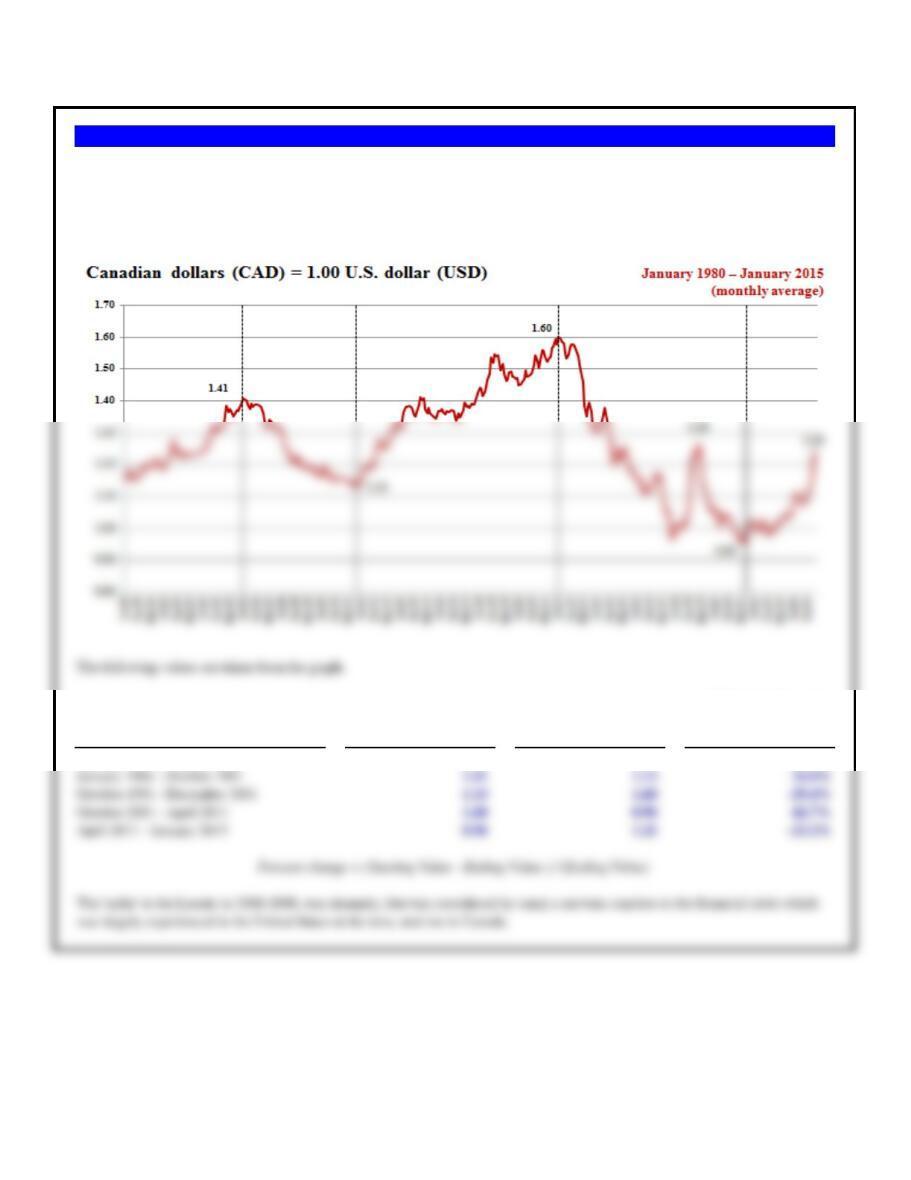
January 1980 – January 1986 1.16 1.41 -17.7%
The Canadian dollar’s value against the U.S. dollar has seen some significant changes over recent history. Using the following
graph of the C$/US$ exchange rate for the 30 year period between 1980 and end-of-year 2010 to estimate the percentage change in
the Canadian dollar’s value (its affectionately known as the “loonie”) versus the dollar for the following periods.
Problem 9.2 Canadian Loonie
Assumptions Rate Values
Problem 9.3 Mexico’s Cada Seis Años
Mexico was famous – or infamous – for many years in having two things every six years (cada
seis años in Spanish): a presidential election and a currency devaluation. This was the case in
1976, 1982, 1988, and in 1994. In its last devaluation on December 20, 1994, the value of the
Mexican peso (Ps) was officially changed from Ps3.30/$ to Ps5.50/$. What was the percentage
devaluation?
Assumptions Values
Spot rate, February 20, 2001 (TL/$) 68,000
a. What was the exchange rate after devaluation?
b. What was percentage change after falling to TL100,000/$?
Problem 9.4 Turkish Lira Devaluation
The Turkish lira (TL) was officially devalued by the Turkish government in February 2001
during a severe political and economic crisis. The Turkish government announced on February
21st that the lira would be devalued by 20%. The spot exchange rate on February 20th was
TL68,000/$.
“Eye-balled”
Date Values
February 1st (Ps/$) 2.00
February 28th (Ps/$) 2.20
Percent change -9.09%
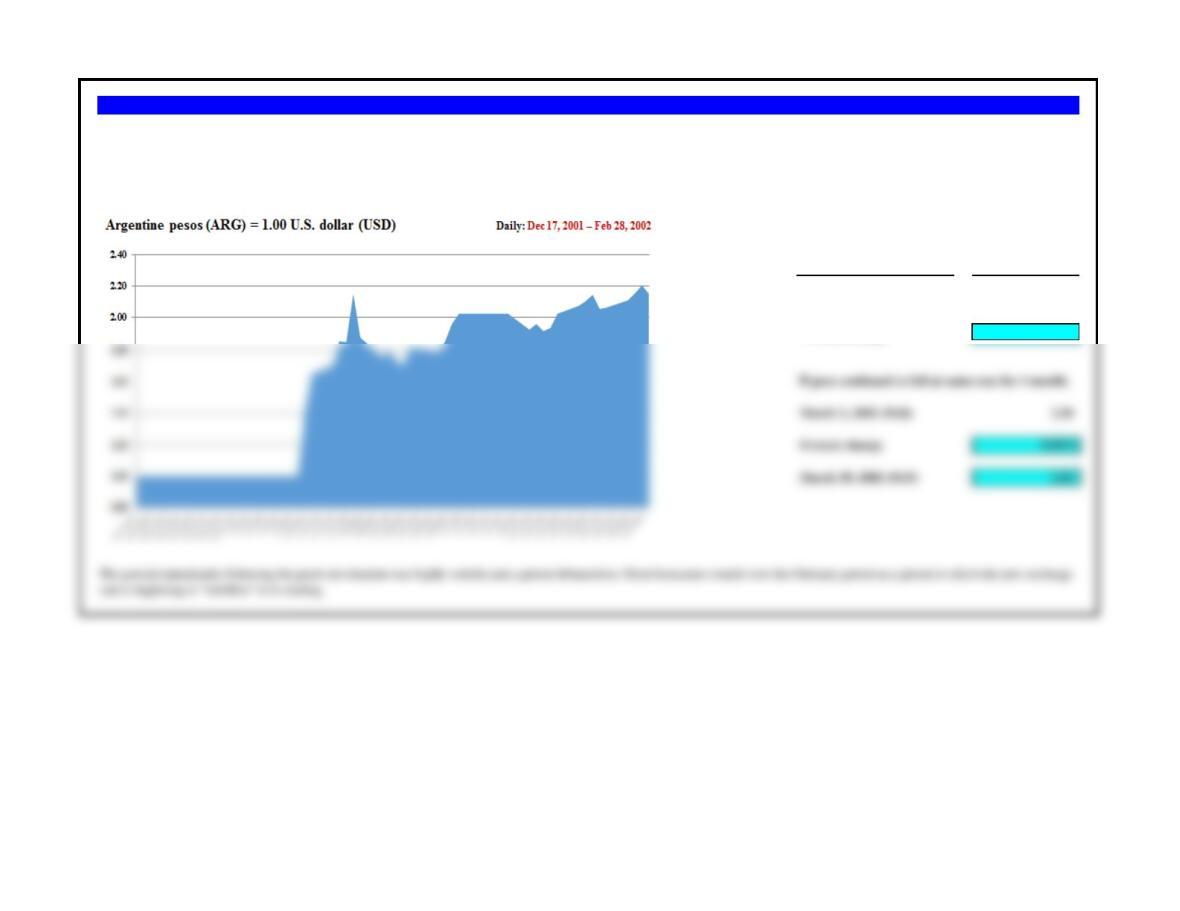
Problem 9.5 Argentine Peso’s Anguish
As illustrated in the graph, the Argentine peso moved from its fixed exchange rate of Ps1.00/$ to over Ps2.00/$ in a matter of days in early January 2002. After a brief period of high volatility,
the peso’s value appeared to settle down into a range varying between 2.0 and 2.5 pesos per dollar. If you were forecasting the Argentine peso further into the future, to March 30, 2002, how
would you use the information in the graphic — the value of the peso freely-floating in the weeks following devaluation — to forecast its future value?
Assumptions Rate Values
Opening spot rate, July 2, 1997 (Bt/$) S1 25.00
Problem 9.6 Brokedown Palace
The Thai baht (Bt) was devalued by the Thai government from BT25/$ to BT29/$ on July 2,
1997. What was the percentage devaluation of the baht?

Assumptions Values
Spot rate, Thursday, January 24, 2008, R$/$ 1.80
Problem 9.7 Brazilian Reais Carnival
The Brazilian reais’ (BRL or R$) value was BRL 1.80 to 1.00 USD on Thursday
January 24, 2008, then plunged in value to BRL 2.39 to 1.00 USd on January 26, 2009.
What was the percentage change in its value?
a. What is the value of Mikhail’s portfolio as measured in Russian rubles?
b. What is the value of Mikhail’s portfolio as measured in Swiss francs?
c. What is the value of Mikhail’s portfolio as measured in U.S. dollars?
d. Which currency demonstrated the greatest fluctuations in total value over the six dates?
Mikhail’s balances by currency: (in millions)
US dollars USD 200
US dollars per Swiss franc 1.0888 1.0326 1.0337 1.0411 1.0136 1.1778
a. What is the value of Mikhail’s portfolio as measured in Russian rubles?
Portfolio Value as Measured in Rubles Nov 7, 2013 Nov 7, 2014 Dec 4, 2014 Dec 16, 2014 Dec 24, 2014 Jan 16, 2014
Russian ruble account balance 1,200 1,200 1,200 1,200 1,200 1,200
b. What is the value of Mikhail’s portfolio as measured in Swiss francs?
Portfolio Value as Measured in francs Nov 7, 2013 Nov 7, 2014 Dec 4, 2014 Dec 16, 2014 Dec 24, 2014 Jan 16, 2014
c. What is the value of Mikhail’s portfolio as measured in U.S. dollars?
Portfolio Value as Measured in dollars Nov 7, 2013 Nov 7, 2014 Dec 4, 2014 Dec 16, 2014 Dec 24, 2014 Jan 16, 2014
Russian ruble account balance 37 26 22 18 22 18
d. Which currency demonstrated the greatest fluctuations in total value over the six dates?
Problem 9.8 Mikhail Khorodovsky’s Dilemma
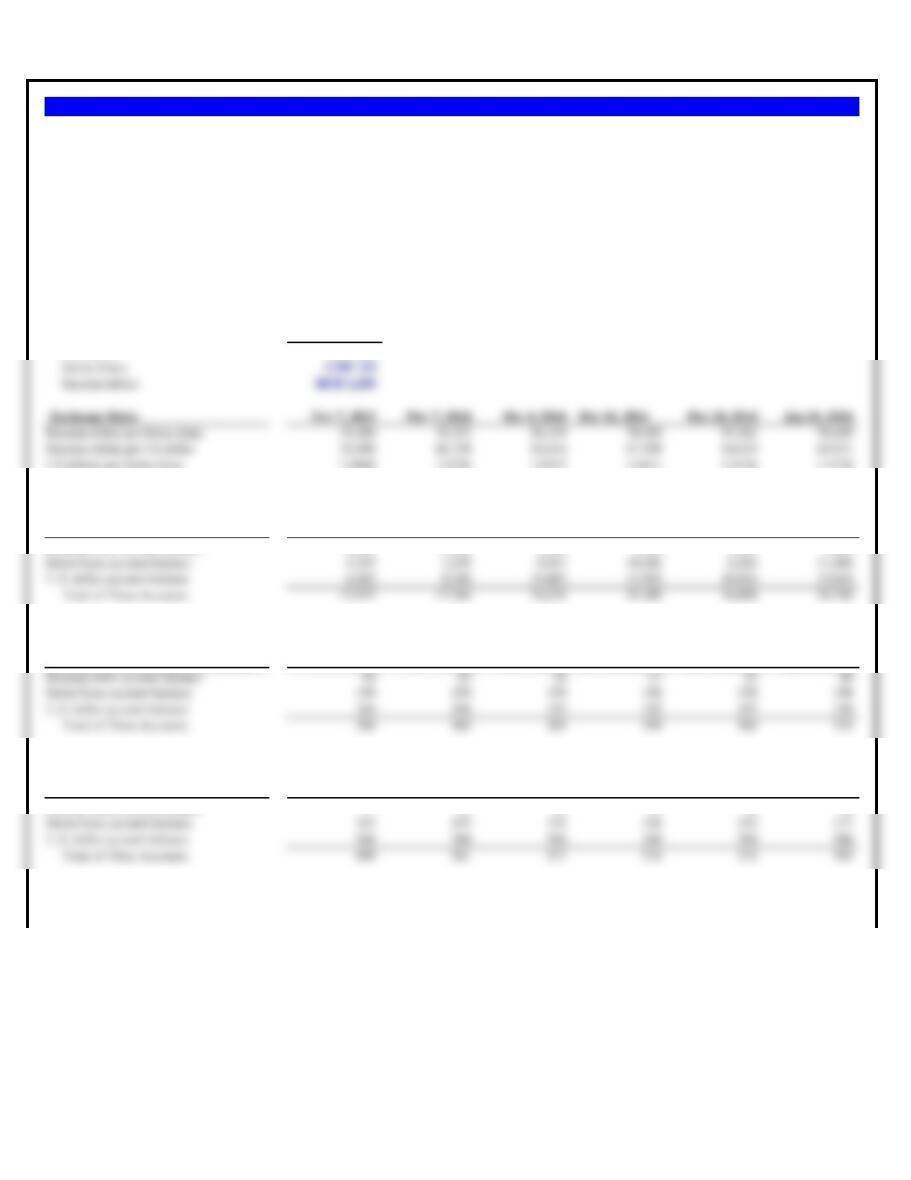
Mikhail Khodorkovsky was one of the infamous Russian oligarchs, accumulating billions of dollars in wealth in the mid-1990s with the fall of the Soviet
Union. But in 2003 he had been imprisoned by the Russian state for a decade for tax evasion. Upon his release from prison in 2013 he had taken up residence
in Switzerland – with most of his money.
In November 2014 Mikhail held a portfolio of USD 200 million and CHF 150 million in Swiss banks, in addition to accounts in Russia still holding RUB
1.2 billion. Using the exchange rate table, answer the following:
Exchange Rates Nov 7, 2013 Nov 7, 2014 Dec 4, 2014 Dec 16, 2014 Dec 24, 2014 Jan 16, 2015
Problem 9.9 Trepak — The Russian Dance
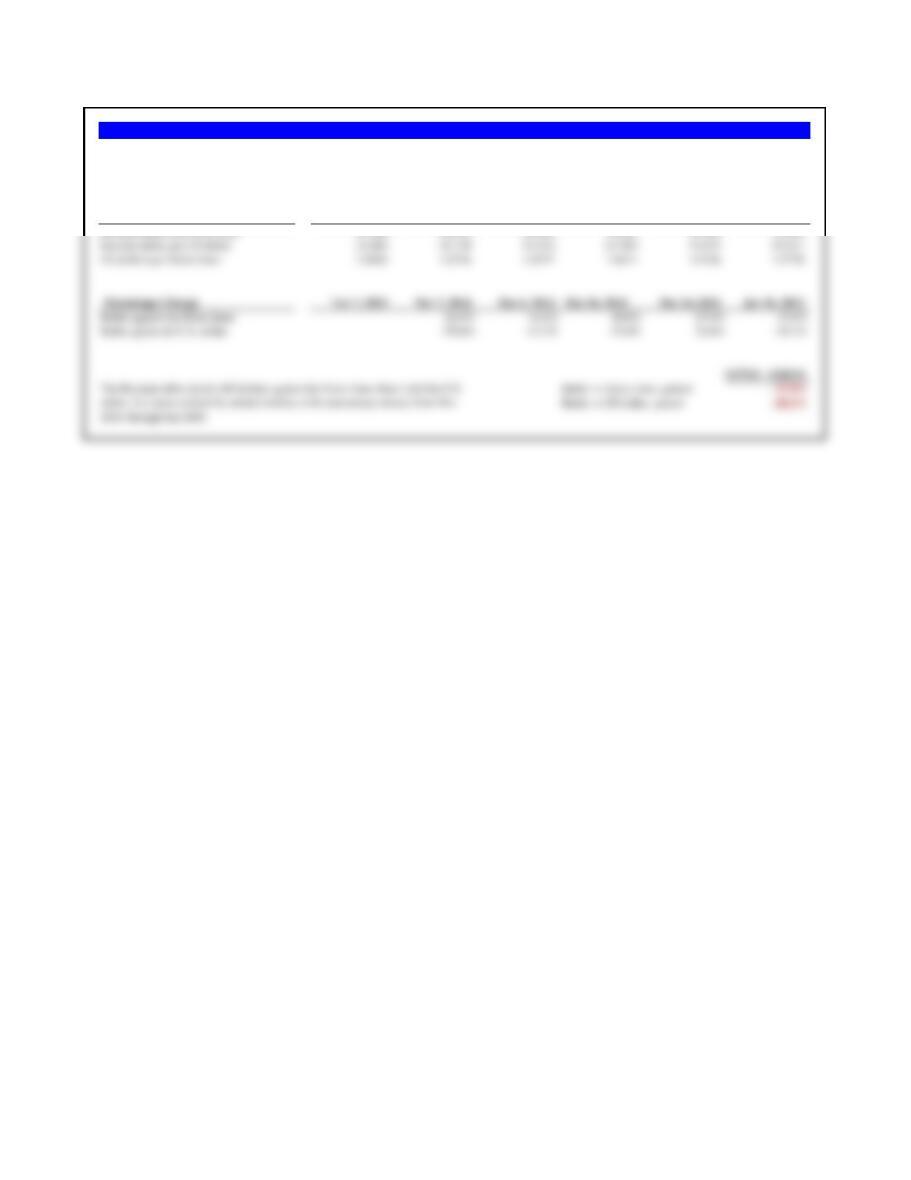
Calculate the percentage change in the value of the Ruble for the three different crossrates shown above for the six dates. Did it fall further against the U.S.
dollar or the Swiss franc?
Percentage Change Nov 7, 2013 Nov 7, 2014 Dec 4, 2014 Dec 16, 2014 Dec 24, 2014 Jan 16, 2015

b. BP’s dividend received in USD in July 2015? Values
USD 320,000,000.00
c. If Rosneft suffers from Russian recession?
c. If the combination of Western sanctions against Russia and lower global oil prices truly sent the
Russian economy into recession, and the spot rate was RUB 75 = 1.00 USD in July 2015, what might
BP’s dividend be in July 2015?
year, and Rosneft’s profitability was destroyed from economic conditions, sanctions, and the fall of the
ruble.
BP’s dividend could very well be zero in 2015 if the Russian economy worsened in the first half of the
Problem 9.10 BP and Rosneft 2015
BP (UK) and Rosneft (Russia) had severed a long-term joint venture in 2013, with Rosneft buying BP’s
out with $55 billion in cash and a 20% interest (equity interest) in Rosneft itself. Rosneft financed a large
part of the buyout by borrowing heavily. The following year, in July 2014, BP received a dividend on its
ownership interest in Rosneft of RUB 24 billion.
But Rosneft’s performance had been declining, as was the Russian ruble. The winter of 2014-2015 in
Europe was a relatively mild one, and Europe’s purchases of Rosneft’s natural gas had fallen as had the
price of natural gas. Rosneft’s total sales were down, and the ruble had clearly fallen dramatically (table
above). And to add debt to injury, Rosneft was due to make a payment of USD 19.5 billion in 2015 on its
debt from the BP buyout.
a. Assuming a spot rate of RUB 34.78 = 1.00 USD in July 2014, how much was the dividend paid to BP
in U.S. dollars?
b. If Rosneft were to pay the same dividend to BP in July 2015, and the spot rate at that time was RUB
75 = 1.00 USD, what would BP receive in U.S. dollars?
Industrial Unemployment
Forecast Forecast Production Rate
Country Latest Qtr Qtr* 2007e 2008e Recent Qtr Latest
Australia 4.3% 3.8% 4.1% 3.5% 4.6% 4.2%
Forecast 3-month 1-yr Govt
Country Year Ago Latest 2007e Latest Latest
Australia 4.0% 2.1% 2.4% 6.90% 6.23%
Japan 0.9% -0.2% 0.0% 0.73% 1.65%
United States 2.1% 2.8% 2.8% 4.72% 4.54%
Forecasting the Pan-Pacific Pyramid: Australia, Japan & The United States
Gross Domestic Product
Consumer Prices
Interest Rates

Industrial Unemployment
Forecast Forecast Production Rate
Country Latest Qtr Qtr* 2007e 2008e Recent Qtr Latest
Australia 4.3% 3.8% 4.1% 3.5% 4.6% 4.2%
Forecast 3-month 1-yr Govt Bond
Country Year Ago Latest 2007e Latest Latest
Australia 4.0% 2.1% 2.4% 6.90% 6.23%
United States 2.1% 2.8% 2.8% 4.72% 4.54%
Trade Balance
Last 12 mos Last 12 mos Forecast 07
Country (billion $) (billion $) (% of GDP) Oct 17th Year Ago
11. Current spot rates. What are the current spot exchange rates for the following cross rates?
a. Japanese yen/US dollar in 1 year
= Spot (¥/$) x (1 + ¥–inflation) / (1 + $-inflation) 113.81
= Spot (¥/A$) x (1 + ¥-inflation) / (1 + A$-inflation) 102.02
a. Japanese yen/US dollar in 1 year
= Spot (¥/$) x (1 + i-¥) / (1 + i-$) 113.77
= Spot (¥/A$) x (1 + i-¥) / (1 + i-A$) 99.96
14. Implied real interest rates. If the nominal interest rate is the government bond rate, and the current change in consumer prices is
used as expected inflation, calculate the implied “real” rates of interest by currency.
Current Account
Current Units (per US$)
12. Purchasing power parity forecasts. Assuming purchasing power parity, and assuming that the forecasted change in consumer
prices is a good proxy of predicted inflation, forecast the following cross rates:
Problems 9.11-9.14 Forecasting the Pan-Pacific Pyramid: Australia, Japan & The United States
Gross Domestic Product
Consumer Prices
Interest Rates
13. International Fischer forecasts. Asssuming International Fisher applies to the coming year, forecast the following future spot
exchange rates using the government bond rates for the respective country currencies:
Industrial Unemployment
Forecast Forecast Production Rate
Country Latest Qtr Qtr* 2007e 2008e Recent Qtr Latest
Australia 4.3% 3.8% 4.1% 3.5% 4.6% 4.2%
Forecast 3-month 1-yr Govt Bond
Country Year Ago Latest 2007e Latest Latest
Australia 4.0% 2.1% 2.4% 6.90% 6.23%
Trade Balance
Last 12 mos Last 12 mos Forecast 07
Country (billion $) (billion $) (% of GDP) Oct 17th Year Ago
Australia -13.0 -$47.0 -5.7% 1.12 1.33
15. Forward rates. Using the spot rates and three-month interest rates above, calculate the 90-day forward rates for:
a. Japanese yen/US dollar exchange rate = Spot (¥/$) x (1 + i¥ 3 month) / (1 + i$ 3 month) 115.85
Note: All interest rates need to be adjusted for a 90 day period of a 360 day year for the calculation.
16. Real economic activity and misery. Calculate the country’s Misery Index (unemployment + inflation) and then use it like interest
differentials to forecast the future spot exchange rate, one year into the future.
Current Account
Current Units (per US$)
Problems 9.15-9.16 Forecasting the Pan-Pacific Pyramid: Australia, Japan & The United States
Gross Domestic Product
Consumer Prices
Interest Rates
Change in the
Starting Value Ending Value value of the yen
Time Period
(¥/€) (¥/€)(percent)
a. Jan 1999 – Aug 2001 131 109 20.2%
Problem 9.17 Yen-Euro Cross
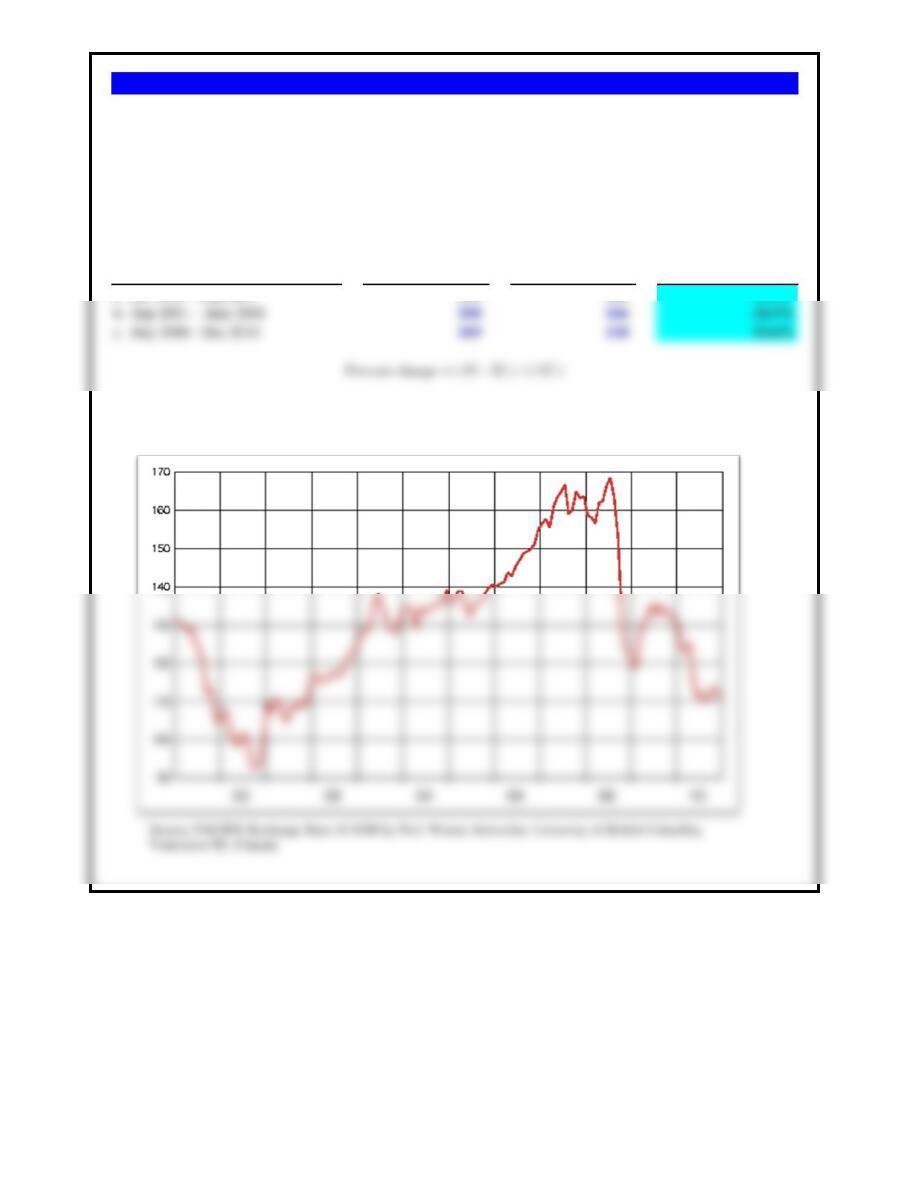
The Japanese yen-euro cross rate is one of the more significant currency values for global trade and commerce.
The graphic at right shows this cross-rate from when the euro was launched in January 1999 through the end-of-
year 2010. Estimate the change in the value of the yen over the following three periods of change.
Monthly Average Exchange Rates:
Japanese Yen per European Euro