States and occurs in addition to the deadweight loss of area +.
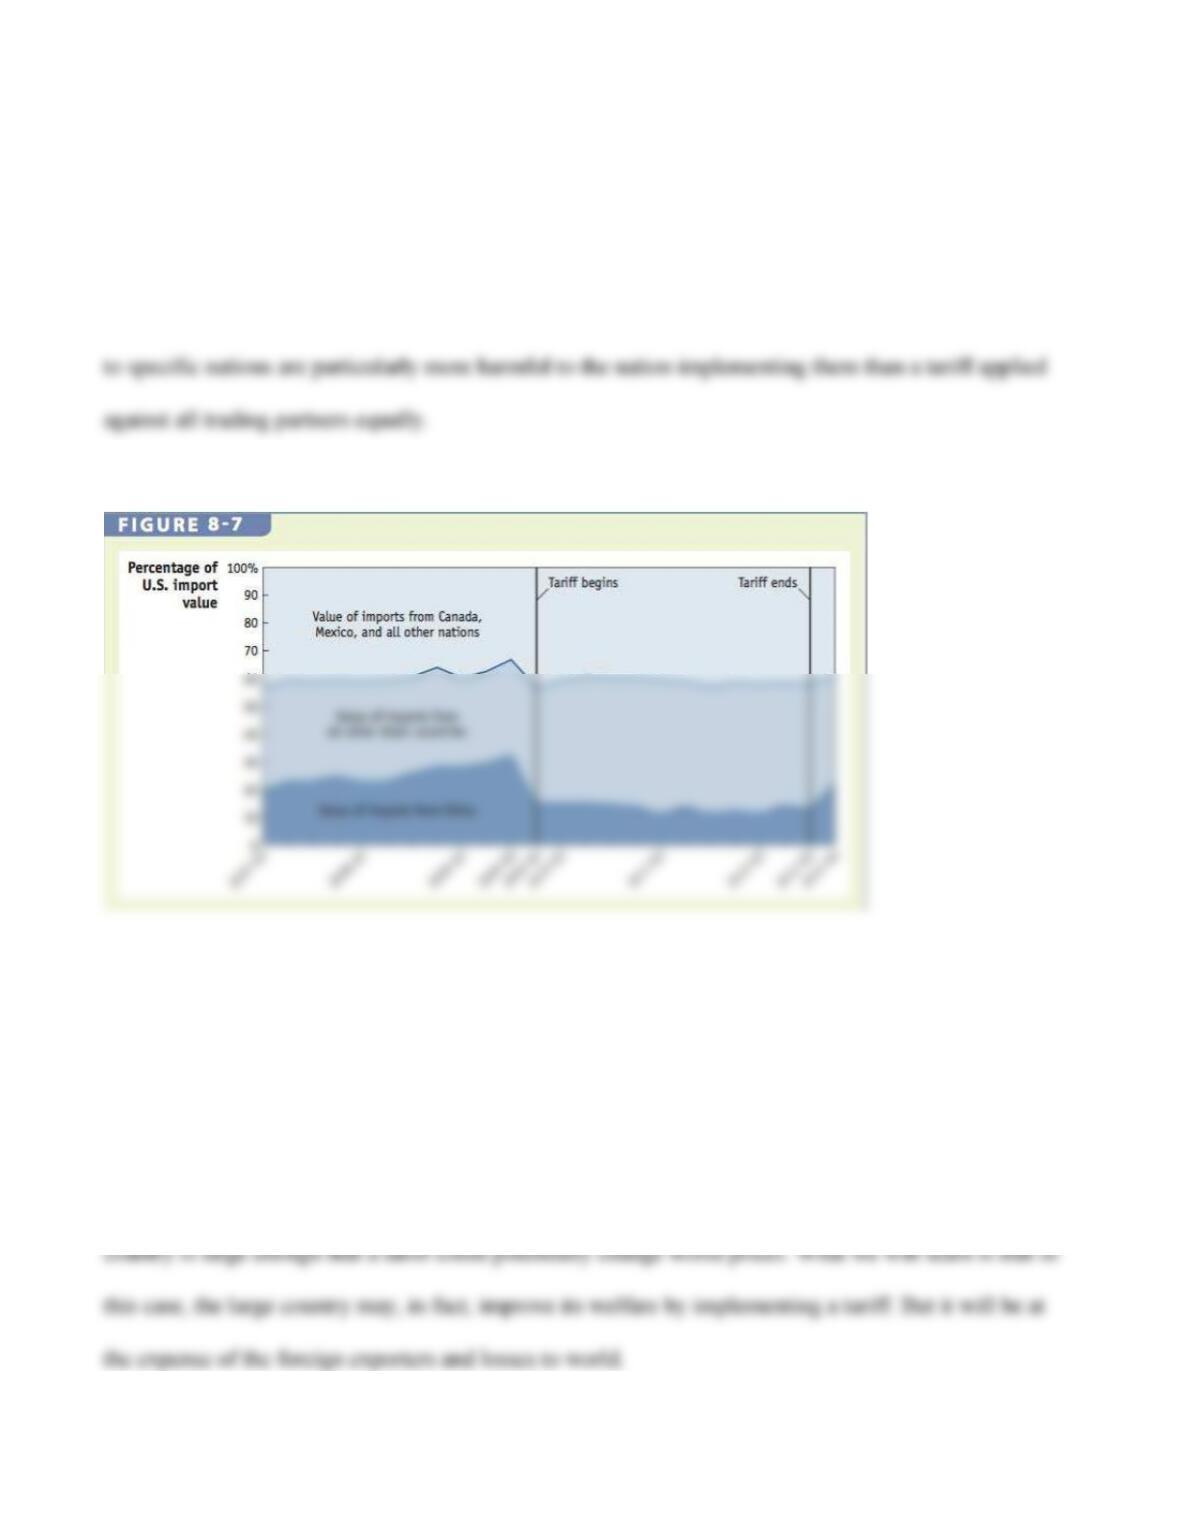
Note that the deadweight loss for the steel tariff was $186 million per year, substantially less than the
loss from the discriminatory tariff. This informs us that discriminatory tariffs that are applied unequally
4 Import Tariffs for a Large Country
We now understand that for small countries, which take world prices as given, tariffs create deadweight
losses for them and these countries are always harmed by tariffs. Is this also true for a large country
whose actions may influence world prices? We turn to this large country case now and assume the
Foreign Export Supply
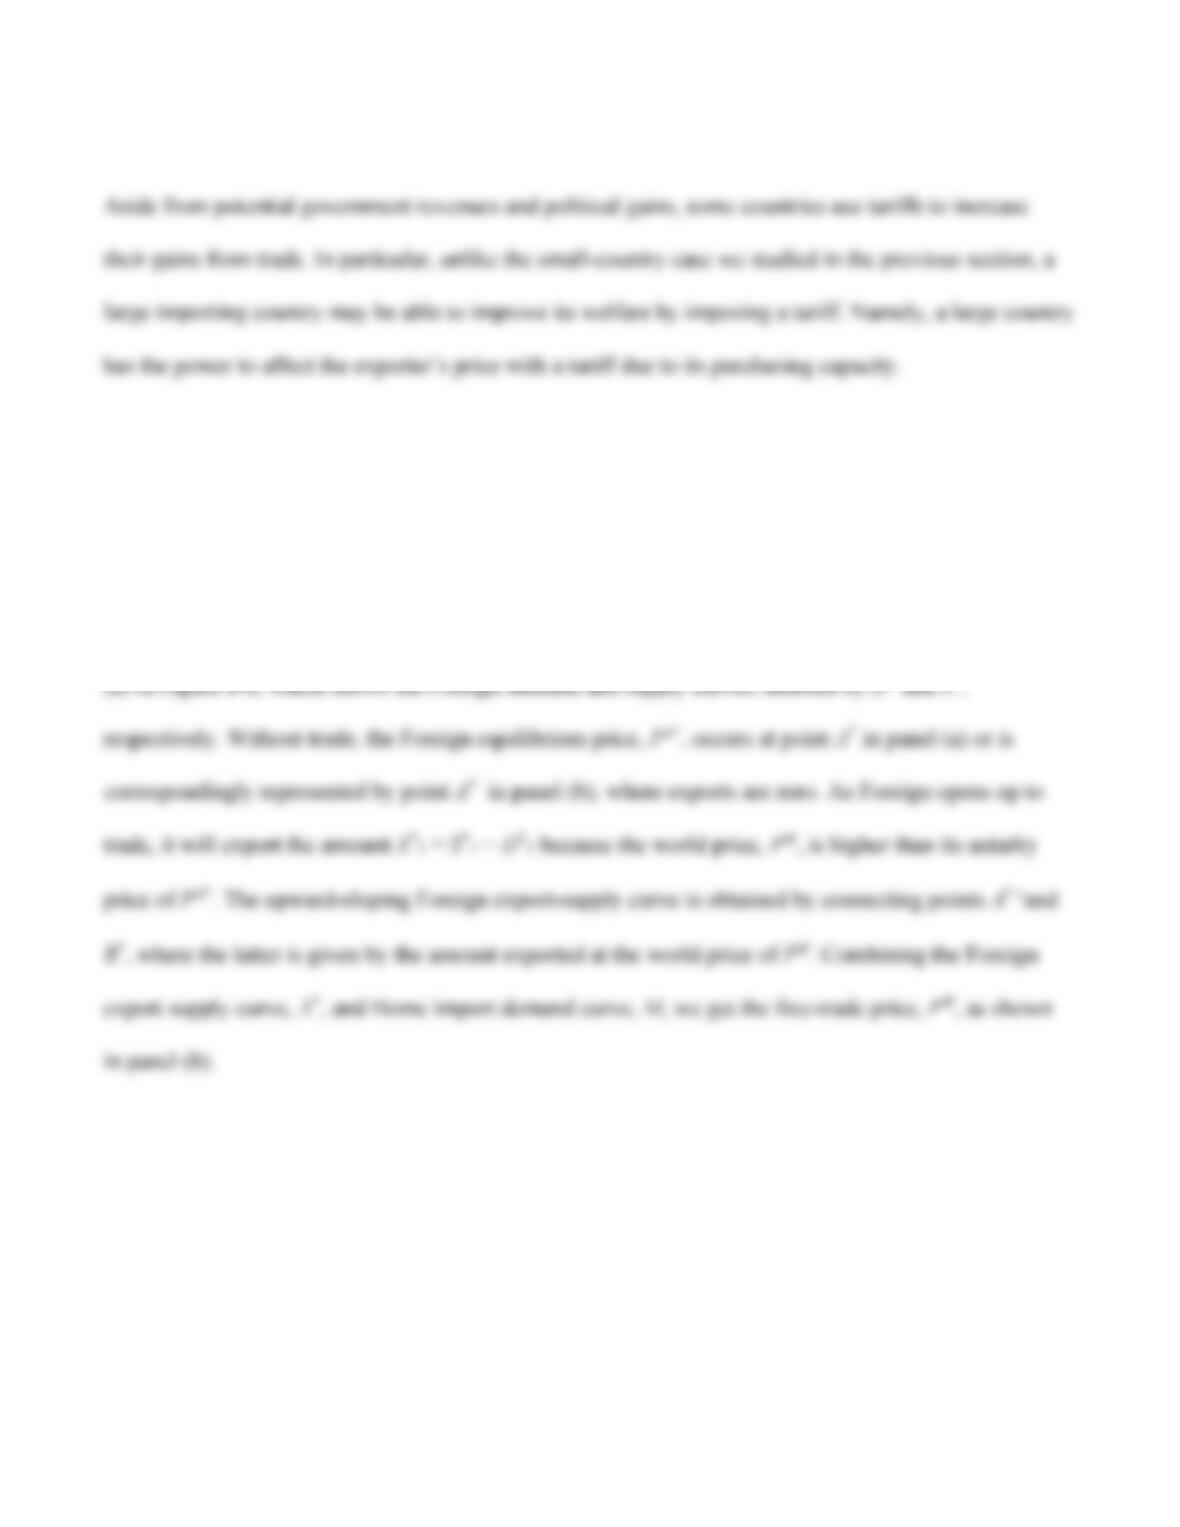
Contrary to the situation for the small country, the Foreign export supply will no longer be horizontal
when we examine a large Home country, because the importer can influence the free–trade price by the
amount it imports in the world market. To derive the Foreign export supply curve, we will refer to panel
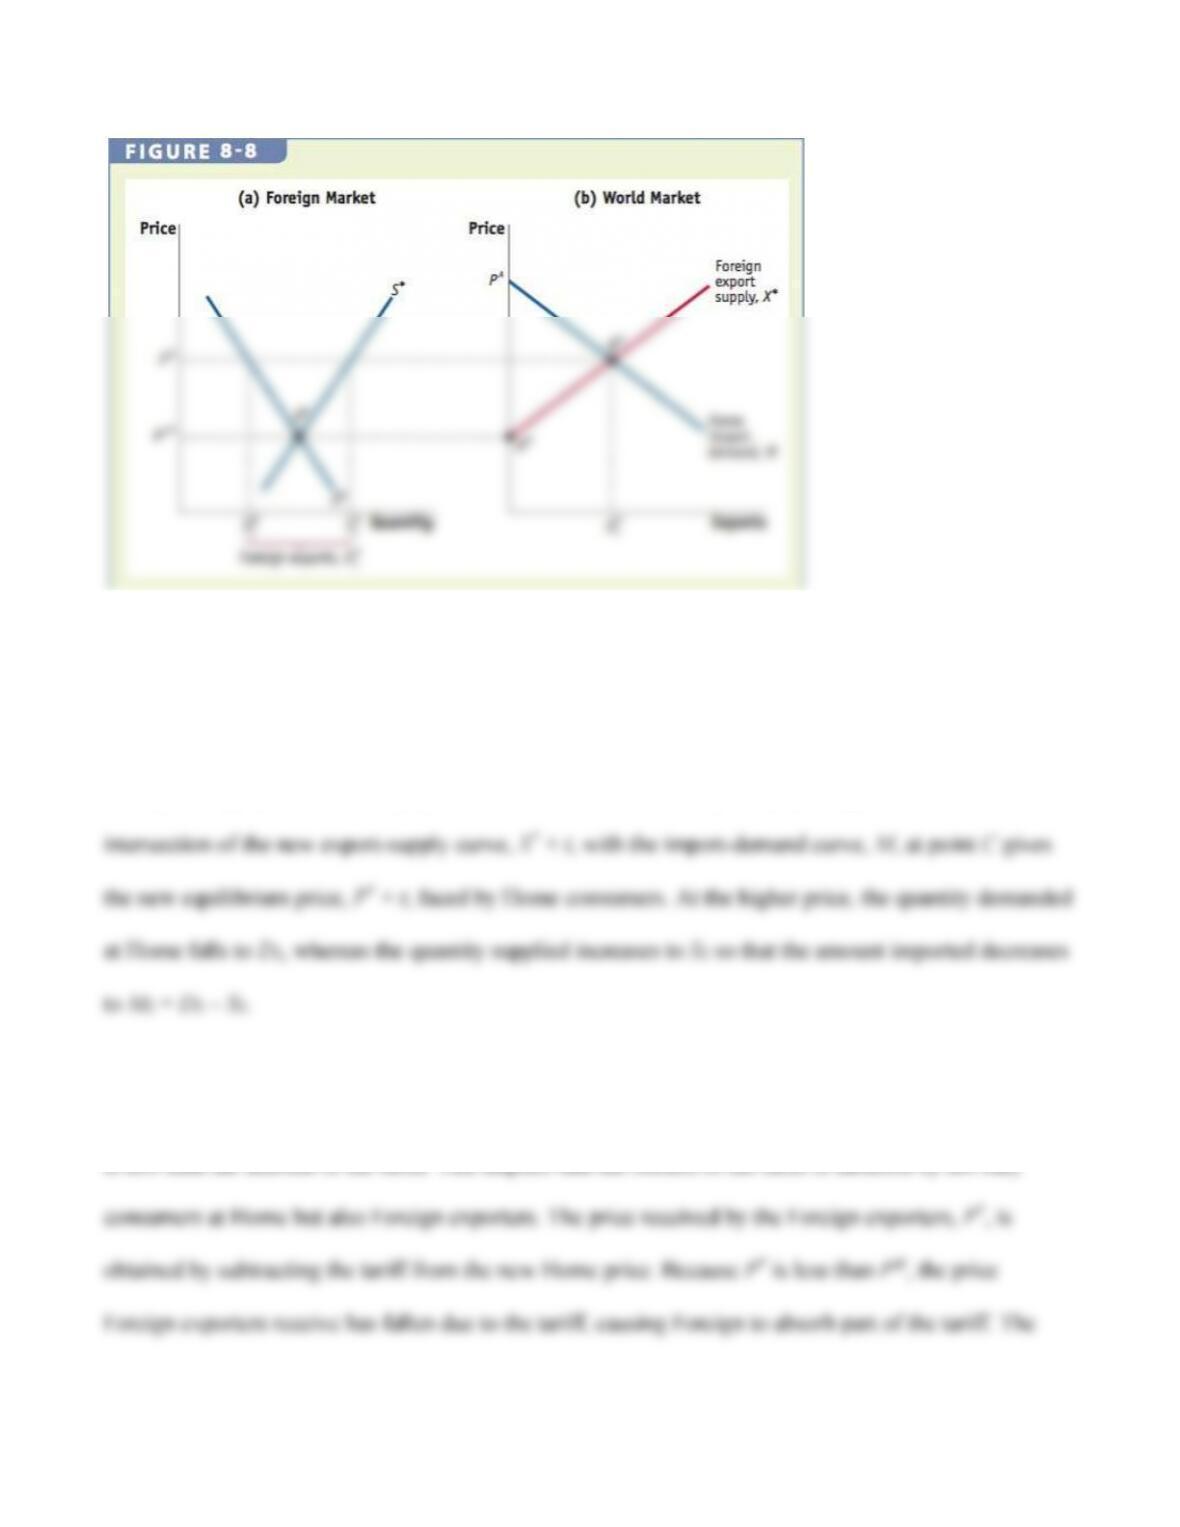
Effect of the Tariff
We assume that Home imposes a tariff in the amount of t dollars on Foreign imports. Due to the tariff,
the export supply curve shifts up by the amount t, as illustrated in panel (b) of Figure 8-9. The
Note that in panel (a) the increase in the price due to the tariff (vertical distance between P* + t and PW)
is less than the amount of the tariff. This implies that the burden of the tariff is incurred by not only
tariff has driven a wedge between consumer’s price in Home and Foreign exporter’s receipts, so the
amount of the tariff is now shared and paid for by both Home consumers and Foreign exporters.
Let’s take a closer look.
Terms of Trade Recall that a country’s terms of trade is defined as the ratio of its export price to its
import price. With the fall in the import price relative to the initial world price, PW, Home experiences a
gain in its terms of trade.
Home Welfare To examine whether the gain in the terms of trade leads to an increase in welfare at
Home, we will analyze the impact of the tariff on consumers, producers, and the government in detail.
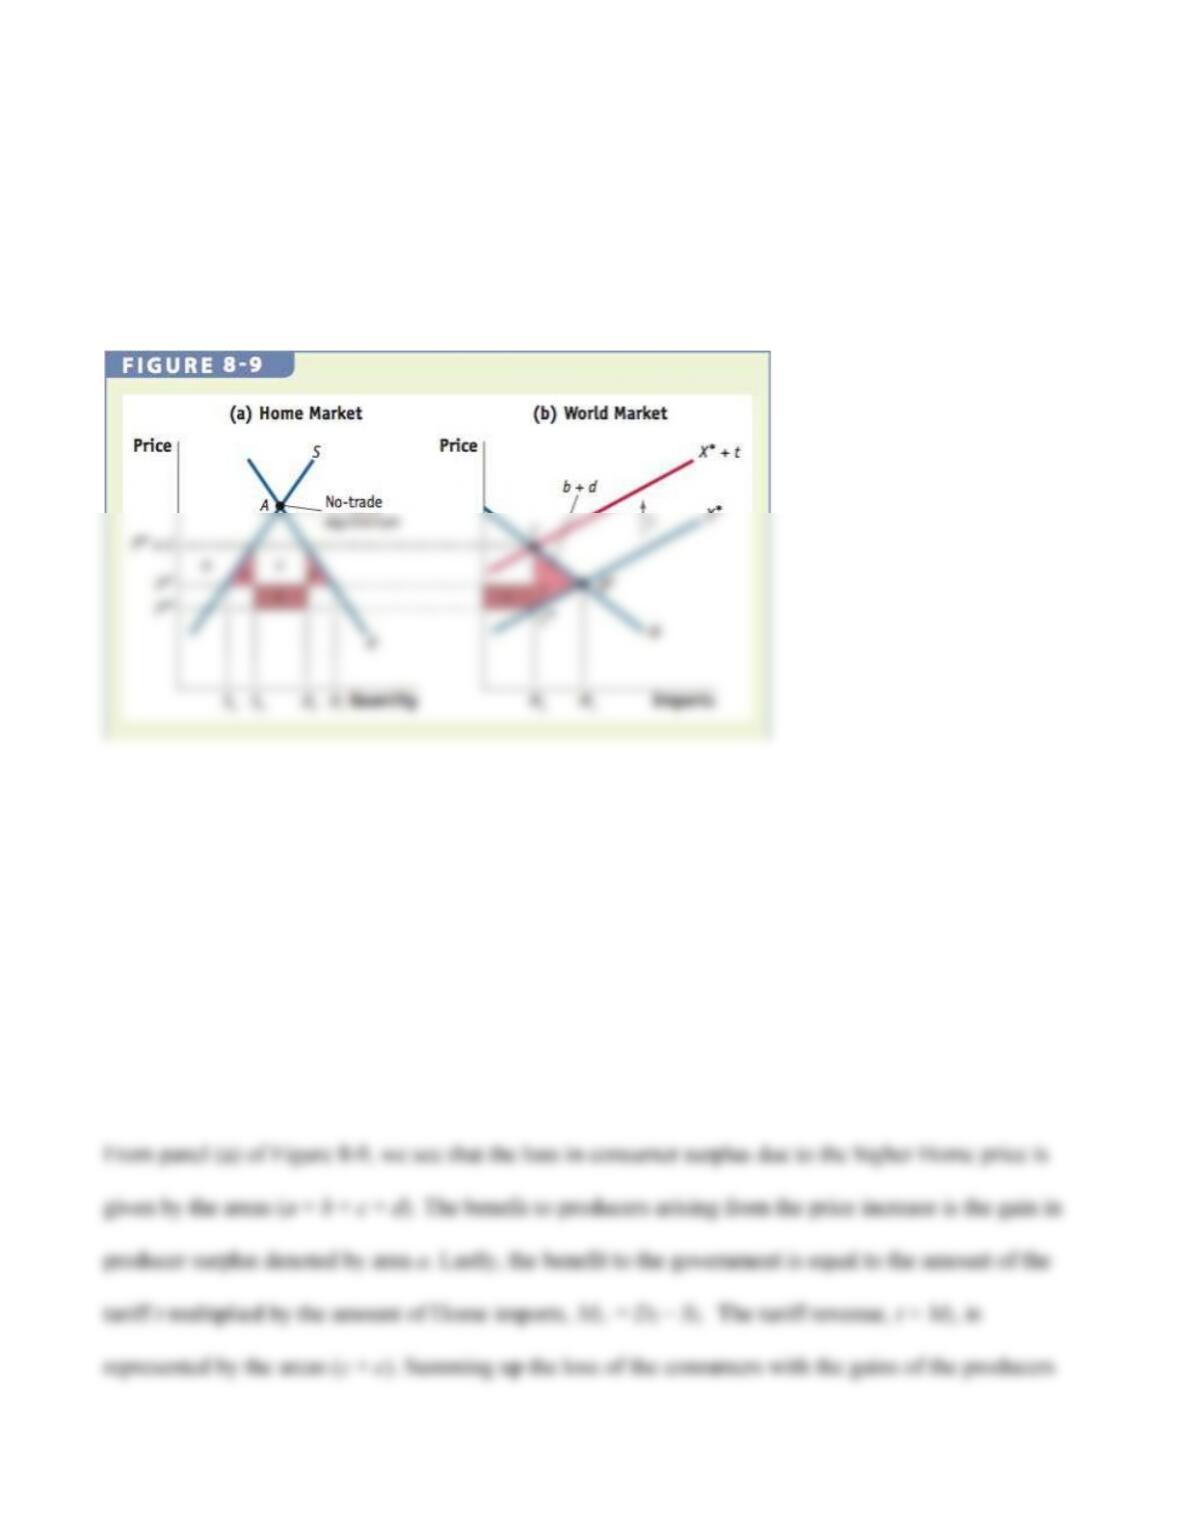
and government gives the overall impact of the tariff as follows:
Fall in consumer surplus: −(a + b + c + d)
As in the small-country case, the triangle (b + d) indicates the deadweight loss due to the tariff.
However, contrary to the small country, the large country gains area e because it is able to shift part of
Foreign and World Welfare By contrast to Home, exporters in Foreign suffer a loss given by (e + f) in
panel (b). Although the terms-of-trade gain for Home is offset by the terms-of-trade loss by Foreign (i.e.,
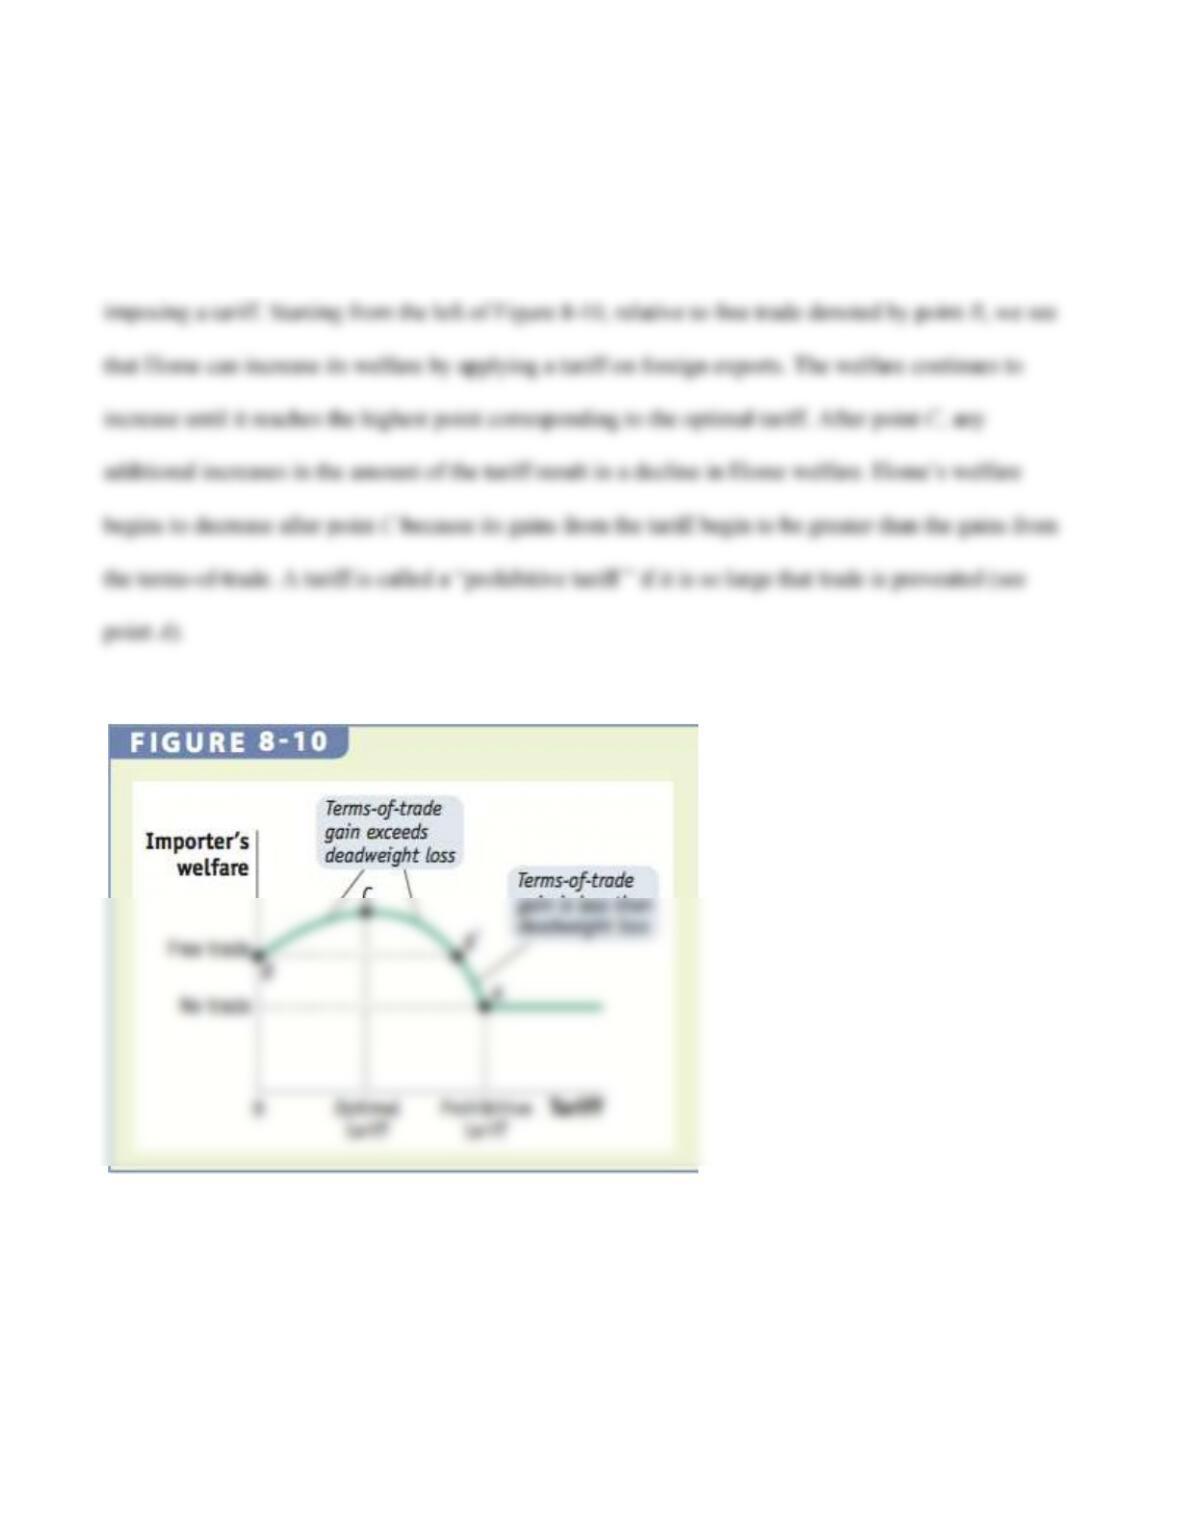
Optimal Tariff for a Large Importing Country We have found that a large importer might gain by
imposing an import tariff but have not yet determined what level of tariff a country should apply in order
to maximize their welfare.
Optimal Tariff To clearly calculate the effect of the tariff on U.S. welfare, we will need to incorporate
the concept of the optimal tariff, the duty that maximizes the increase in welfare for the importing
country. To begin with, our theory tells us that a large importing country can increase its welfare by
Optimal Tariff Formula The formula for the optimal tariff is
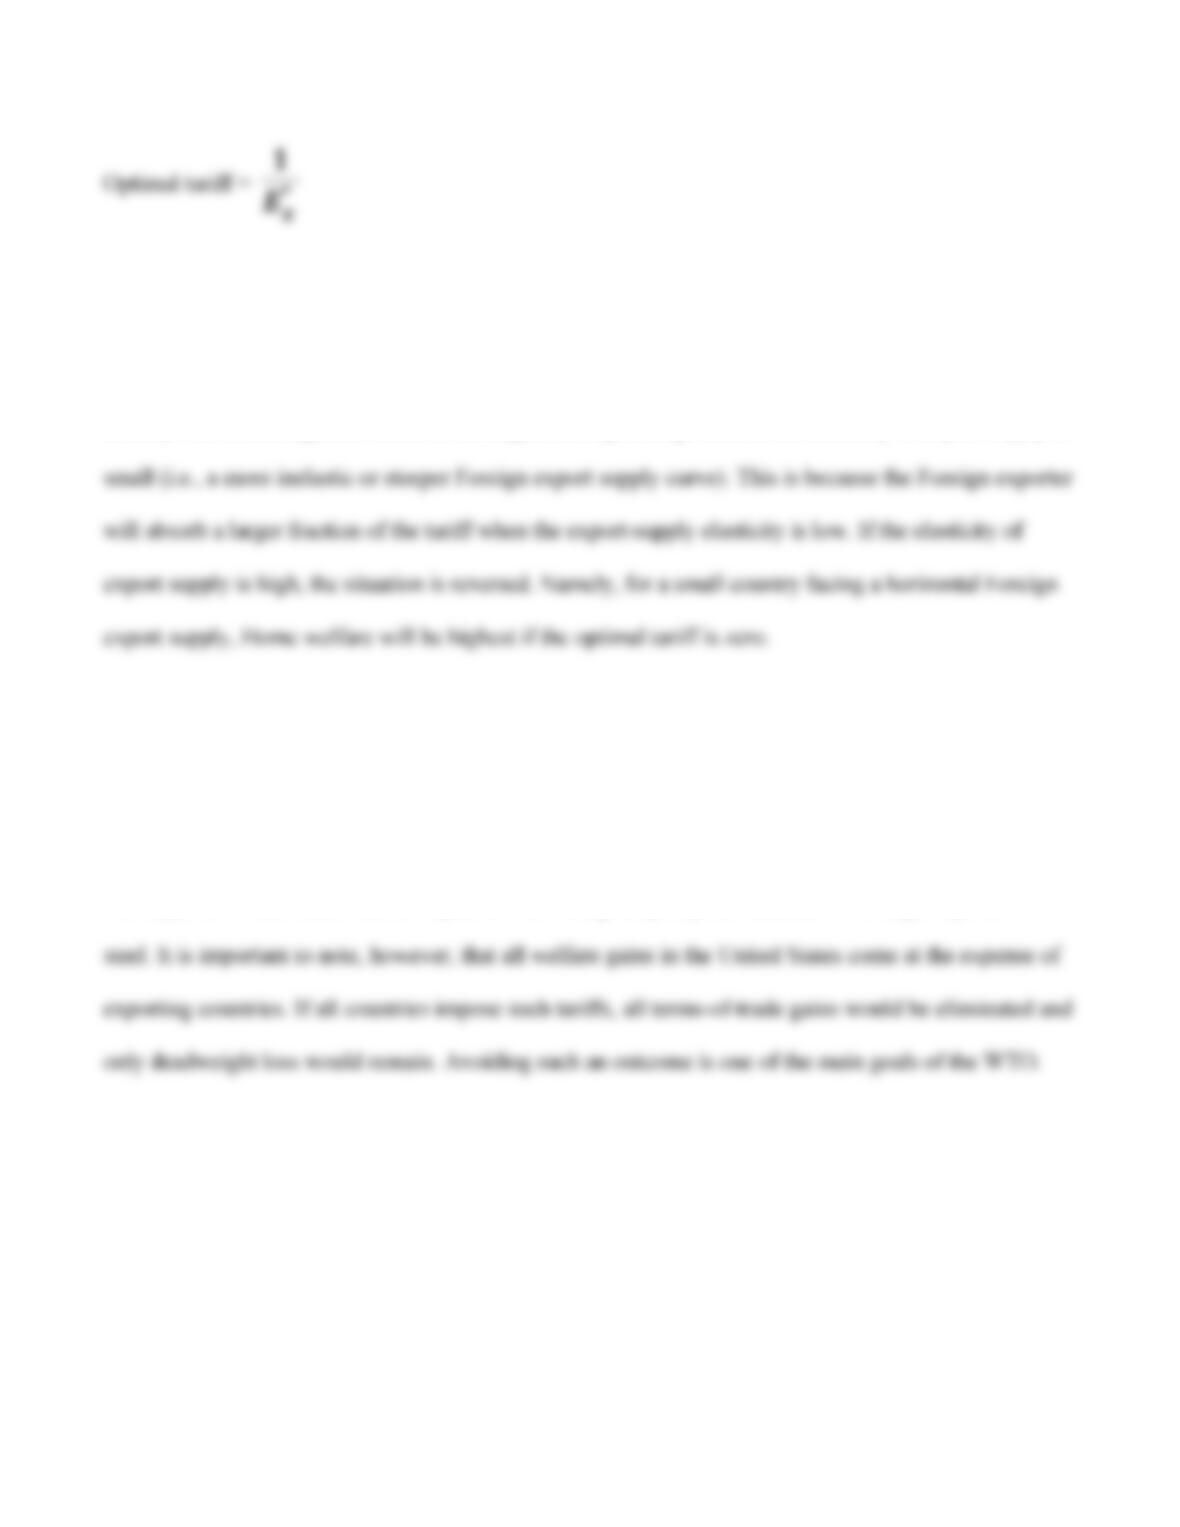
where E*X is the elasticity of export supply, which measures the percentage change in the quantity
exported due to a percentage change in the world price of export. Thus, according to the formula, a
country will obtain a greater terms-of-trade gain through a large tariff if the elasticity of export supply is
APPLICATION
U.S. Tariffs on Steel Once Again
We will reexamine the effect of the steel tariff on U.S. welfare, assuming that it is a large country.
Namely, the United States has an impact on the Foreign export price because it is a large importer of
Optimal Tariffs for Steel With the established formula, we can now determine the impact of the tariffs
on the steel industry using the export supply elasticities presented in Table 8-2.
For the steel products classified under iron and non-alloy steel flat–rolled products and iron and steel
tubes, pipes, and fittings, the export supply elasticities are large. Taking the inverse of the export supply
elasticity for each of these product categories, we can calculate the optimal tariffs and compare them
The first three items have small elasticities of export supply. Therefore, the United States is a large
country relative to other countries in importing these products such that the optimal tariffs, given by the
third column, are very high. As an example, U.S. welfare would be maximized if the government levied
5 Import Quotas
After more than three decades from its inception in 1974, the system of import quotas known as the
Multifibre Arrangement (MFA) came to an end on January 1, 2005. In an effort to protect their
2009.
H E A D L I N E S
Sugar Could Sweeten U.S.‒Australia Trans-Pacific Trade Talks
In an effort to protect American farmers from import competition, the United States has imposed import
quotas on foreign sugar. As a result of the restriction, the domestic sugar price was roughly double the
world price until about 5 years ago. However, the sugar program may need to change under the current
Import Quota in a Small Country
In this section, we will examine the differences between tariffs and import quotas on Home, Foreign,
and world welfare. Although the effect of an import quota on a small country is similar to that of a tariff,
we will find that import quotas impose greater welfare losses for the importing country than do tariffs, as
we will now show.
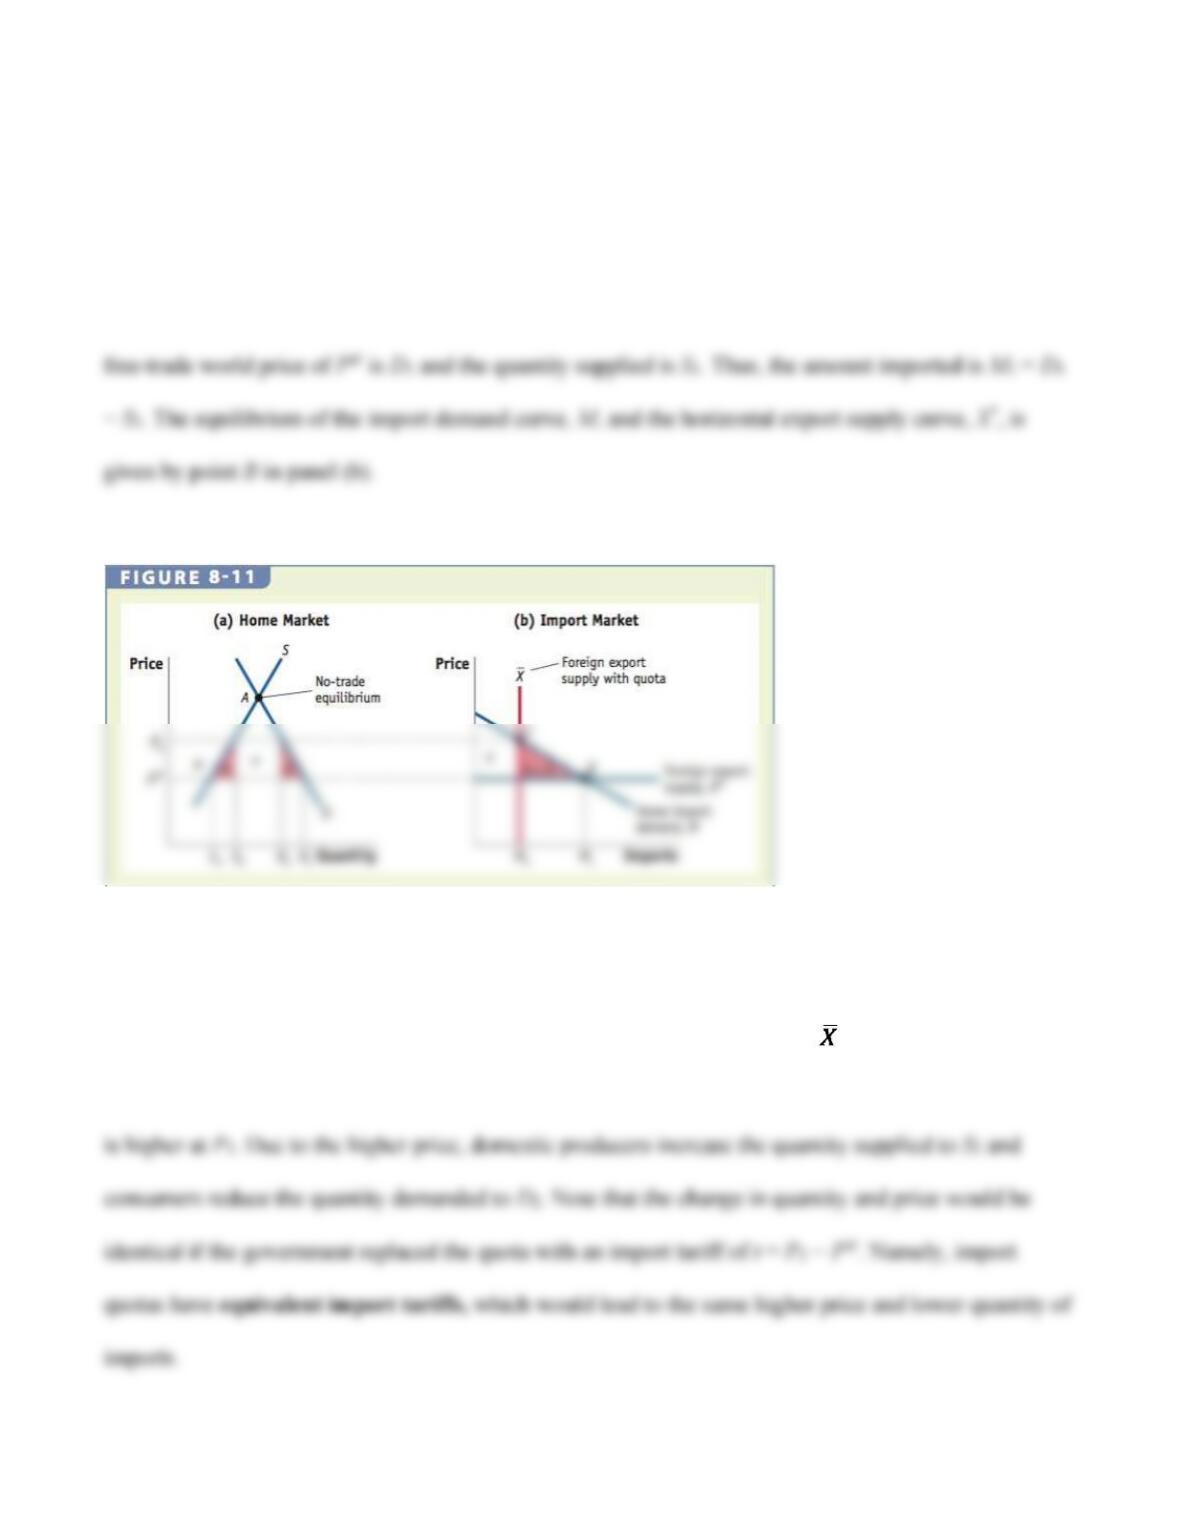
Free–Trade Equilibrium We begin the analysis of an import quota in a small country with the Home
demand and supply curves shown in panel (a) of Figure 8-11. The quantity demanded at Home given the
Effect of the Quota If Home imposes an import quota of M2 < M1, then the exports may not exceed this
amount. We can represent the limitation with a vertical export supply curve, , as shown in panel (b).
Given the Home import demand curve and the new restricted export supply curve, the equilibrium price
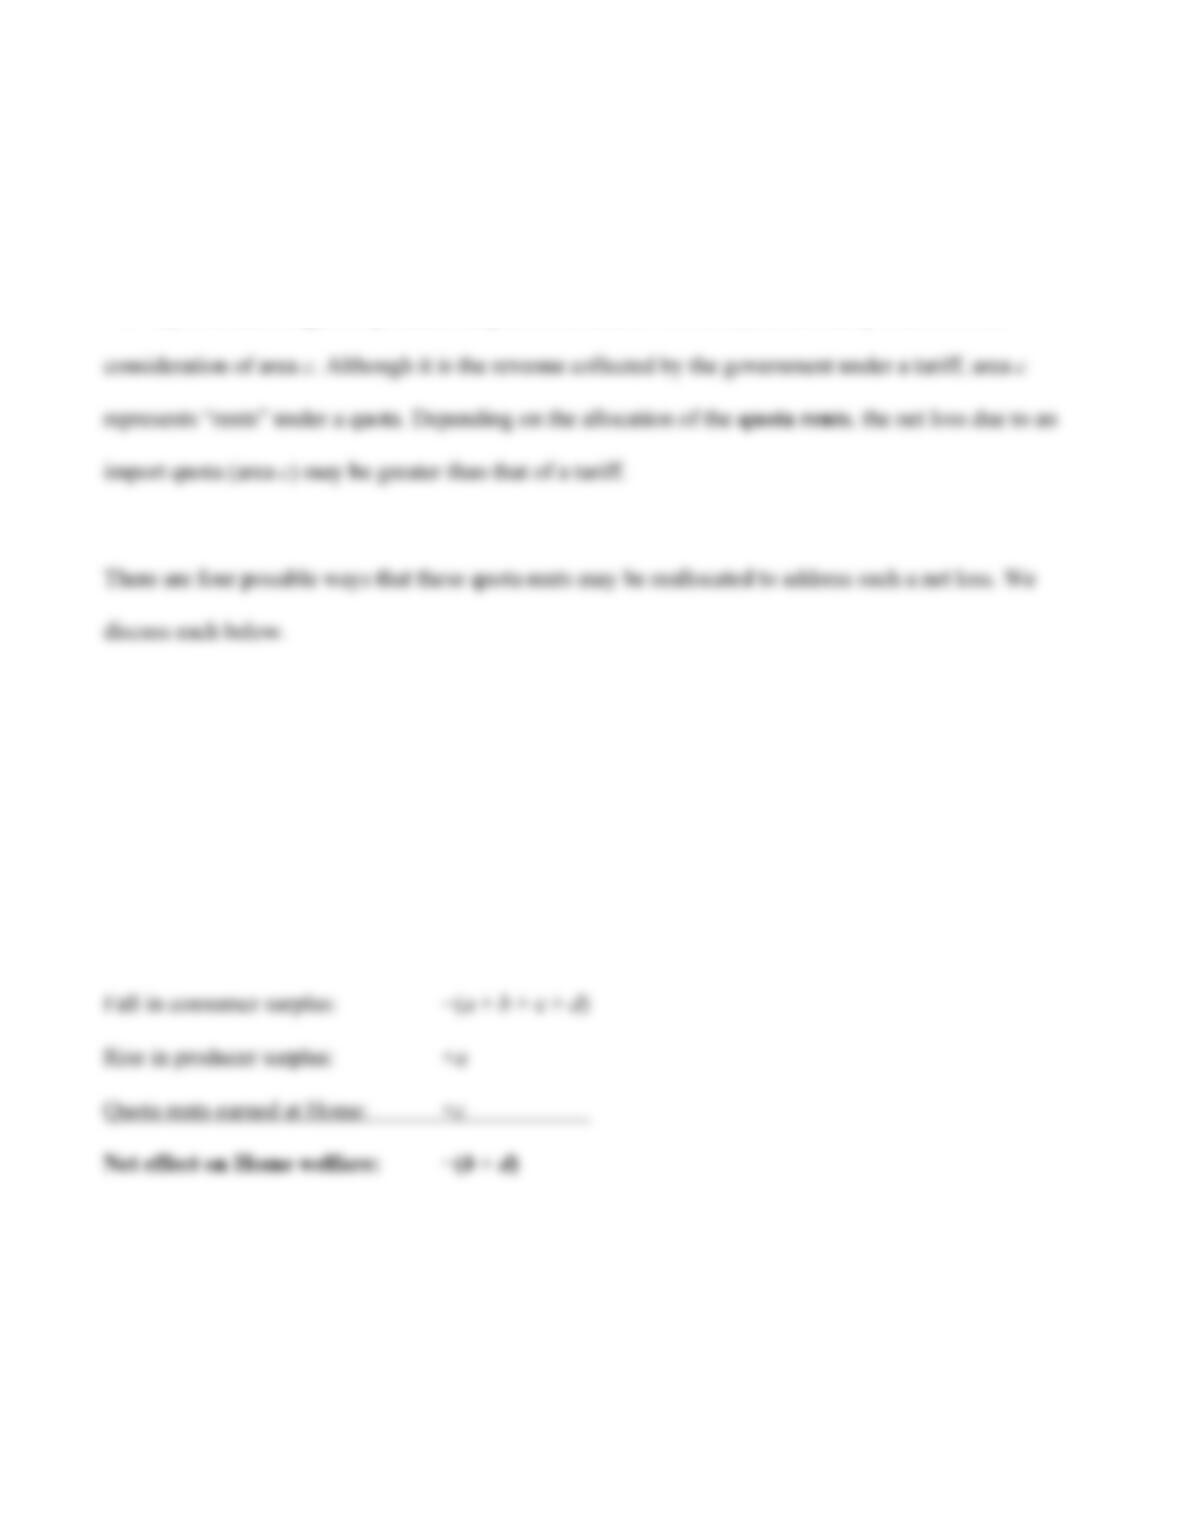
Effect on Welfare The welfare effect of an import quota on producers and consumers is similar to that
of a tariff. More specifically, in Figure 8-11 the loss in consumer surplus due to the quota is area (a + b
+ c + d), whereas the gain in producer surplus is the area a. However, the similarity ends with the
1. Giving the Quota to Home Firms The first possibility is for the quota licenses to be given directly to
the Home firms. Namely, the Home firms are given the right to import the amount M2 at the world price
of PW and to sell it in the domestic market at the price of P2. Therefore, the rents earned by the Home
firms are M2 • (P2 − PW). Summing up the losses and gains due to the quota gives
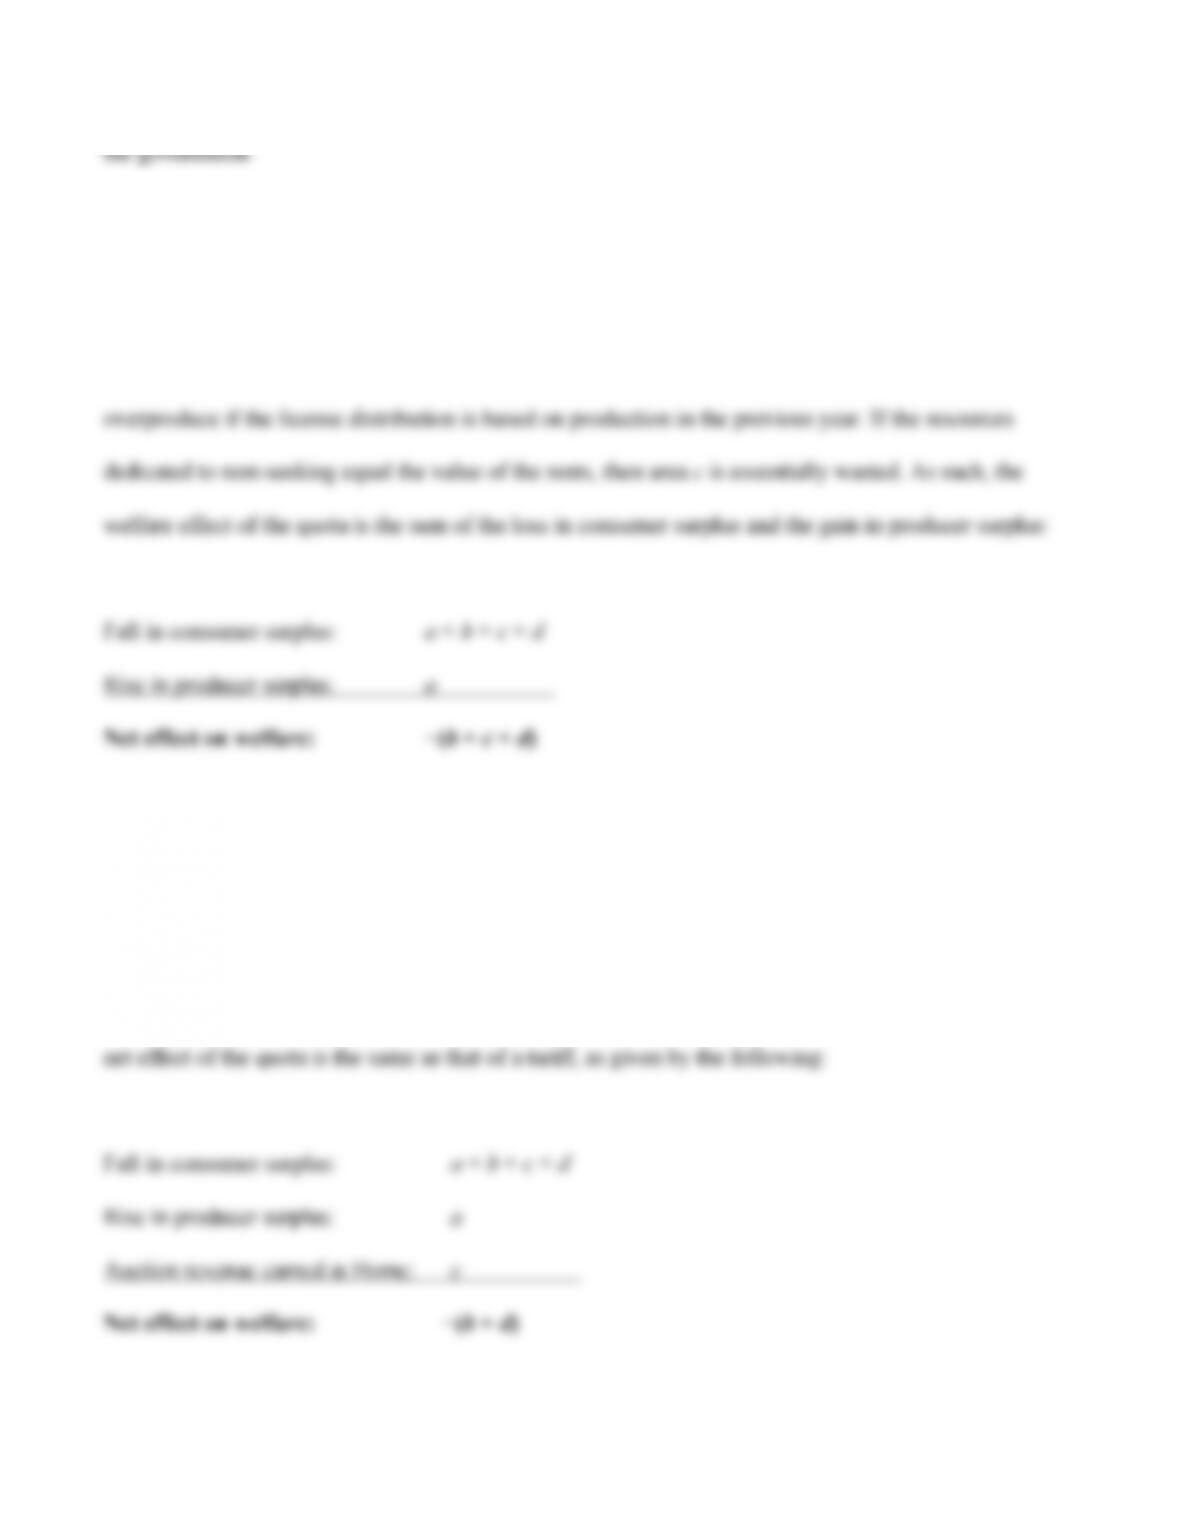
With the Home firms holding the quota licenses, the net effect of the quota on welfare is the same
deadweight loss as a tariff. The only difference is that area c is collected by the Home firms instead of
2. Rent Seeking The second possibility also involves the quota licenses to be given to the Home firms
but not directly. As a result, firms engage in rent-seeking behaviors. Namely, they employ inefficient
activities to obtain the rights to import the product at the world price of PW. For example, a firm may
Due to the rent-seeking activities, the net welfare loss is greater with the quota than a tariff.
3. Auctioning the Quota The third possibility is for the Home government to auction off the quota
licenses. Assuming that the value the government accrued from the auction is equal to area c, then the
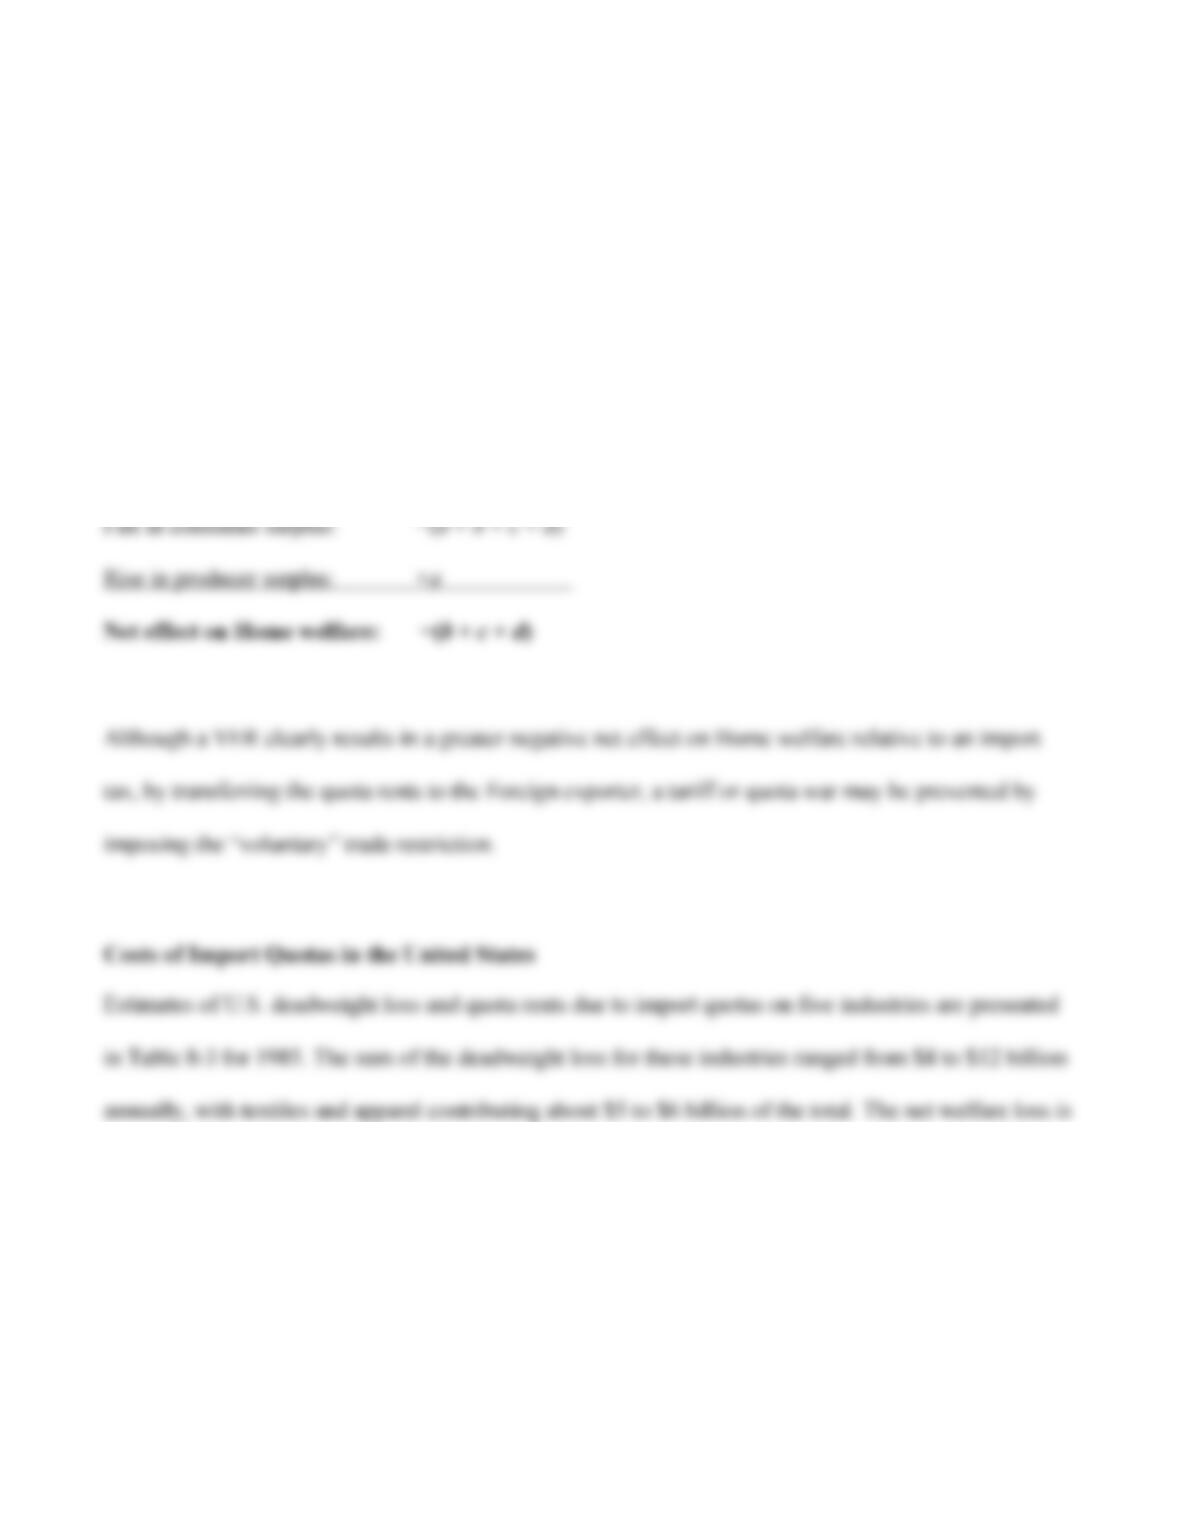
4. “Voluntary” Export Restraint The fourth possibility is the case in which the Foreign country
initiates the quota. Namely, Foreign voluntarily puts limits on the amount it exports to Home. These
self–imposed restrictions are referred to as “voluntary” export restraint (VER) or “voluntary”
restraint agreement (VRA). Because the quota rents are collected by foreign producers, the loss in
Home welfare is greater than a tariff as the summation of the losses and gains below shows:
even larger since the rents were transferred to Foreign exporters in all the industries, except for dairy.
Foreign earned about $7 to $17 billion in quota rents each year during the mid-1980s. Because some of
the quotas expired or ceased to be binding (MFA and automobiles, respectively), whereas others were
replaced by tariffs (steel and agricultural products), most of the costs associated with the import quotas
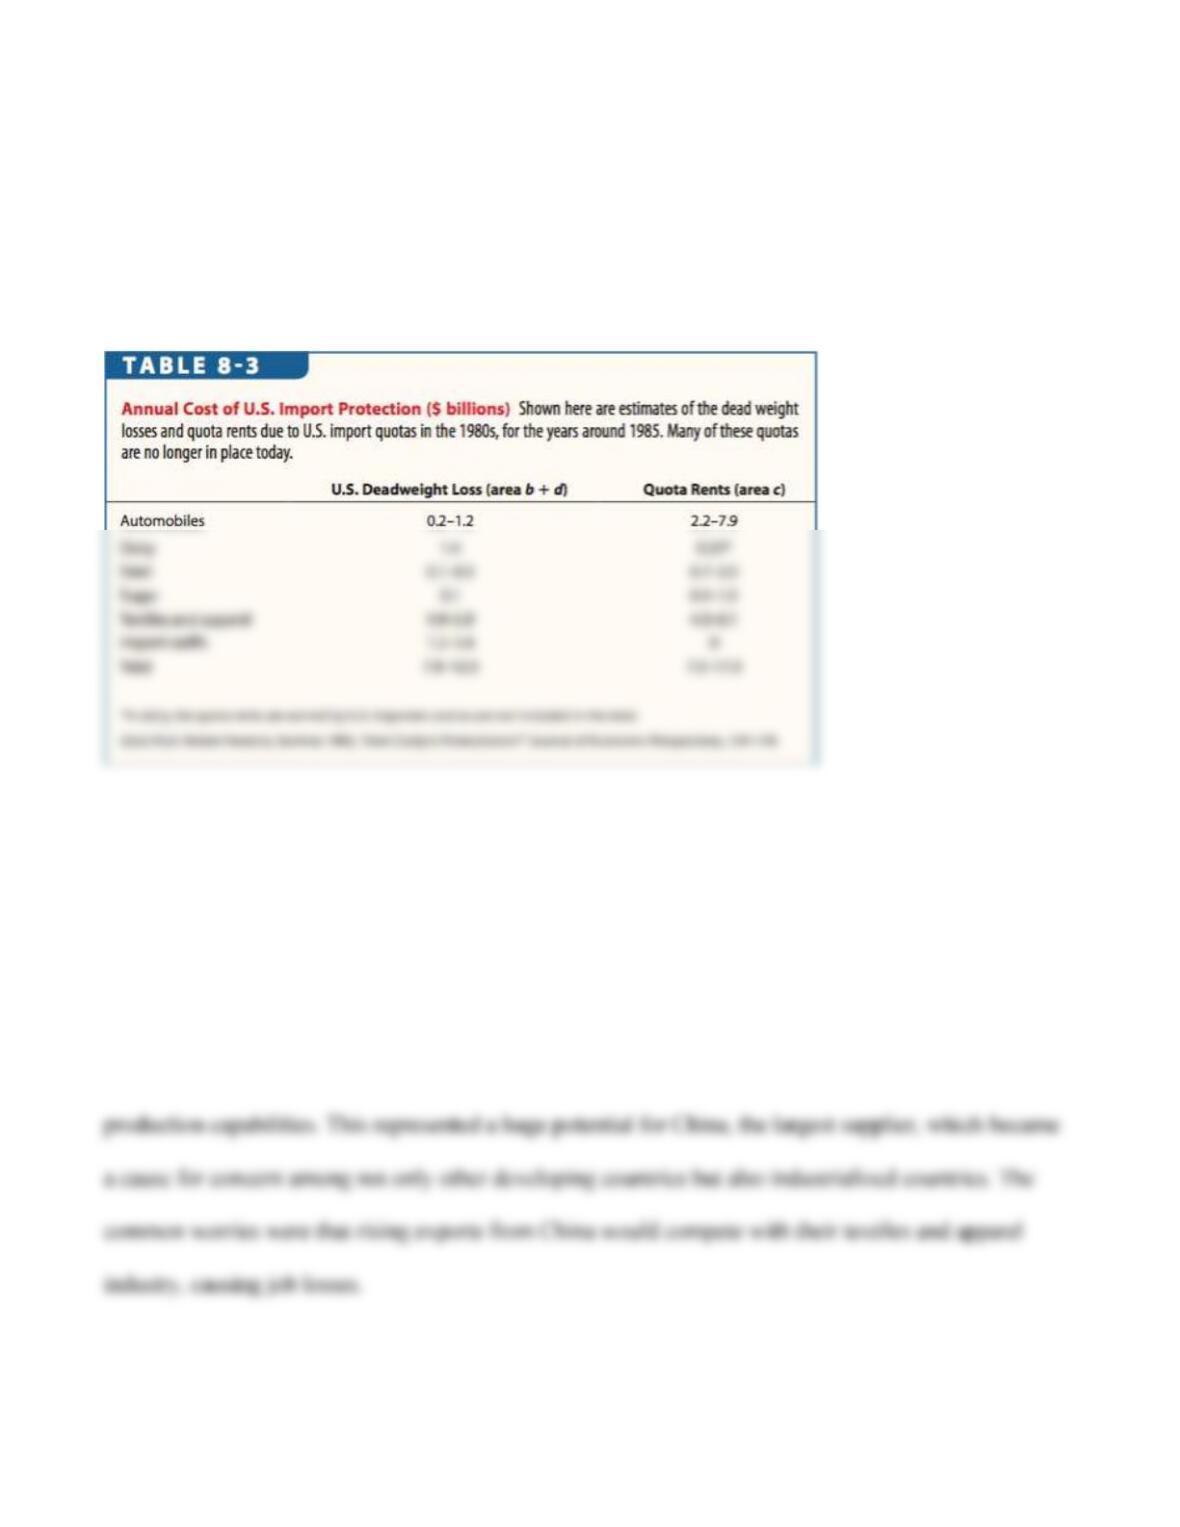
no longer exist today except for the quotas used in sugar. Nonetheless, it is important to note the total
welfare loss to the United States due to these import quotas. Although the sugar quotas remain, the TPP
has allowed for increased sales to exporting nations.
APPLICATION
China and the Multifiber Arrangement
The longstanding MFA came to an end on January 1, 2005. The system of import quotas protected the
apparel industry in industrialized countries by specifying the amount of each product the developing
countries could export. The end of the MFA meant that exporters no longer needed to hold back their