Unlock document.
This document is partially blurred.
Unlock all pages and 1 million more documents.
Get Access
8 Import Tariffs and Quotas Under Perfect Competition
Notes to Instructor
Chapter Summary
This chapter examines the impact of import tariffs and quotas on the welfare of the importing country,
exporting country, and world. The welfare implications are different, depending on whether the
whereas for large countries, gains exist but will generally come at the expense of trading partners—
implying welfare losses for the world as a whole and ultimately showing that within competitive
markets, tariffs and quotas cannot be justified on economic grounds.
Comments
To help students understand the impact of import tariffs on Home welfare under the small- and large-
Lecture Notes
Introduction
Although there are legitimate reasons for applying import tariffs within a nation, they can be
implemented for political reasons in efforts to appease constituents. But, unless they are applied with the
blessing of the WTO, it often results in retaliatory measures by trading partners. These measures have
the potential to seriously impact the volume of world trade as well as national economies. This chapter
opens with the example of the United States attempting to implement tariffs on Japanese autos, which
We will learn in this chapter that a small importing country will experience welfare losses as a result of
import tariffs and quotas, while large importing countries may experience welfare gains but that will
likely occur at the expense of its exporting trading partners.
1 A Brief History of the World Trade Organization
The GATT was formed in 1947 to promote free trade among nations by reducing trade barriers. The
1. One of the main agreements governing trade states that a nation must apply the same tariffs to all
2. Although the rules of the WTO require members to maintain low tariffs, under certain
provisions, a member country may temporarily charge a higher tariff. One such case is the
4. By Article XVI, the members will refrain from distorting trade through the use of export
5. Another exemption from the rules is given in Article XIX, also referred to as the “safeguard”
6. In addition, provided that tariffs on outside members remain unchanged, two or more WTO
S I D E B A R
Key Provisions of the GATT
reduction of tariffs and other barriers to trade.
ARTICLE I: General Most-Favored-Nation Treatment
ARTICLE VI: Anti-Dumping and Countervailing Duties
Article VI allows an injured country to retaliate against an exporter illegally dumping the product in the
importing market. Dumping is defined as the act of selling the product to the importing country at a
ARTICLE XI: General Elimination of Quantitative Restrictions
Article XI requires the members to eliminate or convert other trade barriers such as quotas and import or
export licenses to tariffs that are more measurable.
ARTICLE XVI: Subsidies
A member must notify contracting parties of its intention to assist its importing or exporting industries
ARTICLE XIX: Emergency Action on Imports of Particular Products
As mentioned previously, Article XIX gives permission to a contracting party to prevent or remedy any
conditions as to cause or threaten serious injury to the importing country by removing its obligation to
lower the tariff on the exporting country.
ARTICLE XXIV: Territorial Application—Frontier Traffic—Customs Unions and Free-Trade
Areas
2 The Gains from Trade
In what follows, we use the concept of consumer surplus and producer surplus to examine the gains a
country receives from engaging in international trade, beginning with a review using supply and demand
curves.
Consumer and Producer Surplus
Recall that the height of the demand curve reflects the consumer’s willingness to pay for a product. With
the demand curve, D, illustrated in panel (a) of Figure 8-1, the consumer is willing to buy D1 units of the
good at the price of P1. For the last unit purchased, the demand curve intersects the price paid. This
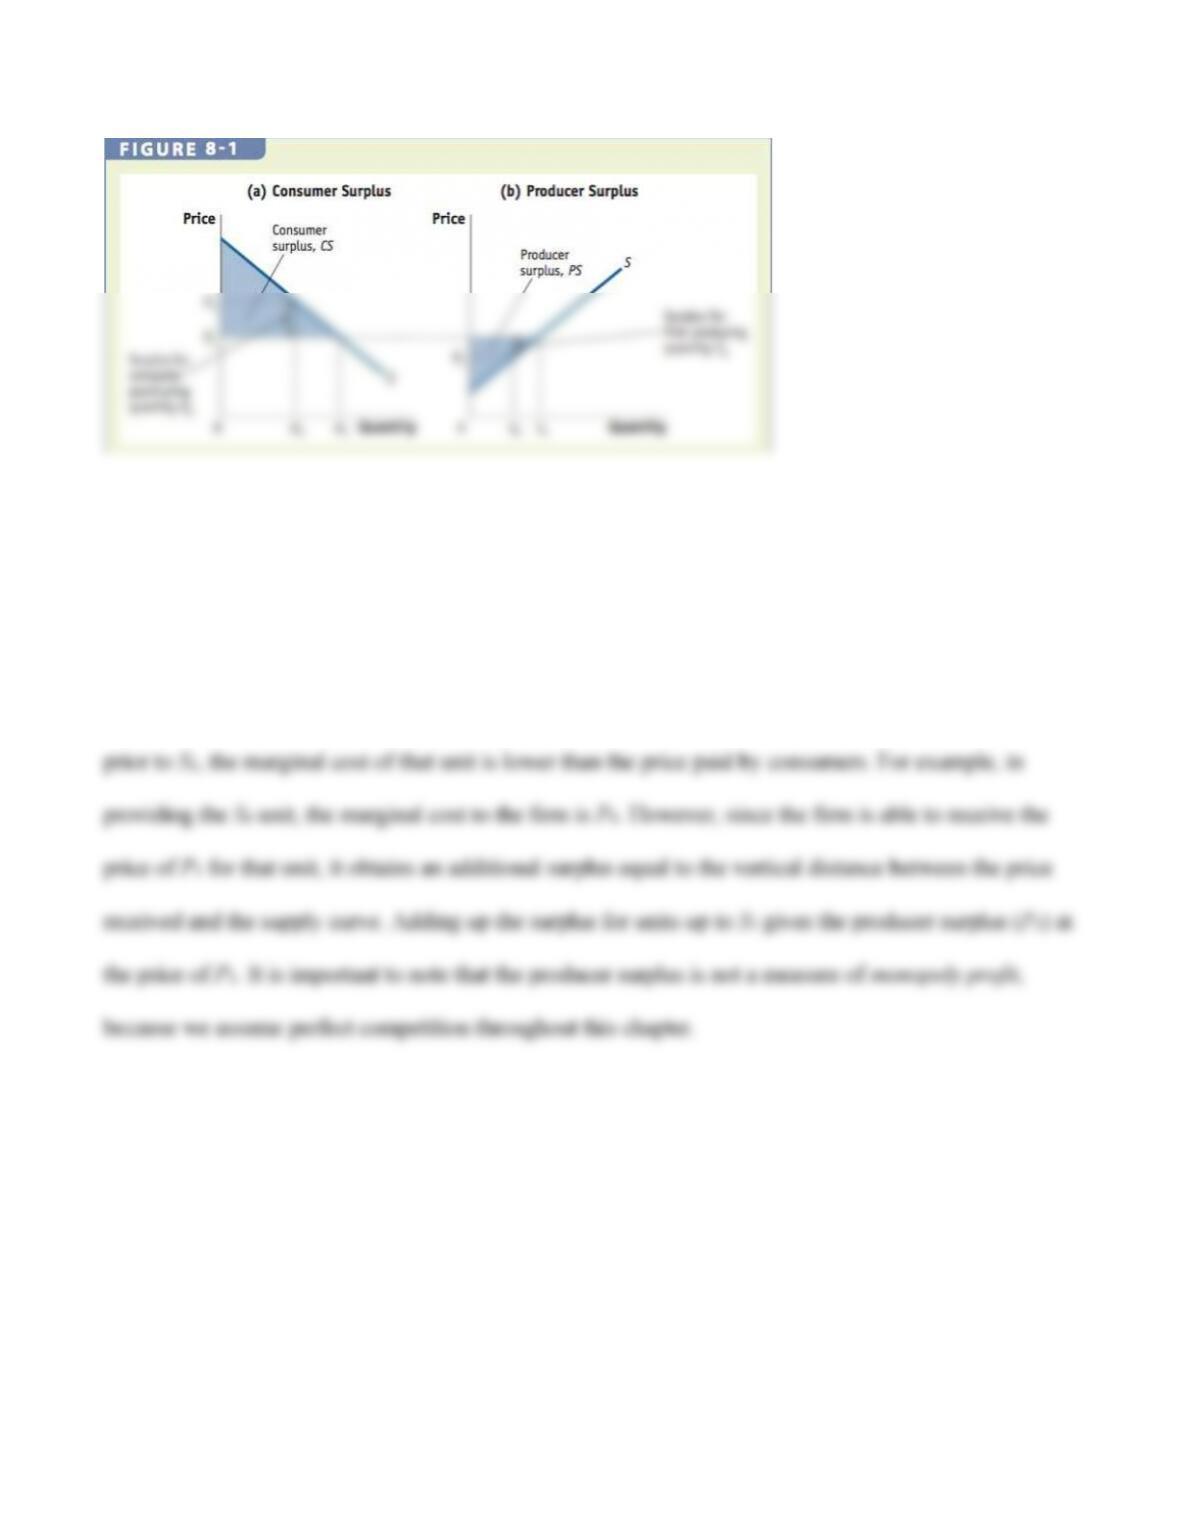
To determine producer surplus, refer to the supply curve, S, shown in panel (b) of Figure 8-1. The
supply curve indicates the marginal cost of producing each additional unit of output. Given a price of P1,
a firm will supply S1 quantity of the product. In supplying the last unit, the marginal cost incurred by the
firm from production is precisely offset by the price received. For each quantity produced by the firm
Home Welfare
Using the concept of consumer and producer surplus, we will return to our simple world of two
countries to examine how trade affects the total welfare at Home.
No-Trade Panel (a) of Figure 8-2 shows that in the absence of trade, the intersection of supply and
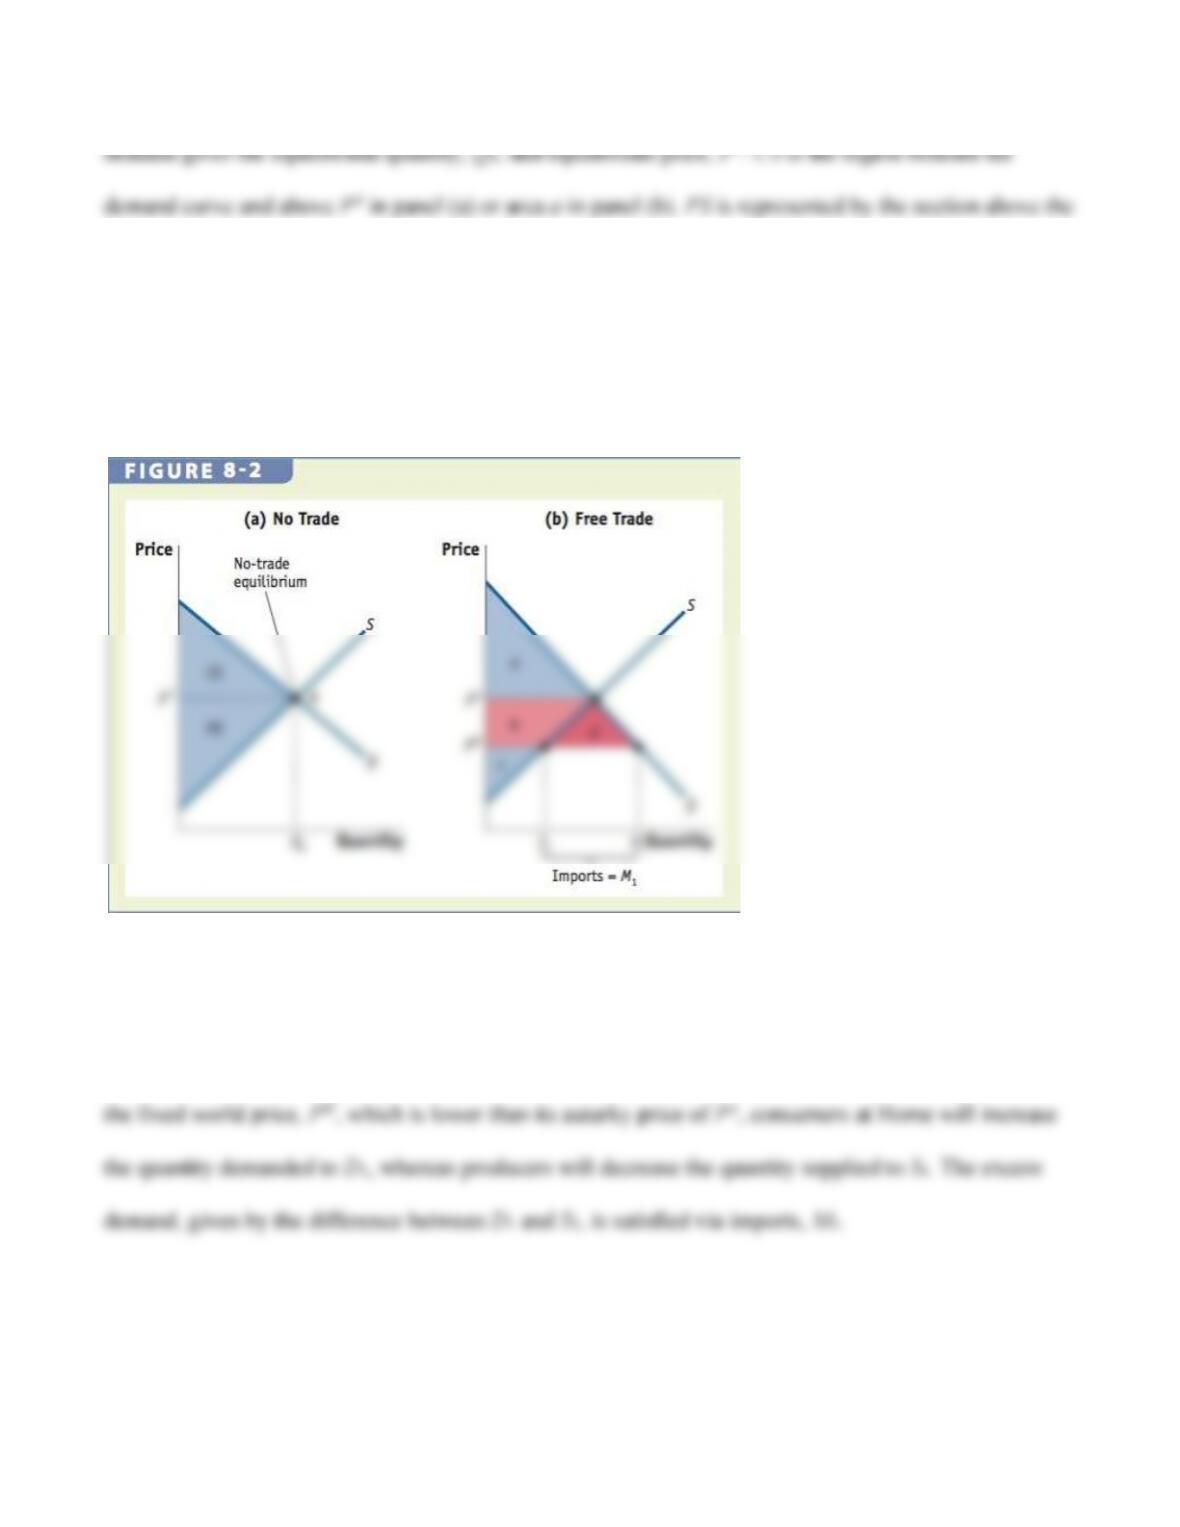
supply curve and below PA in panel (a) or area (b + c) in panel (b). The Home welfare is the sum of
consumer and producer surplus, which equals CS + PS in panel (a) or area (a + b + c) in panel (b).
Home is better off the greater the amount of consumer and producer surplus.
Free Trade for a Small Country We will now allow Home to engage in international trade. Suppose
that Home is an importer much too small to impact the world price by the amount it purchases. Given
Gains from Trade Let’s turn to panel (b) to determine the gains from trade. Under free trade,
The drop in price results in a loss of area b for producers. By summing up the gains of the consumers, (b
+ d), with the losses of producers, area b, we can calculate the net effect of trade on Home welfare as
follows:
Rise in consumer surplus: +(b + d)
Home Import Demand Curve
We will briefly review the concept of import demand curves and export supply curves first introduced
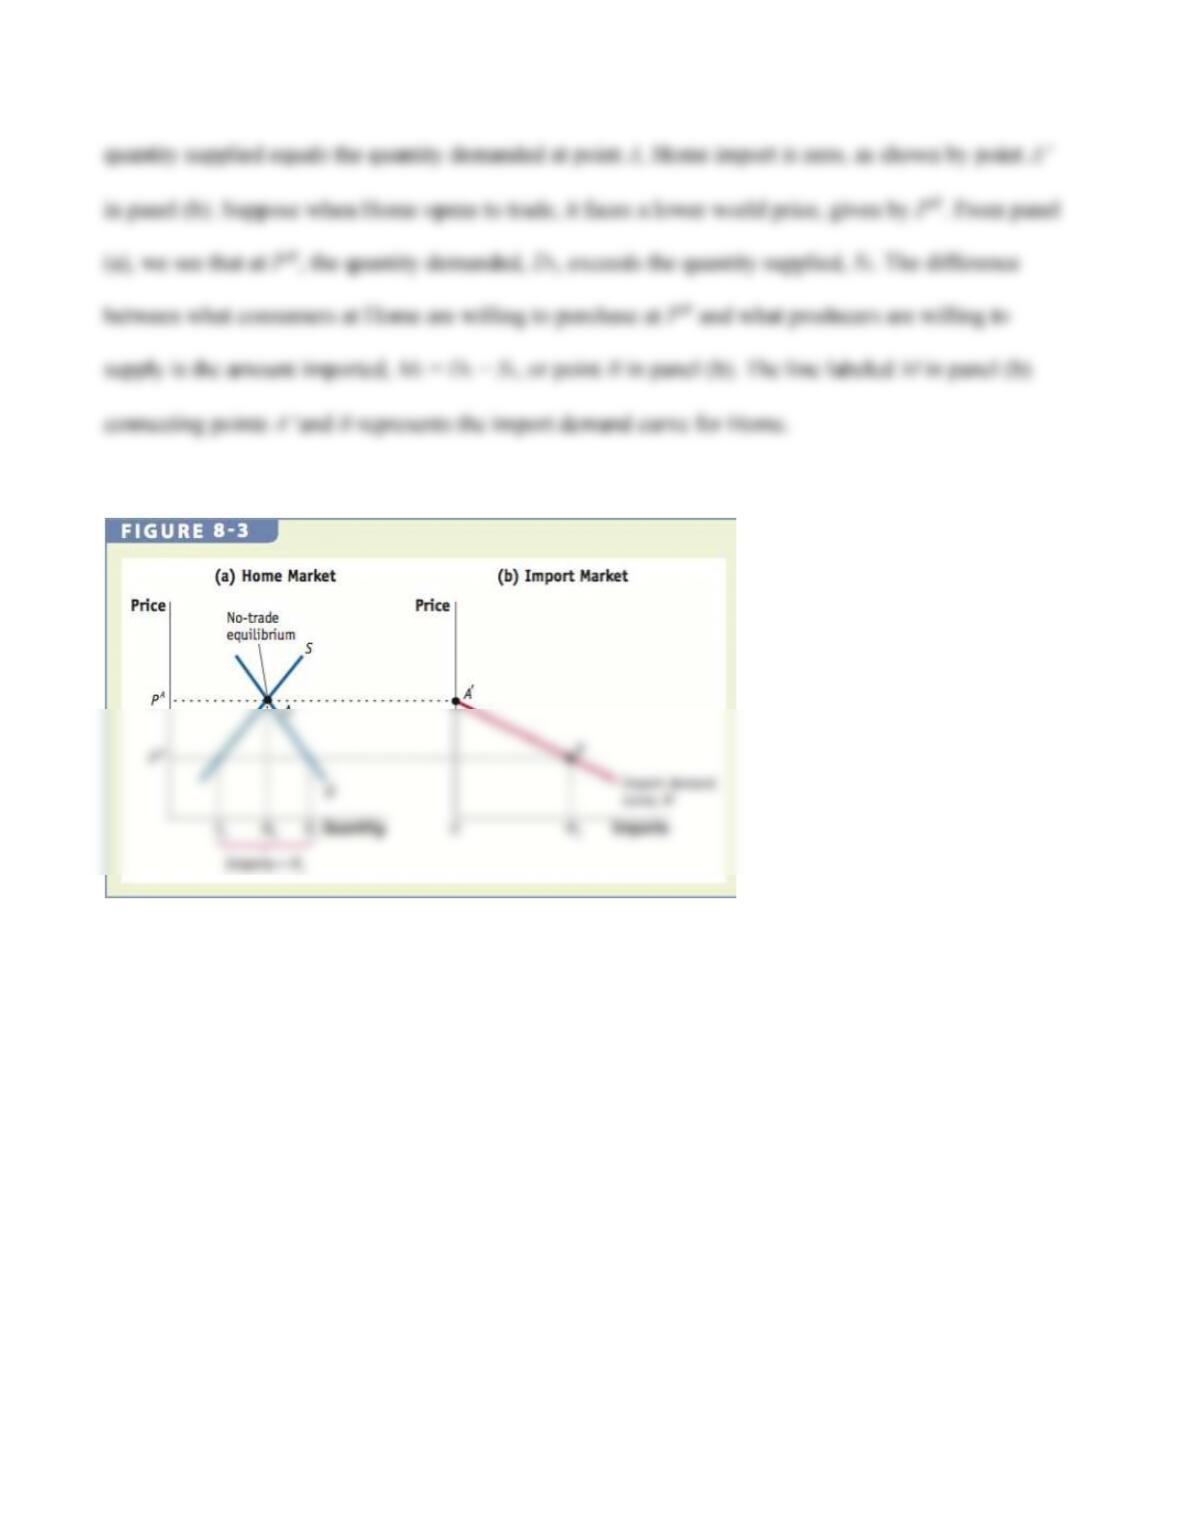
in Chapter 2 before we begin our analysis of import tariffs. Panel (a) of Figure 8-3 shows the familiar
supply and demand diagram for Home. The domestic market equilibrium, in the absence of trade, is
given by point A, with equilibrium quantity and price denoted by Q0 and PA, respectively. Because the
3 Import Tariffs for a Small Country
We are now ready to examine the effect of an import tariff on Home’s welfare. We begin by assuming
that Home is a small country, taking the world price as fixed. We will show that the tariff acts as a tax,
increasing the price of the good in Home.
Free Trade for a Small Country
Figure 8-4 shows the Home market in panel (a) and the import market in panel (b). Given that the world
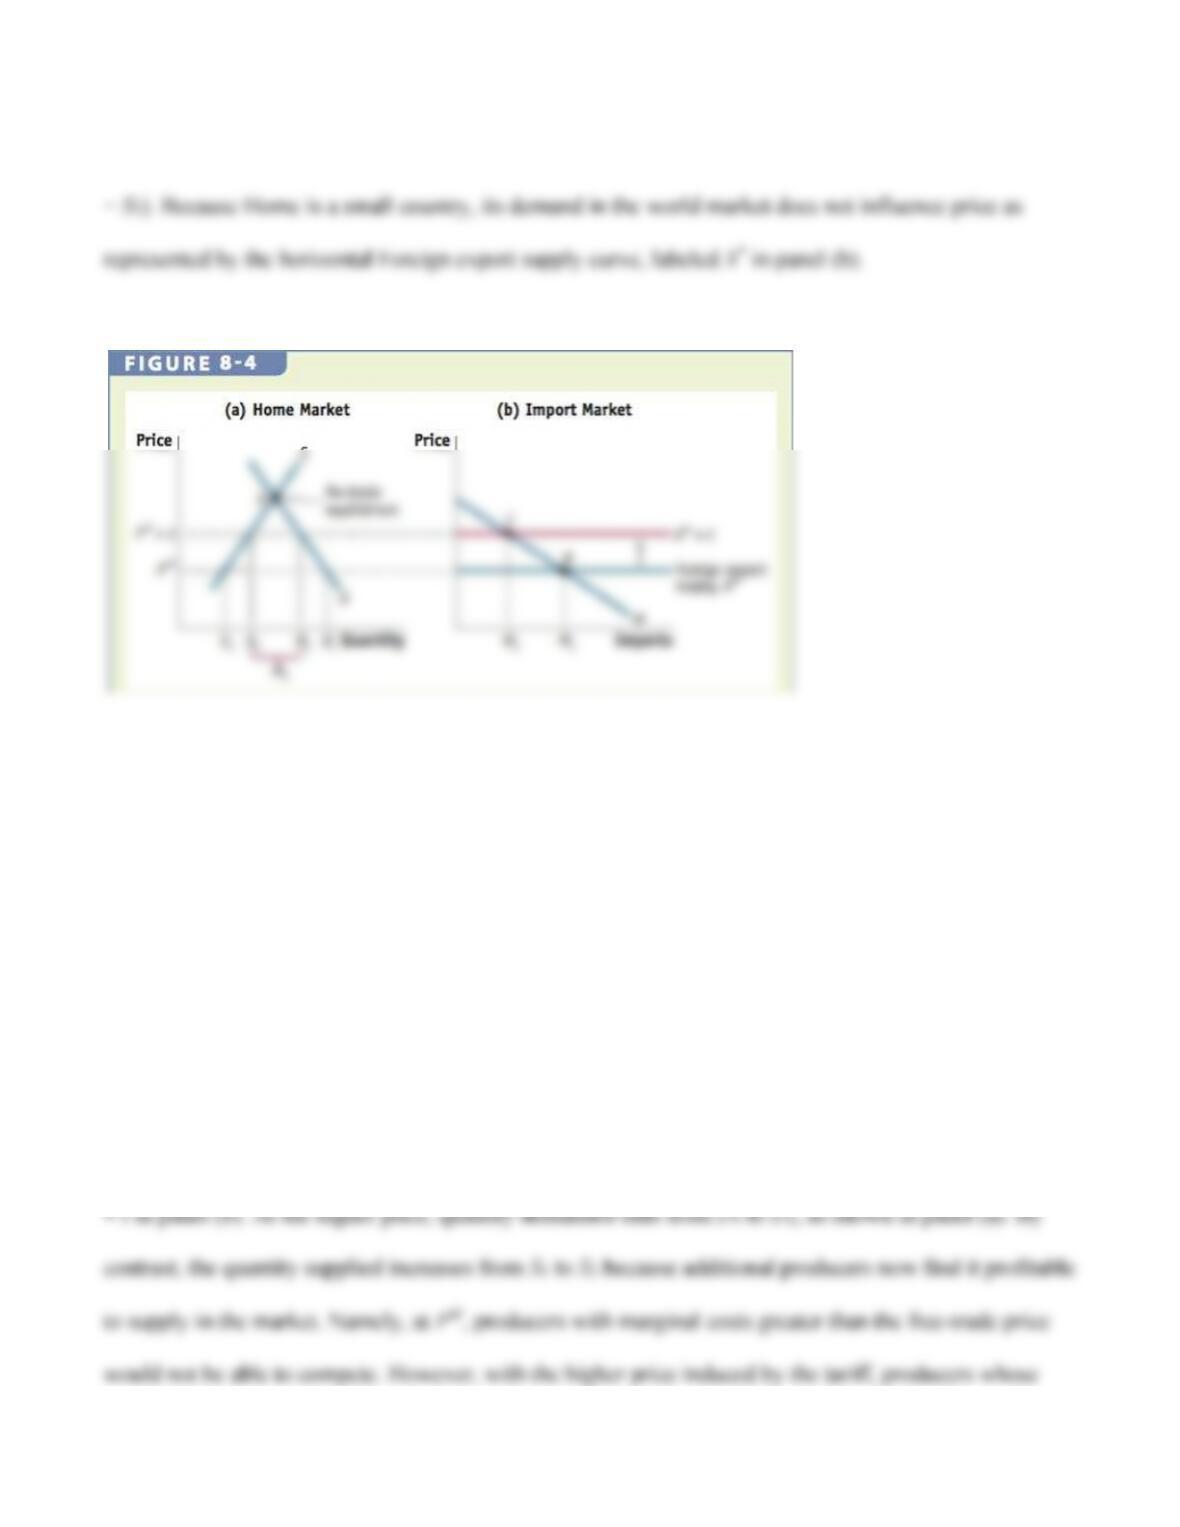
price, PW, is below the no-trade equilibrium price, Home will import M1 to meet the excess demand (D1
Effect of the Tariff
In what follows, we will impose an import tariff, also known as a duty, in the amount of t on each good
that enters Home. Similar to other forms of taxes, the import tariff will have an effect on the price paid
by the consumer as well as the prices received by the local and foreign producers. We assume that the
product is homogenous, whether produced at Home or exported from Foreign.
Due to the import tariff in the amount of t per unit, the price of the import increases from PW to PW + t in
panel (a), which corresponds to an upward shift of the export supply curve by the size of the tariff to X*
tariff raised the price paid by consumers from PW to PW + t, consumer surplus is no longer the area under
the demand curve and above PW, but instead is the smaller area under the demand curve and above PW +
t. The resulting loss in consumer surplus is denoted by area (a + b + c + d) in Figure 8-5(a).
Effect of the Tariff on Producer Surplus Contrary to the situation for consumers, producer surplus
increases as a result of the import tariff. To see this, recall that producer surplus is the area between the
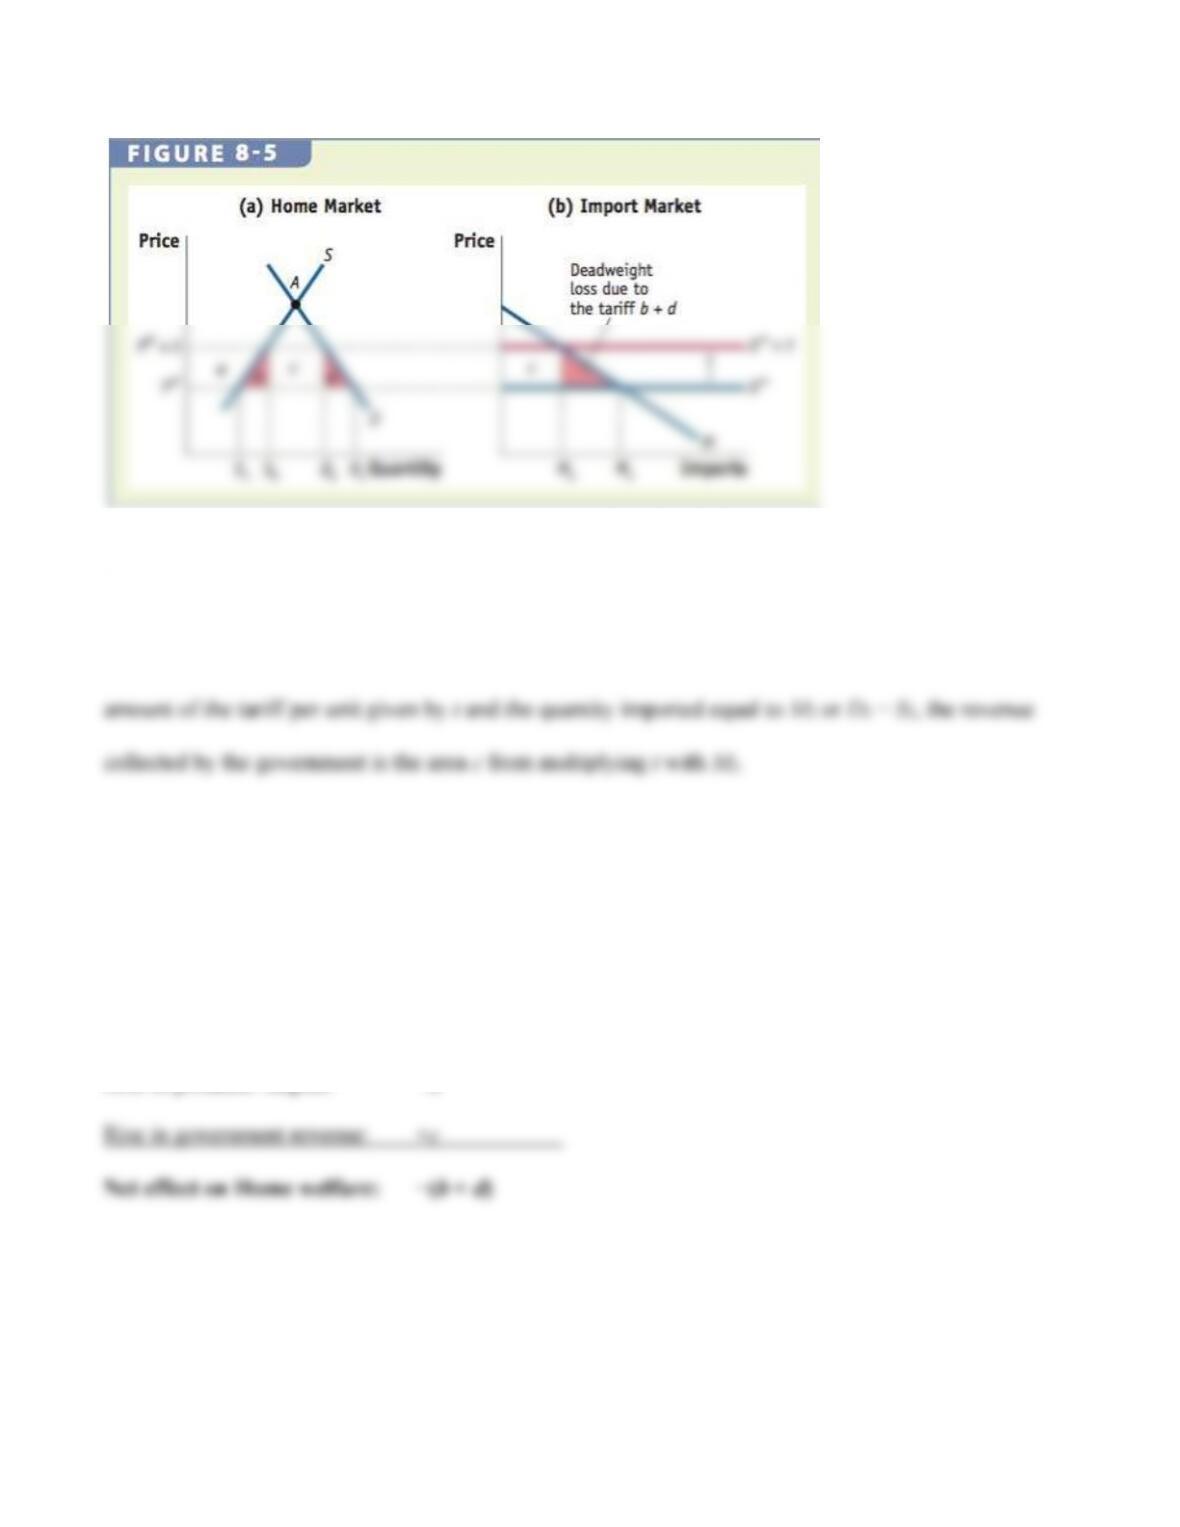
Effect of the Tariff on Government Revenue To accurately determine the impact of the import tariff
on Home welfare, we also need to consider the tariff revenue received by the government. With the
Overall Effect of the Tariff on Welfare To analyze the effects of the import tariff on Home welfare,
we sum up the loss of the consumers with the gains of the producers and government as follows:
Fall in consumer surplus: −(a + b + c + d)
Rise in producer surplus: +a
The net effect on Home welfare is negative, as denoted by the areas b and d in panel (a) of Figure 8-5.
More specifically, the areas a and c once belonging to consumers before the tariff are transferred to
Production Loss The deadweight loss can be further identified. The triangle b is called the production
loss or efficiency loss because, although the product can be imported more cheaply at the world price,
Consumption Loss With the tariff, the price faced by consumers (PW + t) is now higher than some
Why and How Are Tariffs Applied?
This section shows that a small importing country loses when it imposes a tariff on foreign export. Yet,
tariffs are widely used despite the deadweight loss for the importing country. One explanation is that
tariffs provide easy access to necessary government revenues for a developing country. Another reason
S I D E B A R
Safeguard Tariffs
The U.S. Trade Act of 1974 describes conditions under which tariffs can be applied in the United States.
Section 201 and Section 421 deal with “safeguard” tariffs.
Section 201 states that a tariff can be imposed if the U.S. International Trade Commission determines
that rising imports have been “a substantial cause of serious injury, or threat therefore, to the U.S.
Section 421 applies only to China and was added by the United States upon China’s entry into the WTO
in 2001. Under Section 421, tariffs can be imposed against China if the U.S. International Trade
APPLICATION
U.S. Tariffs on Steel and Tires
U.S. steel and tire tariffs are examples of politically motivated “safeguard” tariffs, applied despite their
deadweight loss. We now formalize this notion of deadweight loss with the example of the U.S. steel
the U.S. International Trade Commission (ITC) to initiate a Section 201 investigation into the steel
industry. The ITC, in turn, recommended to the president that the tariffs be imposed. In March 2002,
Bush placed tariffs on steel, ranging from 8% to 30%, but exempted countries that had free-trade
agreements with the United States (i.e., Canada, Mexico, Jordan, and Israel) as well as 100 small
Deadweight Loss due to the Steel Tariff To calculate the deadweight loss due to the tariff on steel, we
will define the corresponding triangle b + d in panel (b) of Figure 8-5 as
1
where ∆M is the change in import (base of triangle) and t is the increase in the domestic price (height of
the triangle) following the import tax. To measure the deadweight loss relative to the value of imports,
PW × M, we multiply the right-hand side by the percentage tariff, t/PW. Rearranging, we get
×∆
= =× ×∆
××
11
%
22
WW W
DWL t M t
ÚM
PM PM P
Next we substitute in the percentage increase in price with the average tariffs of 30% (i.e., t/PW = 0.3)
Response of the European Countries As expected, those in the steel-producing industry gained from
the tariff, whereas consumers of steel opposed the higher price. However, it was the threat of tariff
retaliation by exporting countries, which included 25 members of the European Union (EU) along with
Tariff on Tires The tariff on tires imported from China was announced on September 11, 2009. It was
intended that the tariff would last 3 years and follow a declining schedule: 35% the first year, then 30%,
and 25% the third year. The United Steelworkers that represented tire workers among other groups
requested the tariff.
Another key difference is who supported the tariff. As mentioned previously, U.S. steel producers
supported the tariff on steel, whereas no tire producers operating in the United States joined the petition
against Chinese tires. This happened because of the 10 tire producers in the United States, 7 of them also
There is one more important distinction between the steel and tire cases. The deadweight loss in the tire
A Discriminatory Tariff The tariff increases the price from PW to PW + t, as shown in Figure 8-6. Two
supply curves are shown, one for “all other exporting countries” (excluding China) and the other to
represent supply from the United States (denoted S and S + X*, respectively). The tariff increases the
all nations equally.
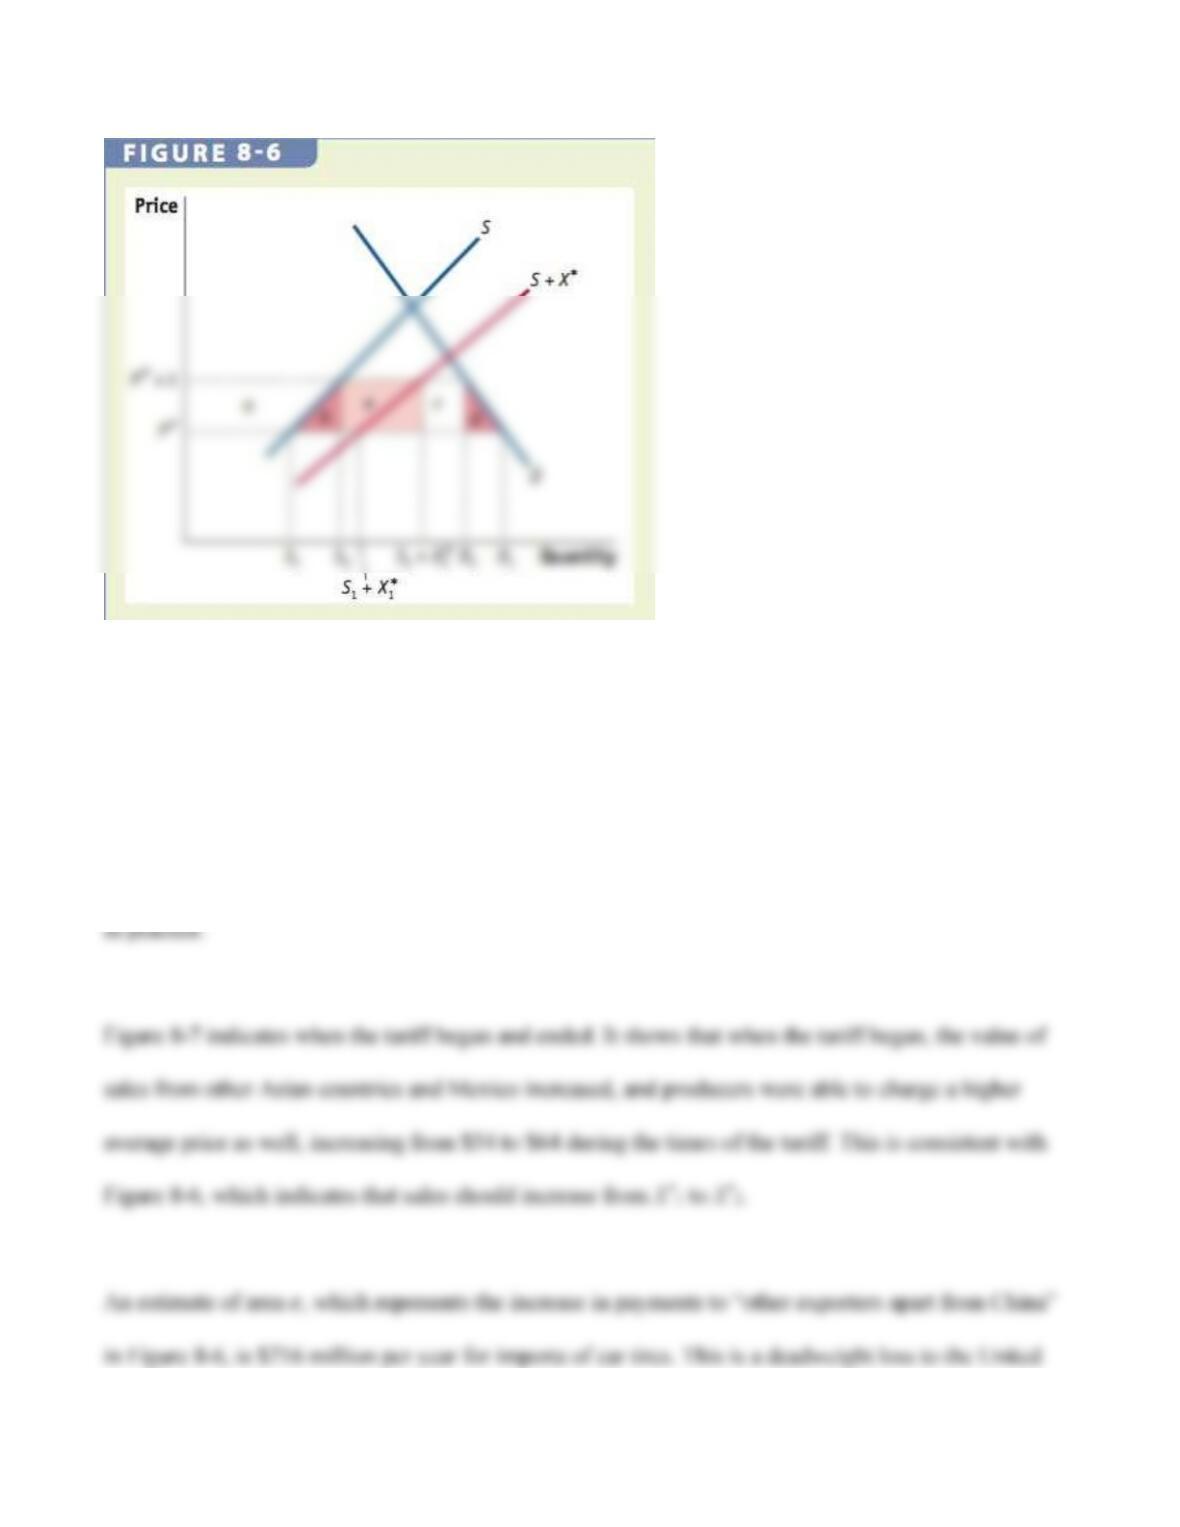
Deadweight Loss due to the Tire Tariff We have just shown that a discriminatory tariff creates a
larger deadweight loss than one applied equally across all trading partners. Figure 8-6 indicated that the
deadweight loss to a discriminatory tariff was a loss totaling areas ++, but one applied equally, as
shown in Figure 8-5, had a deadweight loss of only +. We now ask if this theoretical result is shown


