63
CHAPTER 7
OFFER CURVES AND THE TERMS OF TRADE
Learning Objectives:
■ Describe a country’s offer curve and show how it is obtained.
■ Identify how the equilibrium international terms of trade are attained.
I. Outline
Introduction
– Terms-of-Trade Shocks
A Country’s Offer Curve
Trading Equilibrium
Shifts of Offer Curves
Elasticity and the Offer Curve
Other Concepts of the Terms of Trade
II. Special Chapter Features
Concept Box 1: The Tabular Approach to Deriving an Offer Curve
Concept Box 2: Measurement of the Terms of Trade
III. Purpose of Chapter
The purpose of this chapter is to introduce students to the concept of the offer curve and
to the determination of the equilibrium international terms of trade. A general overview of the
chapter is that, until this point in the book, the establishment of the equilibrium terms of trade
has not been analyzed: now the student can see how the terms of trade result from the interaction
of supply and demand in the world market.
IV. Teaching Tips
(of exports) and a demand curve (for imports).
C. The “tabular approach” to deriving an offer curve developed in Concept Box 1 seems to
be interesting to students. It is also useful because it drives home the point about the offer curve
being both a supply curve and a demand curve. In addition, adding another row or two to the
table with appropriately-chosen numbers can yield a “backward–bending” offer curve that is
understandable.
D. The nature of the shifts in Country II’s offer curve discussed and illustrated on page 108
F. We’ve never quite puzzled out why, but some students often seem to confuse “terms of
trade” with “balance of trade.” It is useful to distinguish between these very different concepts.
V. Answers to End-of-Chapter Questions and Problems
1. A change in tastes by the home country’s consumers toward greater relative preference
for the import good would increase the willingness of the country to trade. In addition, a rise in
2. If the demand increase for the export good is by the foreign country, the terms of trade
will improve by an equal amount in either instance. If the country is large, the normal upward
shift in the foreign offer curve occurs; if the country is small, the straight-line offer curve by the
65
no impact on the terms of trade since a small country faces a foreign offer curve that is a straight
line from the origin.
3. The terms of trade for country I will definitely deteriorate, since both shifts are working
in that direction. However, the impact on the volume of trade is indeterminate without more
information. Assuming that country I is operating in the “elastic” portion of its offer curve, the
increased willingness to trade by I will lead to an expansion of both its exports and imports (if
4. With both countries operating in the “elastic” ranges of their offer curves, the volume of
country I’s exports and imports will definitely decrease. However, the terms of trade impact
(under all elasticity assumptions) is indeterminate without more information. Country I’s
5. The excess supply of exports of one good (say good X) means that, at the given terms of
trade, one country (say country I) is willing to provide a greater quantity of good X on the world
market than country II is willing to purchase at those terms of trade. PX/PY (with Y being II’s
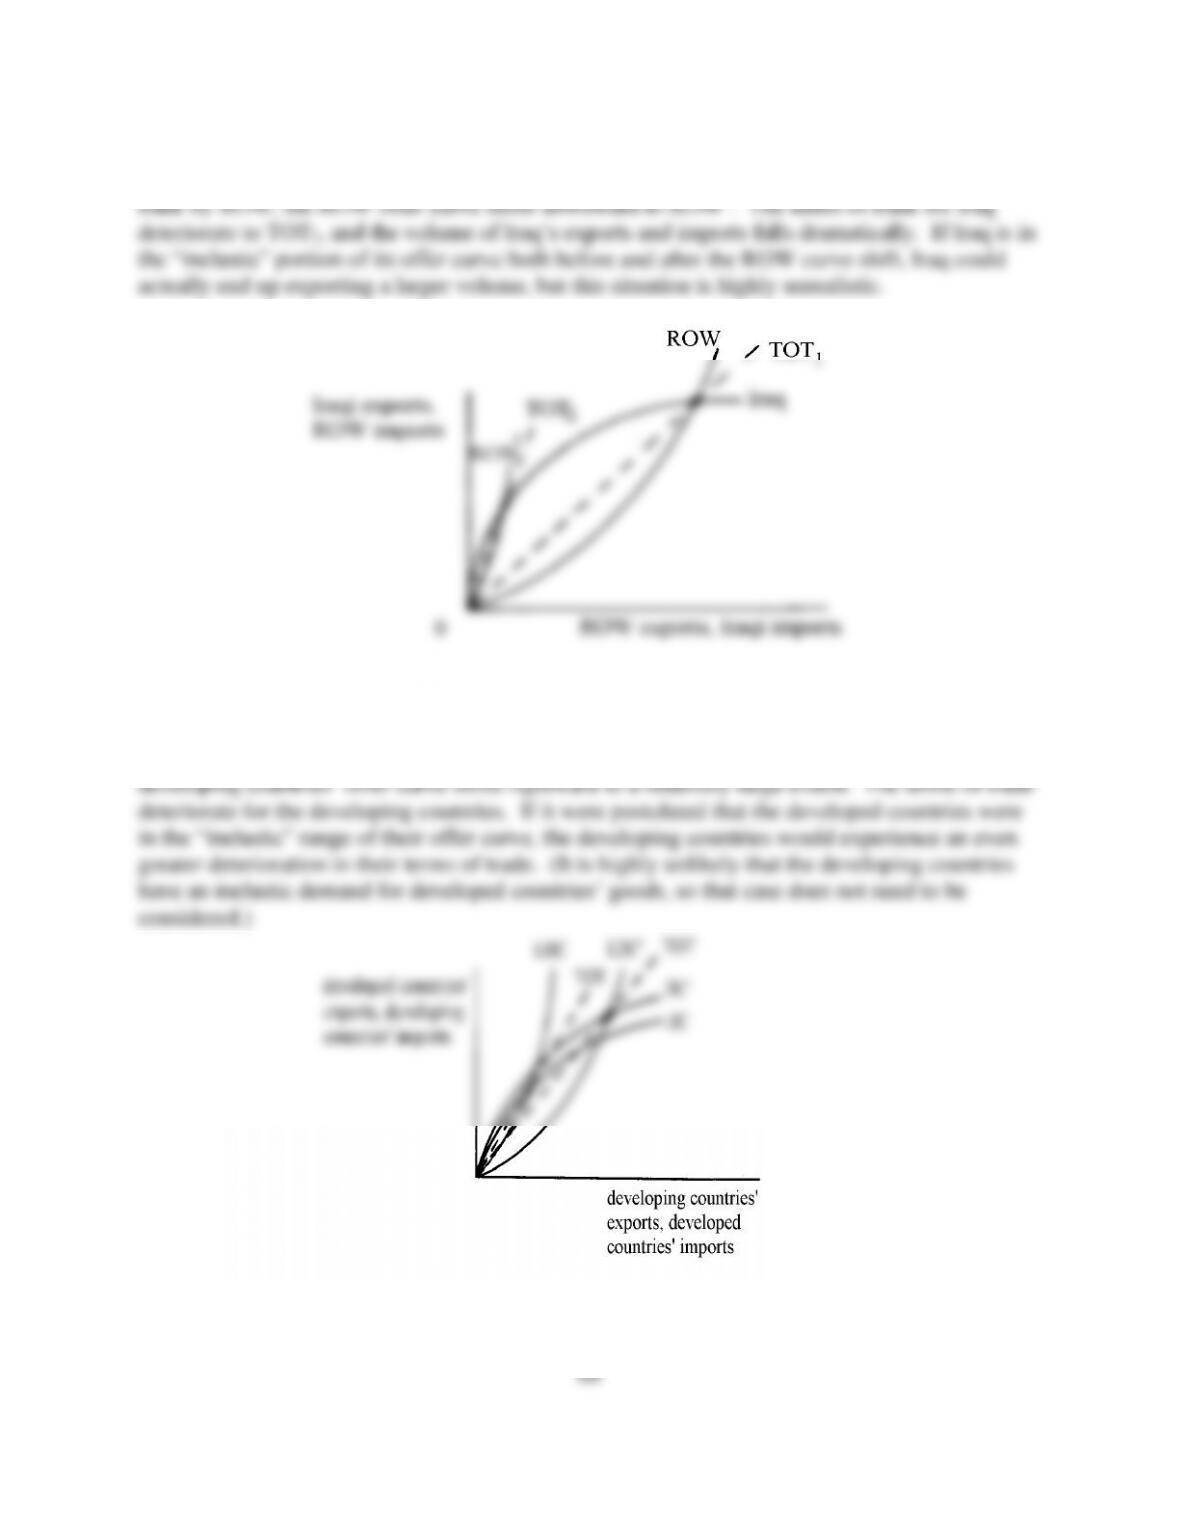
6. In the offer curve diagram below, the initial trading equilibrium between Iraq and the rest
of the world (ROW) results in terms of trade TOT1. With the greatly reduced willingness to
7. With relatively slow growth in demand for developing countries’ products by developed
countries, the developed countries’ offer curve shifts only slightly upward. With relatively rapid
growth in demand by the developing countries for developed countries’ export goods, the
8. The offer curves of the oil-importing countries were likely inelastic because the rise in
the price of oil exports by OPEC resulted in greater “revenue” (export quantity in the offer curve
67
9. “Behaving rationally” occurs even with a “backward–bending” offer curve. The
underlying economic purpose of exports is to obtain imports for enhancing utility, and a rise in
10. The commodity terms-of-trade ratio for 2015 is 92.3 [= (120/130)100]; the income terms
VI. Sample Exam Questions
A.
E
Es
ss
sa
ay
y
Q
Qu
ue
es
st
ti
io
on
ns
s
1. Suppose that a home country is contemplating the imposition of a tariff in order to
improve its terms of trade by a given amount. How would the decision as to the size of the tariff
to impose depend on the elasticity of the foreign country’s offer curve? Explain.
2. Suppose that, from an initial equilibrium position in the offer curve diagram, country I
imposes a tariff on country II’s export good at the same time that consumers in country II change
3. When Spain and Portugal joined the European Community (EC) in 1986, the United
States feared that a result of this change might be a shift in demand for agricultural products by
4. Given the following table showing possible terms of trade for country I and country I’s
corresponding demand for imports of good Y at each terms of trade:
possible terms I’s quantity demanded
of trade of imports of Y
(c) 1X:3Y or PX/PY = 3 69 units
Calculate the supply of exports of good X by country I at each terms of trade and plot the
resulting offer curve. What is the nature of the elasticity of demand for imports between [i]
5. Given the following indexes for country I in 2015, with 2010 = 100:
price of exports = 108 quantity of exports = 116
price of imports = 120 quantity of imports = 102
6. “If we observe that a home country’s volume and terms of trade are both moving
in the same direction (i.e., either both increasing or both decreasing), then we can
surmise that the home country’s offer curve is shifting. However, if we observe
that the home country’s volume and terms of trade are moving in opposite
directions (i.e., one is increasing and the other is decreasing), then we can surmise
that the foreign offer curve is shifting.”
Is this statement correct or incorrect? Illustrate and explain your answer. (Assume
7. (a) Define the “offer curve” (or “reciprocal demand curve”) of a country. If an offer
curve is drawn as an upward-sloping curve, what is being assumed about the value of the
country’s elasticity of demand for imports and why does this assumption yield the
upward-sloping curve?
69
initial equilibrium position, one country now experiences an increase in productivity in
its export industry at the same time that the other country imposes an import tariff. Illustrate
and explain the combined or overall impact of these two events on the equilibrium terms
of trade and on the quantity traded of each of the two goods. If a combined impact is
uncertain, briefly indicate why it is uncertain.
8. (a) Define the theoretical concept of a country’s “offer curve” (or “reciprocal demand
curve”). Then, using a numerical example, construct three points on a country’s offer
curve, assuming that the country (call it “country A”) exports wheat and imports clothing.
(b) Put the offer curve of country A [you do not need to use your specific numbers from
9. (a) Define the concept of a country’s (call it country A’s) offer curve. Will this curve
always be upward-sloping? Briefly, why or why not?