1
CHAPTER 5
INTRODUCTION TO NEOCLASSICAL TRADE THEORY:
Tools to Be Employed
Learning Objectives:
■ Describe the principles of consumer behavior.
■ Articulate the manner in which producers seek to attain productive efficiency.
■ Outline how an economy’s production-possibilities frontier is obtained.
I. Outline
Introduction
The Theory of Consumer Behavior
– Consumer Indifference Curves
– The Budget Constraint
– Consumer Equilibrium
Production Theory
Summary
II. Special Chapter Features
Titans of International Economics: Francis Ysidro Edgeworth (1845-1926)
In the Real World: Consumer Expenditure Patterns in the United States
III. Purpose of Chapter
Since neoclassical trade theory at the undergraduate level relies heavily on a few basic
graphical micro tools, we think it useful to gather these tools into one convenient place early in
IV. Teaching Tips
A. In classes where the prerequisite for the international economics course(s) consists only
of introductory economics, some of the tools will be new and this chapter should be required
reading. If intermediate micro is a prerequisite, this chapter can be made optional, but it may
still serve as a worthwhile reference point if difficulty is encountered in later chapters. Even
then, however, the material on community indifference curves is likely to be new to the students.
B. Our less-than-complete discussion of relative factor intensity of production processes can
be given more precision in class here rather than waiting until that material is more fully
developed in Chapter 8.
D. The material on the derivation of the PPF from the Edgeworth box at the end of the
chapter seems particularly useful to us when we teach the course, and we recommend that special
emphasis be put upon it. This material is helpful for the later discussion in Chapter 8 of the
Heckscher-Ohlin trade pattern when using the physical definition of factor abundance.
V. Answers to End-of-Chapter Questions and Problems
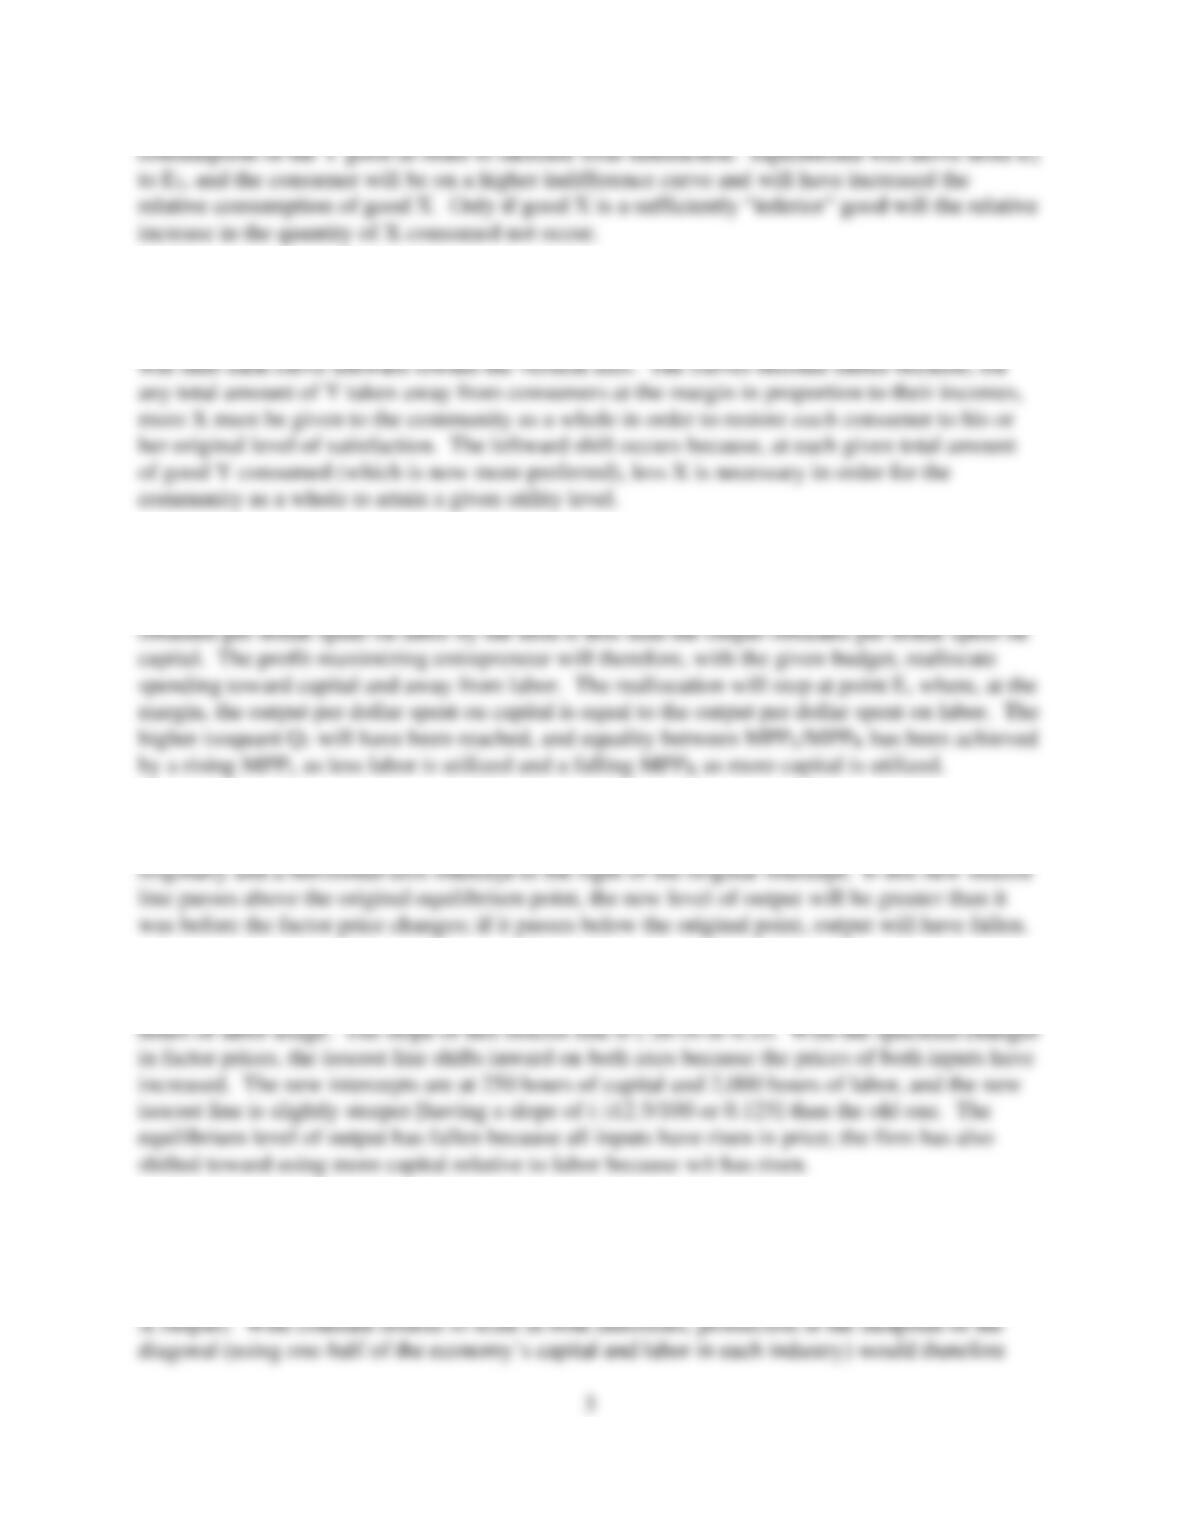
1. In the graph below,
the initial equilibrium is at point E1 with relative prices (PX/PY)1. If the price of good X falls
while the price of good Y remains constant, then a new flatter price line (PX/PY)2 line emerges
3
consumption of the Y good in order to increase total satisfaction. Equilibrium will move from E1
to E2, and the consumer will be on a higher indifference curve and will have increased the
relative consumption of good X. Only if good X is a sufficiently “inferior” good will the relative
increase in the quantity of X consumed not occur.
2. Consider an indifference curve diagram such as Figure 3 in the text. A shift in the
income distribution toward consumers with a relatively stronger preference for good Y than in
the original distribution (the distribution with the solid lines) will make each curve “flatter” and
3. In Figure 8 in the text, consider the lower intersection point (not labeled) of isoquant Q0
with budget line B1. At that point, MPPL/MPPK is less than w/r because the isoquant is flatter
than the isocost line. This indicates that MPPL/w < MPPK/r, or that, at the margin, the output
4. No, it cannot be unambiguously determined. With capital on the vertical axis and labor
on the horizontal axis, the new flatter isocost line will have a vertical-axis intercept lower than
5. With labor on the horizontal axis and capital on the vertical axis, the original isocost line
has a vertical-axis intercept of 300 hours of capital usage and a horizontal-axis intercept of 3,000
6. The PPF would exhibit constant opportunity costs. Suppose that the employment of all
of the economy’s capital and labor in the X industry (an endpoint of the Edgeworth box
diagonal) yields 100 units of X output (and 0 units of Y output). Alternatively, suppose that
employment of all capital and labor in the Y industry yields 200 units of Y output (and 0 units of
4
7. This statement is incorrect. The discussion in the text regarding the production-
possibilities frontier indicates that a PPF with increasing opportunity costs emerges when
8. The country is producing less of the capital-intensive good and more of the labor-
intensive good. The overall demand for labor would rise and the overall demand for capital
would fall as the industry with the higher K/L ratio (lower L/K ratio), industry Y, contracts,
9. The Edgeworth box would become “taller” because the vertical capital axes become
longer and the horizontal labor axes stay the same length. The PPF will also become “taller”
10. If the price of labor rises with no change in the price or rental rate of capital, w/r
increases (r/w decreases). Producers in both industries would respond by using relatively less
labor and relatively more capital, and the K/L ratio would rise in both industries. Note that, in
VI. Sample Exam Questions
A.
E
Es
ss
sa
ay
y
Q
Qu
ue
es
st
ti
io
on
ns
s
1. Suppose that, from an initial individual consumer equilibrium position in the indifference
curve-budget line diagram, the prices of both goods rise by 10 percent. What happens to the
2. Suppose that, from an initial individual consumer equilibrium position in the indifference
curve-budget line diagram, the price of good X rises while the price of good Y falls. What will
happen to the relative consumption of the two goods by the consumer and why? Can it be
3. “If constant returns to scale exist for a firm, then a 10 percent rise in all factor
prices will lead to a 10 percent decline in the equilibrium quantity of output for a
4. Explain, using the isoquant-isocost diagram, why a rise in the rental rate of capital
6. The textbook has developed the Edgeworth box diagram and the concept of the
production efficiency locus or contract curve in the context of the production of two goods with