
Assumptions Value
Share price, P1
12.00$
Share price, P2
15.00$
Dividend paid, D2
–$
a. If the company paid no dividend (plugging zero in for the dividend):
Problem 4.1 Emaline Returns
If the share price of Emaline, a New Orleans-based shipping firm, rises from
$12 to $15 over a one-year period, what is the rate of return to the
shareholder if the following:
a. The company paid no dividends
b. The company paid a dividend of $1 per share
c. The company paid the dividend. The total return to the shareholder is
separated into the dividend yield and the capital gain
Assumptions Value
12.00$
Share Exchange Rate
Assumptions Price (US$/€)
a. If Spencer sold his shares today, what is the percentage change in the share price he would receive?
b. What has been the percentage change in the value of euro versus the dollar over this same period?
c. What would be the total return Spencer would earn on his shares if he sold them at these rates?
If he sold his shares today, it would yield the following amount in euros:
€ 2,833.00
These euros would in turn be worth the following in US dollars:
$4,014.36
€ 1,725.00
$2,346.00
Problem 4.2 Vaniteux’s Returns (A)
Spencer Grant is a New York-based investor. He has been closely following his investment in 100 shares of
Vaniteux, a French firm that went public in February of 2010. When he purchased his 100 shares at €17.25
per share, the euro was trading at $1.360/€. Currently, the share is trading at €28.33 per share, and the dollar
has fallen to $1.4170/€.
a. If Spencer sells his shares today, what percentage change in the share price would he receive?
b. What is the percentage change in the value of euro versus the dollar over this same period?
c. What would be the total return Spencer would earn on his shares if he sold them at these rates?

Share Exchange Rate
Assumptions Price (US$/Euro)
Prices when Spencer purchased his shares
17.25 1.3600
a. If Spencer sold his shares today, what is the percentage change in the share price he would receive?
b. What has been the percentage change in the value of euro versus the dollar over this same period?
results in a negative percentage change in the value of the euro, and therefore a negative percentage change.
c. What would be the total return Spencer would earn on his shares if he sold them at these rates?
If he sold his shares today, it would yield the following amount in euros:
3,114.00
These euros would in turn be worth the following in U.S. dollars:
$4,082.45
$2,346.00
Vaniteux at the original price, and then finding what that amount would have been in U.S. dollars.
compound rate of return of the change in the share price and the change in the value of the euro.
Problem 4.3 Vaniteux’s Returns (B)
gain, resulting in nearly the identical same total return as in the previous problem.
Spencer Grant chooses not to sell his shares at the time described in problem 3. He waits, expecting the share
price to rise further after the announcement of quarterly earnings. His expectations prove correct; the share
price rises to €31.14 per share after the announcement. He now wishes to recalculate his returns. The current
spot exchange rate is $1.3110/€.
31.14 1.3110
Share Exchange Rate
Assumptions Price (US$/Euro)
Prices when Spencer purchased his shares
17.25 1.3600
Using the same prices and exchange rates as in problem 4, Vaniteux (B), what would be the total return on the
Vaniteux investment by Laurent Vuagnoux, a Paris-based investor?
Problem 4.4 Vaniteux’s Returns ( C )
31.14 1.3110
Closing If Shareholder Shareholder
Share Dividend Return Return
Date Price Paid (without Div) (with Div)
1998 (January 2)
131.13$
In January 2003, Microsoft announced that it would begin paying a dividend of $0.16 per share. Given the following share prices
for Microsoft stock in the recent past, how would a constant dividend of $0.16 per share per year have changed the company’s
average annual return to its shareholders over this period?
Problem 4.5 Microsoft’s dividend

Problem 4.6 Carty’s Choices
Assumptions Value
Share price, P1
59.00$
Brian Carty, a prominent investor, is evaluating investment alternatives.
If he believes an individual equity will rise in price from $59 to $71 in
the coming one-year period, and the share is expected to pay a dividend
of $1.75 per share, and he expects at least a 15% rate of return on an
investment of this type, should he invest in this particular equity?
71.00$

Market Total
Number value Market
Company P/E ratio of shares per share Earnings EPS Value
a. How many shares would Modern American have outstanding after the acquisition of ModoUnico?
b. What would be the consolidated earnings of the combined Modern American and ModoUnico?
ModoUnico earnings + Modern American earnings 20,000,000$
P/E x Consolidated earnings = 40 x $20,000,000 800,000,000$
d. What is the new earnings per share of Modern American?
$20,000,000 / 15,500,000 shares 1.29$
e. What is the new market value of a share of Modern American?
New market value / Total shares outstanding = $800,000,000 / 15,500,000 51.61$
f. How much did Modern American’s stock price increase?
Share price rose from $40.00 to $51.61. 11.61$
Percentage increase 29.03%
g. Assume that the market takes a negative view of the acquisition and lowers Modern American’s P/E ratio to 30.
What would be the new market price per share of stock? What would be its percentage loss?
New market value = Total earnings x P/E = $20,000,000 x 30 600,000,000$
New market price per share = total market value / shares outstanding = 38.71$
Percentage loss to original Modern American shareholders = ($38.71 – $40.00)/ ($40.00) -3.23%
c. Assuming the market continues to capitalize Modern American’s earnings at a P/E ratio of 40, what would be the new market
value of Modern American?
During the 1960s, many conglomerates were created by a firm enjoying a high price/earnings ratio (P/E). They then used their highly–valued
stock to acquire other firms that had lower P/E ratios, usually in unrelated domestic industries. These conglomerates went out of fashion
during the 1980s when they lost their high P/E ratios, thus making it more difficult to find other firms with lower P/E ratios to acquire.
During the 1990s, the same acquisition strategy was possible for firms located in countries where high P/E ratios were common compared to
firms in other countries where low P/E ratios were common. Consider the hypothetical firms in the pharmaceutical industry shown in the
following table:
Problem 4.7 Fashion Acquisitions
Modern American 40 10,000,000 40.00$ 10,000,000$ 1.00$ 400,000,000$

Problem 4.8 Corporate Governance: Overstating Earnings
Market Total
Number value Market
Company P/E ratio of shares per share Earnings EPS Value
If earnings were lowered to $5 million from the previously reported $10 million, could Modern American still do the deal?
To do the deal, Modo Unico’s shareholders need to be paid their market value plus a 10% premium, or 220,000,000$
At new market rates for Modern American, this would require the offer of ($220 million/$20 per share) 11,000,000
A number of firms, especially in the United States, have had to lower their previously reported earnings due to accounting errors or fraud.
Assume that ModernAmerican (problem 7) had to lower its earnings to $5,000,000 from the previously reported $10,000,000. What
might be its new market value prior to the acquisition? Could it still do the acquisition?
Modo Unico 20 10,000,000 20.00$ 10,000,000$ 1.00$ 200,000,000$
Modern American 40 10,000,000 20.00$ 5,000,000$ 1.00$ 200,000,000$
Local Currency
Yehti Manufacturing (millions) Votes per share Total Votes
Long-term debt 200
Total long-term capital 1,000 1,400
a. What proportion of the total long-term capital has been raised by A-shares?
A-shares / Total long-term capital 100 / 1,000 10.00%
b. What proportion of voting rights is represented by A-shares?
A-share total votes / Total Votes 1,000 / 1,400 71.43%
c. What proportion of the dividends should the A-shares receive?
A-shares in local currency / Total equity shares in local currency 100 / (100 + 400) 20.00%
Dual classes of common stock are common in a number of countries. Assume that Yehti Manufacturing has the following
capital structure at book value. The A-shares each have ten votes and the B-shares each have one vote per share.
Problem 4.9 Yehti Manufacturing (A)
Retained earnings 300
Paid-in common stock: 1 million A-shares 100 10.00 1,000
Paid-in common stock: 4 million B-shares 400 1.00 400
Local Currency
Yehti Manufacturing (millions) Votes per share Total Votes
Long-term debt 200
a. What proportion of the total long-term capital has been raised by A-shares?
A-shares / Total long-term capital 100 / 1,000 10.00%
b. What proportion of voting rights is represented by A-shares?
A-share total votes / Total Votes 100 / 500 20.00%
c. What proportion of the dividends should the A-shares receive?
A-shares in local currency / Total equity shares in local currency 100 / (100 + 400) 20.00%
Assuming all of the same debt and equity values for Yehti Manufacturing in problem 9, with the sole exception that both A-
shares and B-shares have the same voting rights, one vote per share:
Problem 4.10 Yehti Manufacturing (B)
Retained earnings 300
Paid-in common stock: 1 million A-shares 100 1.00 100
Paid-in common stock: 4 million B-shares 400 1.00 400
Total long-term capital 1,000 500
2010 2011 2012
Total net sales, HK$ 171,275 187,500 244,900
Analysis of European Sales 2010 2011 2012
Total net sales, HK$ 171,275 187,500 244,900
Percent of total sales from Europe 48% 44% 39%
Total European sales, HK$ 82,212 82,500 95,511
Growth rate of European sales -1.7% 31.1%
euros at the average exchange rate of HK$/E each year, actual European sales first shrunk in 2011, then grew in 2012.
All things considered, sales in 2012 did increase when compared with sales in 2008.
Problem 4.11 Lantau Beer (A): European Sales
Lantau Beer is a Hong Kong-based brewery and files all of its financial statements in Hong Kong dollars (HK$). The
company’s European sales director, Phillipp Bosse, has been criticized for his performance. He disagrees, arguing that
sales in Europe have grown steadily in recent years. Who is correct?
Percent of total sales from Europe 48% 44% 39%
Total European sales, HK$ ________ ________ ________
Growth rate of European sales ________ ________ ________

Analysis of Japanese yen-Denominated Debt 2008 2009 2010
Annual yen payments on debt agreement (¥) 12,000,000 12,000,000 12,000,000
Problem 4.12 Lantau Beer (B): Japanese Yen Debt
Lantau Beer of Hong Kong borrowed Japanese yen under a long-term loan agreement several years ago. The company‘s
new CFO believes, however, that what was originally thought to have been relatively “cheap debt” is no longer true.
What do you think?
Average exchange rate, ¥/HK$ 12.3 12.1 11.4
Annual yen debt service, HK$ 977,199 994,200 1,057,269
2001 2002 2003 2004
(thousands of US$) Sales ($) Sales ($) Sales ($) Sales ($)
Europe 933,450$ 1,126,177$ 1,356,131$ 1,410,525$
a. What was the percentage change in sales, in US dollars, by region?
b. What was the percentage change in sales by region net of currency change impacts?
c. What was the actual US dollar sales levels, by region, net of currency changes?
Mattel’s Global Sales
Mattel (US) achieved significant sales growth in its major international regions between 2001 and 2004. In its
filings with the United States Security and Exchange Commission (SEC), it reported what percentage change
in regional sales occurred as a result of exchange rate changes.
d. What relative impact did currency changes have on the level and growth of Mattel’s consolidated sales for the
2001 to 2004 period?
Mattel’s Global Sales
Latin America 471,301 466,349 462,167 524,481
Asia Pacific 119,749 136,944 171,580 203,575
Total International 1,680,291$ 1,890,939$ 2,175,709$ 2,336,236$
United States 3,392,284 3,422,405 3,203,814 3,209,862
Sales Adjustments (384,651) (428,004) (419,423) (443,312)
Total Net Sales 4,687,924$ 4,885,340$ 4,960,100$ 5,102,786$
Latin America -9.0% -6.0% -2.0%
Asia Pacific 3.0% 13.0% 6.0%
Answer to a) Answer to b)
(1) (2) (3)
Percent Impact of Net
2001 2002 Change in Change in Change in
(thousands of US$) Sales ($) Sales ($) Gross Sales Currency Rates Sales
Europe 933,450$ 1,126,177$ 20.6% 7.0% 13.6%
(1) (2) (3)
Percent Impact of Net
2002 2003 Change in Change in Change in
(thousands of US$) Sales ($) Sales ($) Gross Sales Currency Rates Sales
Europe 1,126,177$ 1,356,131$ 20.4% 15.0% 5.4%
Latin America 466,349 462,167 -0.9% -6.0% 5.1%
Asia Pacific 136,944 171,580 25.3% 13.0% 12.3%
Total International 1,890,939$ 2,175,709$ 15.1%
United States 3,422,405 3,203,814 -6.4%
Sales Adjustments (428,004) (419,423) -2.0%
Total Net Sales 4,885,340$ 4,960,100$ 1.5%
(1) (2) (3)
Percent Impact of Net
2003 2004 Change in Change in Change in
(thousands of US$) Sales ($) Sales ($) Gross Sales Currency Rates Sales
Europe 1,356,131$ 1,410,525$ 4.0% 8.0% -4.0%
Latin America 462,167 524,481 13.5% -2.0% 15.5%
Asia Pacific 171,580 203,575 18.6% 6.0% 12.6%
Total International 2,175,709$ 2,336,236$ 7.4%
United States 3,203,814 3,209,862 0.2%
Sales Adjustments (419,423) (443,312) 5.7%
Total Net Sales 4,960,100$ 5,102,786$ 2.9%
Over the 2001 to 2004 period, Mattel benefited greatly from the change in exchange rates. Only in the case of Latin America,
where exchange rate changes were actually negative in impact on sales levels for the entire period, did the exchange rate
changes not positively impact regional sales.
Mattel (U.S.) achieved significant sales growth in its major international regions between 2001 and 2004. In its filings with the
United States Security and Exchange Commission (SEC), it reported what percentage change in regional sales occurred as a
result of exchange rate changes.
Problem 4.13 Mattel’s Global Sales Performance
Latin America 471,301 466,349 -1.1% -9.0% 7.9%
Asia Pacific 119,749 136,944 14.4% 3.0% 11.4%
Total International 1,680,291$ 1,890,939$ 12.5%
United States 3,392,284 3,422,405 0.9%
Sales Adjustments (384,651) (428,004) 11.3%
Total Net Sales 4,687,924$ 4,885,340$ 4.2%
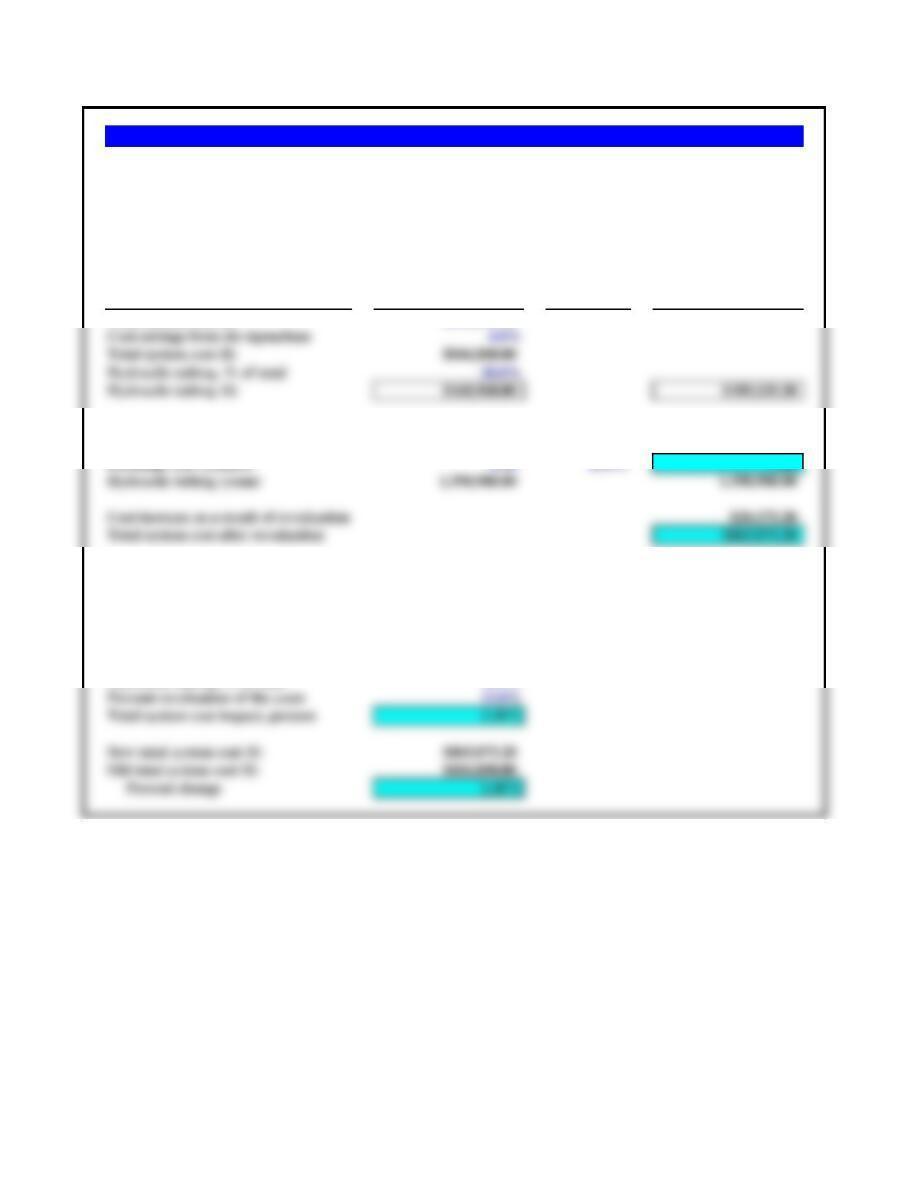
Assumptions Original/Current Revaluation? Future?
Total system cost ($) $880,000.00
A 12% revaluation of the yuan would be calculated: Yuan 8.28 / (1 + % change)
Exchange rate (yuan/$) 8.28 12.0% 7.39
Hydraulic tubing (yuan) 1,398,988.80 1,398,988.80
Cost increase as a result of revaluation $20,275.20
Total system cost after revaluation $865,075.20
Hydraulic tubing, % of total 20.0%
Percent revaluation of the yuan 12.0%
Total system cost impact, percent 2.40%
New total system cost ($) $865,075.20
Old total system cost ($) $844,800.00
Percent change 2.40%
Harrison Equipment of Denver, Colorado purchases all of its hydraulic tubing from manufacturers in mainland China.
The company has recently completed a corporate-wide initiative in six sigma/lean manufacturing. Completed oil field
hydraulic system costs were reduced 4% over a one-year period, from $880,000 to $844,800. The company is now
worried that all of the hydraulic tubing that goes into the systems (making up 20% of their total costs) will be hit by
the potential revaluation of the Chinese yuan — if some in Washington get their way. How would a 12% revaluation
of the yuan against the dollar impact total system costs?
a. The revaluation of the Chinese yuan by 12% would completely nullify all of the cost reduction benefits achieved
via the six sigma/lean manufacturing initiatives recently completed.
b. The percentage change in the cost of the total hydraulic system can be calculated by multiplying the percentage
increase in the exchange rate times the percent of total cost made up by the hydraulic tubing:
Problem 4.14 Chinese Sourcing and the Yuan
Cost savings from six sigma/lean 4.0%
Total system cost ($) $844,800.00
Hydraulic tubing, % of total 20.0%
Hydraulic tubing ($) $168,960.00 $189,235.20
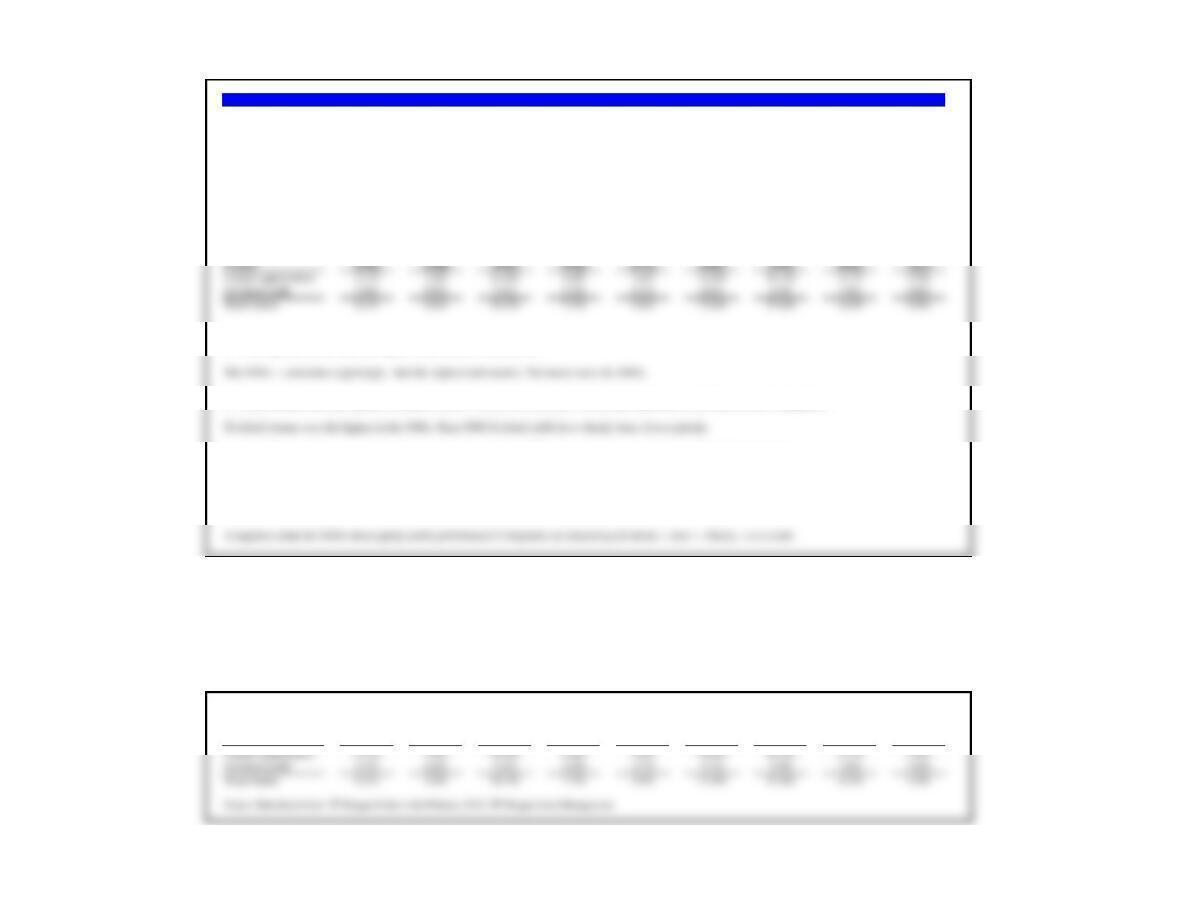
a. Which period shown had the highest total returns? The lowest?
b. Which decade had the highest dividend returns? When were dividends clearly not a priority for publicly traded companies?
c. The 1990s was a boom period for U.S. equity returns. How did firm’s react in terms of their dividend distributions?
d. How has the 2000s period fared? How do you think publicly traded companies have started changing their dividend distribution habits as a result?
S&P 500 Equity Returns, 1926-2014 (average annual return, percent)
1926 to
a. Which period shown had the highest total returns? The lowest?
b. Which decade had the highest dividend returns? When were dividends clearly not a priority for publicly traded companies?
c. The 1990s was a boom period for U.S. equity returns. How did firm‘s react in terms of their dividend distributions?
Dividend distributions/yields were clearly down during this era.
d. How has the 2000s period fared? How do you think publicly traded companies have started changing their dividend distribution habits as a result?
S&P 500 Equity Returns, 1926-2014 (average annual return, percent)
1926 to
Period 1930s 1940s 1950s 1960s 1970s 1980s 1990s 2000s 2014
Problem 4.15 S&P 500 Equity Returns: 1930-2010
The U.S. equity markets have delivered very different returns over the past 90 years. Use the following data arranged by decade to answer the following questions
about these U.S. equity investment returns.
Period 1930s 1940s 1950s 1960s 1970s 1980s 1990s 2000s 2014