
Chapter 3
Labor Productivity and Comparative
Advantage: The Ricardian Model
◼ Chapter Organization
The Concept of Comparative Advantage
A One-Factor Economy
Relative Prices and Supply
Trade in a One-Factor World
Determining the Relative Price after Trade
Box: Comparative Advantage in Practice: The Case of Babe Ruth
The Gains from Trade
A Note on Relative Wages
Box: The Losses from Nontrade
Misconceptions about Comparative Advantage
Productivity and Competitiveness
Box: Do Wages Reflect Productivity?
The Pauper Labor Argument
Exploitation
Comparative Advantage with Many Goods
Setting Up the Model
Relative Wages and Specialization
Determining the Relative Wage in the Multigood Model
Adding Transport Costs and Nontraded Goods
Empirical Evidence on the Ricardian Model
Summary
8 Krugman/Obstfeld/Melitz • International Economics: Theory & Policy, Tenth Edition
◼ Chapter Overview
The Ricardian model provides an introduction to international trade theory. This most basic model of
trade involves two countries, two goods, and one factor of production, labor. Differences in relative labor
productivity across countries give rise to international trade. This Ricardian model, simple as it is, generates
important insights concerning comparative advantage and the gains from trade. These insights are necessary
foundations for the more complex models presented in later chapters.
The text exposition begins with the examination of the production possibility frontier and the relative prices
of goods for one country. The production possibility frontier is linear because of the assumption of constant
returns to scale for labor, the sole factor of production. The opportunity cost of one good in terms of the other
equals the price ratio because prices equal costs, costs equal unit labor requirements times wages, and
wages are equal in each industry.
After defining these concepts for a single country, a second country is introduced that has different relative
unit labor requirements. Supply and demand curves relative to general equilibrium are developed. This
analysis demonstrates that at least one country will specialize in production. The gains from trade are then
demonstrated with a graph and a numerical example. The intuition of indirect production, that is
“producing” a good by producing the good for which a country enjoys a comparative advantage and then
trading for the other good, is an appealing concept to emphasize when presenting the gains from trade
argument. Students are able to apply the Ricardian theory of comparative advantage to analyze three
misconceptions about the advantages of free trade. Each of the three “myths” represents a common
argument against free trade, and the flaws of each can be demonstrated in the context of examples already
Although the initial intuitions are developed in the context of a two-good model, it is straightforward to
extend the model to describe trade patterns when there are N goods. Comparative advantage in this model is
driven by relative wages between countries rather than relative prices. However, the implication that
countries will export goods for which they have the lowest opportunity cost remains.
The N-good model is used to discuss the role that transport costs play in making some goods nontraded.
As transport costs rise, the gains from trade decrease, and in some cases they are completely eliminated.
The chapter ends with a discussion of empirical evidence of the Ricardian model. The authors are careful
to point out that, while the rather simplified model cannot explain all trade patterns, the basic prediction that
countries tend to export goods for which they have a comparative advantage (high relative productivity)
has been confirmed by a number of studies.
Chapter 3 Labor Productivity and Comparative Advantage: The Ricardian Model 9
◼ Answers to Textbook Problems
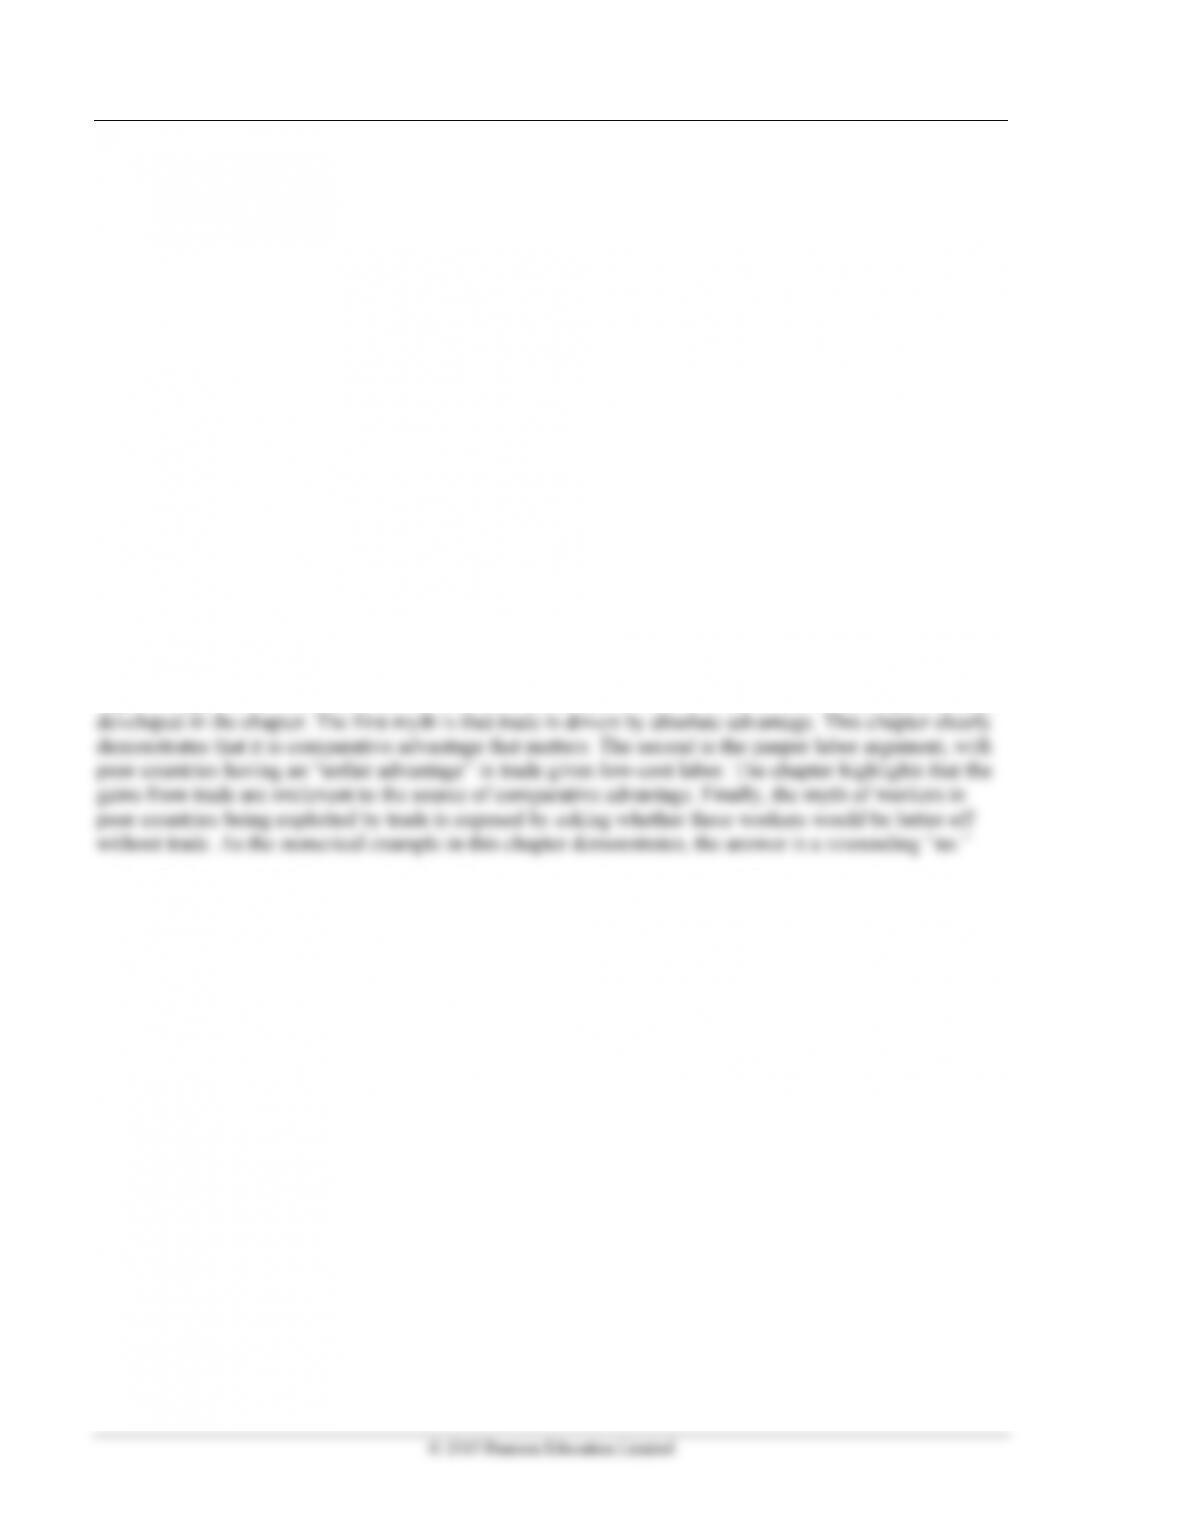
1. a. The production possibility curve is a straight line that intercepts the apple axis at 400 (1,200/3)
and the banana axis at 600 (1,200/2).
b. The opportunity cost of apples in terms of bananas is 3/2. It takes 3 units of labor to harvest an
apple but only 2 units of labor to harvest a banana. If one forgoes harvesting an apple, this frees
up 3 units of labor. These 3 units of labor could then be used to harvest 1.5 bananas.
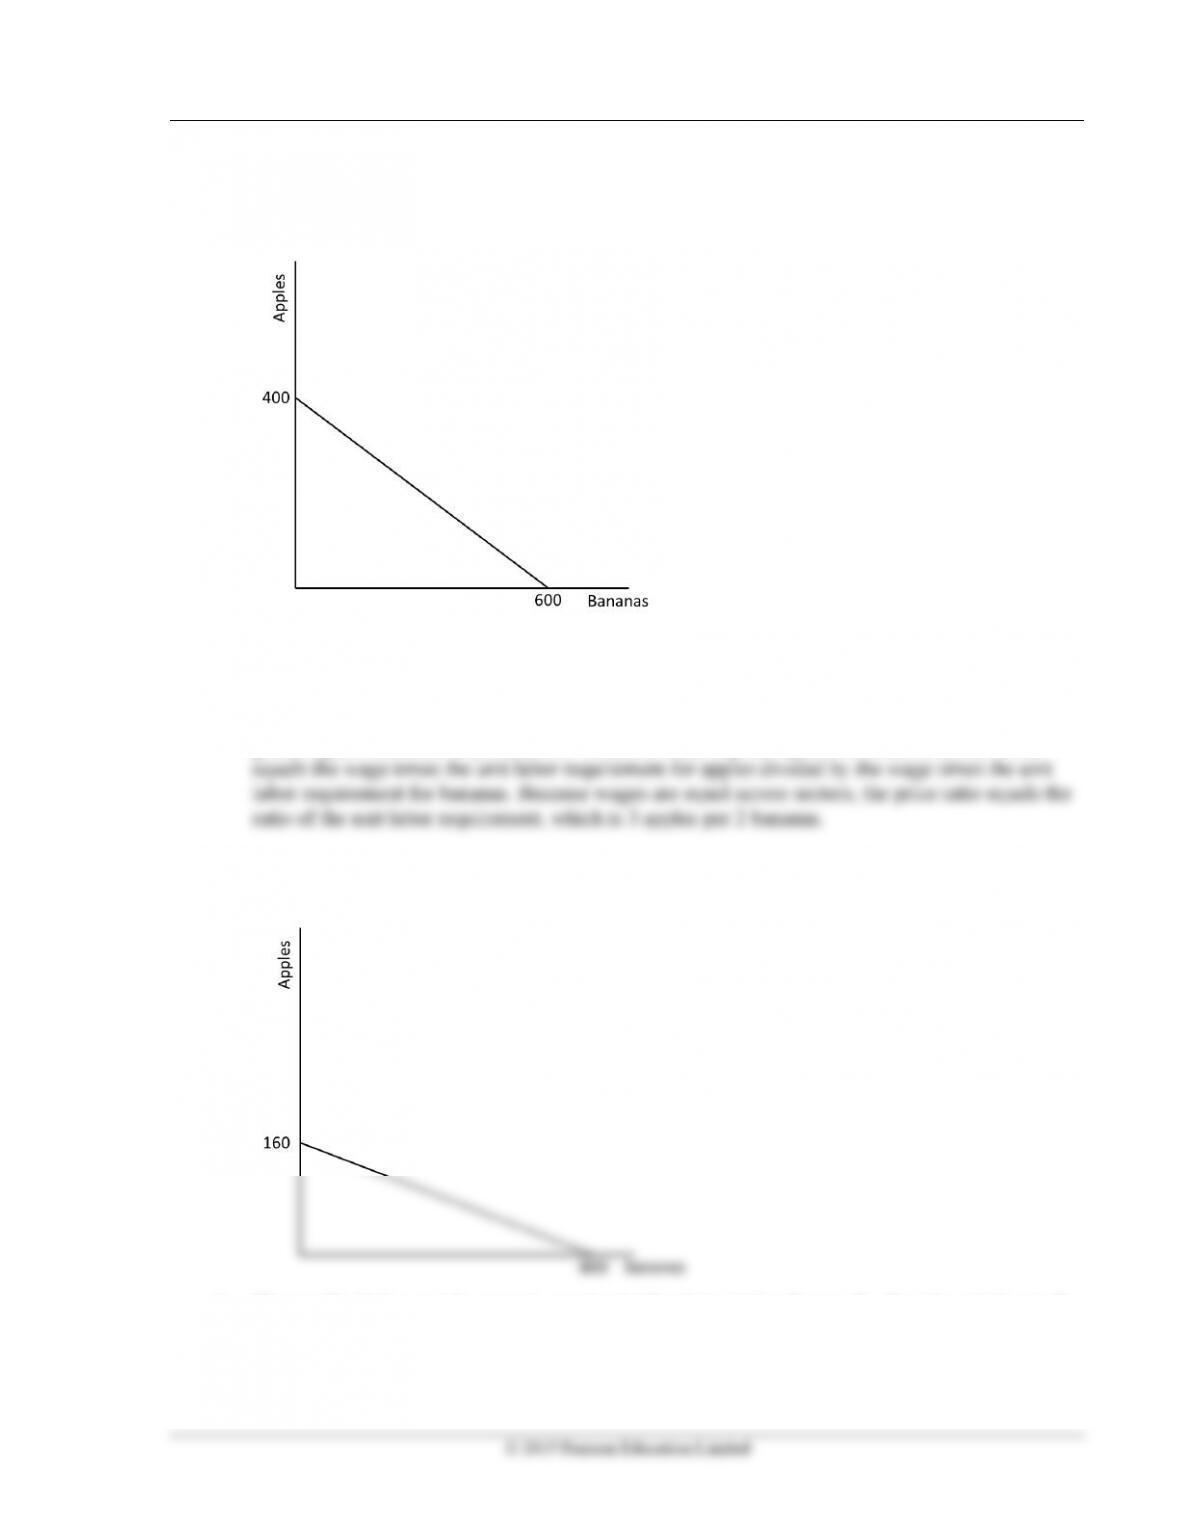
c. Labor mobility ensures a common wage in each sector, and competition ensures the price of
goods equals their cost of production. Thus, the relative price equals the relative costs, which
2. a. The production possibility curve is linear, with the intercept on the apple axis equal to 160 (800/5)
and the intercept on the banana axis equal to 800 (800/1).
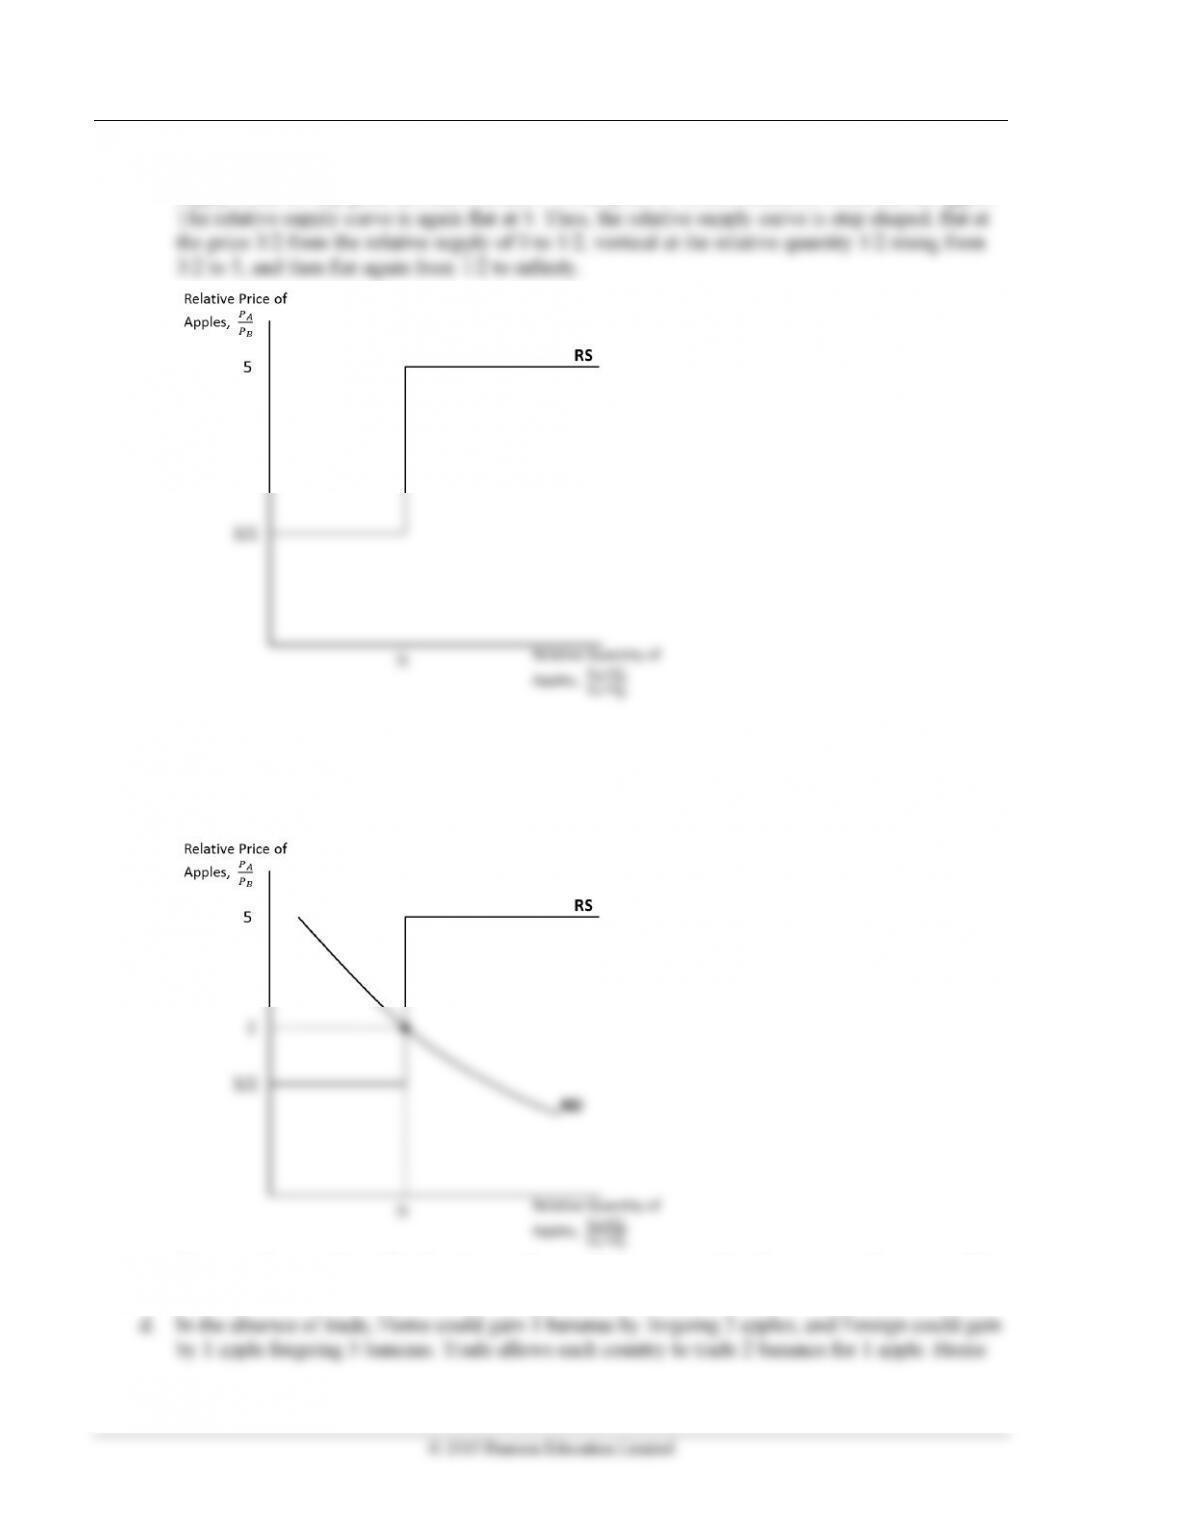
b. The world relative supply curve is constructed by determining the supply of apples relative to the
supply of bananas at each relative price. The lowest relative price at which apples are harvested is
3 apples per 2 bananas. The relative supply curve is flat at this price. The maximum number of
apples supplied at the price of 3/2 is 400 supplied by Home while, at this price, Foreign harvests
10 Krugman/Obstfeld/Melitz • International Economics: Theory & Policy, Tenth Edition
800 bananas and no apples, giving a maximum relative supply at this price of 1/2. This relative
supply holds for any price between 3/2 and 5. At the price of 5, both countries would harvest apples.
3. a. The relative demand curve includes the points (1/5, 5), (1/2, 2), (2/3, 3/2), (1, 1), (2, 1/2).
b. The equilibrium relative price of apples is found at the intersection of the relative demand and
relative supply curves. This is the point (1/2, 2), where the relative demand curve intersects the
vertical section of the relative supply curve. Thus, the equilibrium relative price is 2.
c. Home produces only apples, Foreign produces only bananas, and each country trades some of its
product for the product of the other country.
Chapter 3 Labor Productivity and Comparative Advantage: The Ricardian Model 11
could then gain 4 bananas by forgoing 2 apples, while Foreign could gain 1 apple by forgoing
only 2 bananas. Each country is better off with trade.
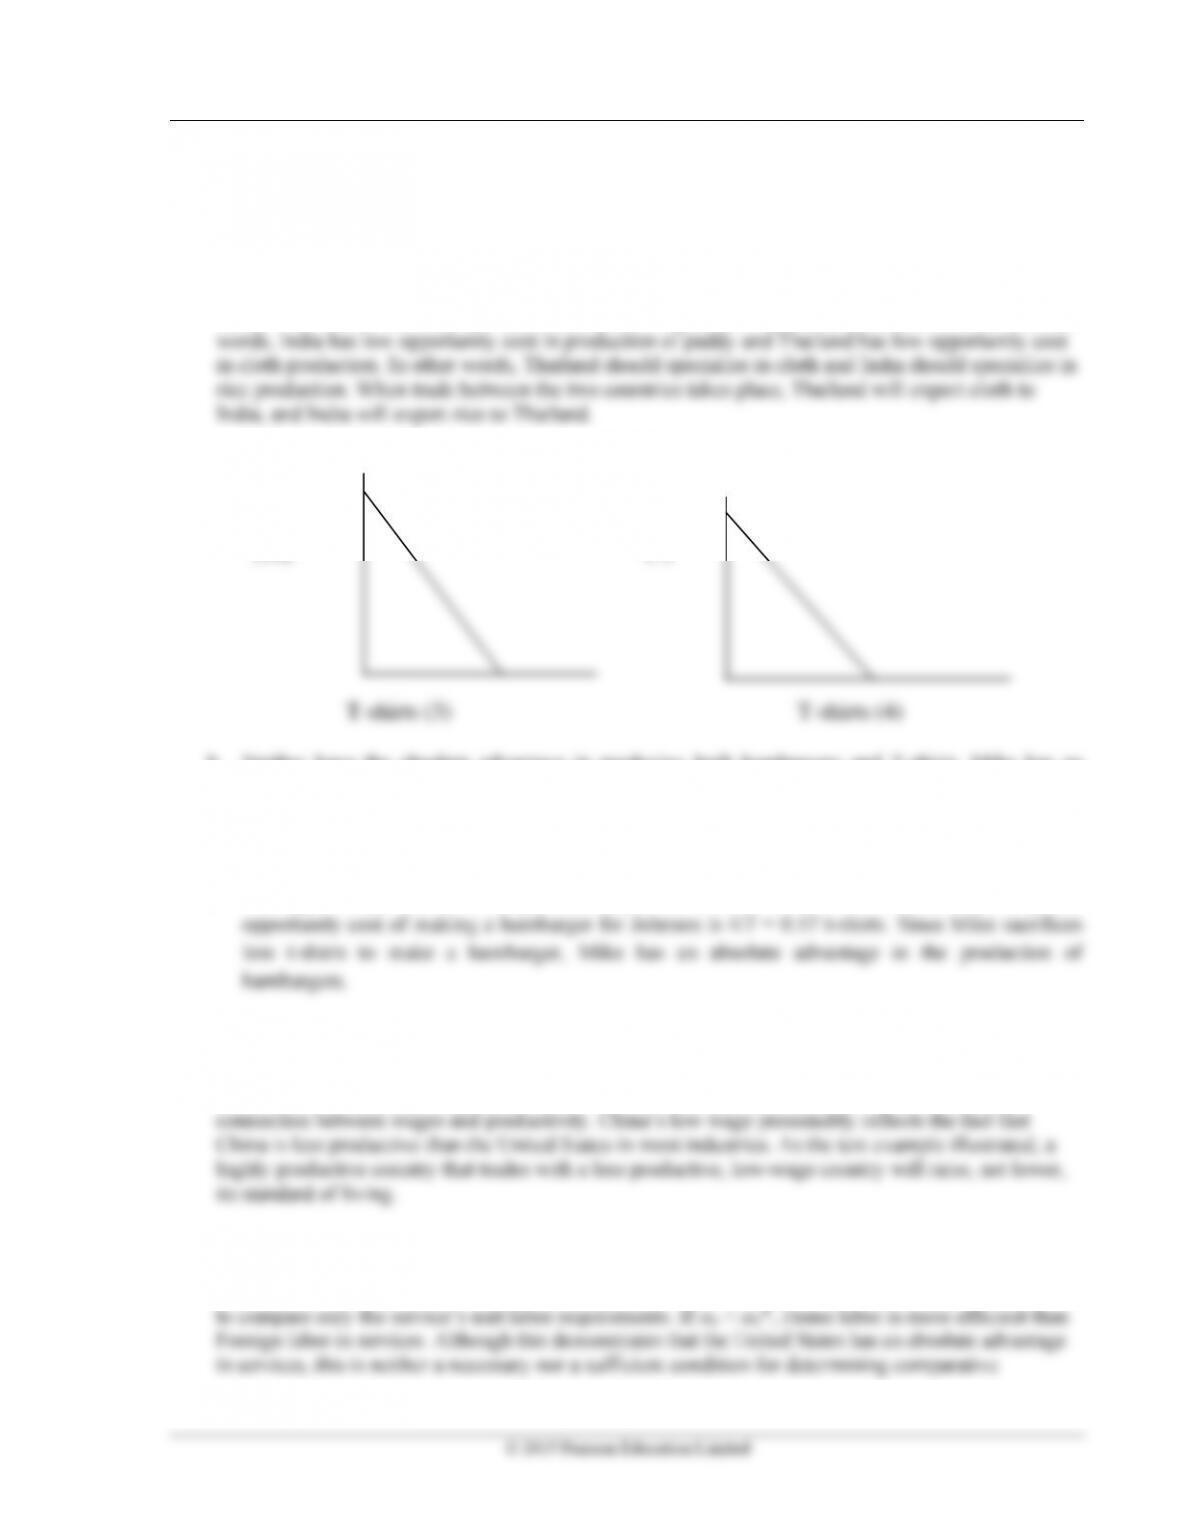
4. For India, the cost of producing one meter of cloth is 2 Kg of Paddy (i.e. 10/5). The opportunity cost
of cloth in India is 10/5 (rice). In other words, India has to sacrifice 2 kg of rice to produce one meter
of cloth. Similarly, for Thailand the opportunity cost of producing one meter of cloth is 2.5 Kg of
Paddy. This means that Thailand has to sacrifice 2.5 kg of rice to produce one meter of cloth. In other
5. a.
Mike Johnson
Hamburgers Hamburgers
(10) (7)
b. Neither have the absolute advantage in producing both hamburgers and T-shirts. Mike has an
absolute advantage in making hamburgers and Johnson in making T-shirts.
c. The opportunity cost of making a t-shirts for Mike is 10/3 = 3.33 hamburgers. Similarly, the
opportunity cost of making a t-shirts for Johnson is 7/4 = 1.75 hamburgers. Hence, the opportunity
cost of making a t-shirt is higher for Mike.
d. The opportunity cost of making a hamburger for mike is 3/10 = 0.30 t-shirts. Similarly, the
6. This statement is just an example of the pauper labor argument discussed in the chapter. The point is
that relative wage rates do not come out of thin air; they are determined by comparative productivity
and the relative demand for goods. The box in the chapter provides data that shows the strong
7. The problem with this argument is that it does not use all the information needed for determining
comparative advantage in production: This calculation involves the four unit labor requirements
(for both the industry and service sectors, not just the two for the service sector). It is not enough
12 Krugman/Obstfeld/Melitz • International Economics: Theory & Policy, Tenth Edition
advantage. For this determination, the industry ratios are also required. The competitive advantage of
any industry depends on both the relative productivities of the industries and the relative wages across
industries.
8. Although Japanese workers may earn the equivalent wages of U.S. workers, the purchasing power of
their income is one-third less. This implies that although w = w* (more or less), p p* (because 3p =
p*). Because the United States is considerably more productive in services, service prices are
relatively low. This benefits and enhances U.S. purchasing power. However, many of these services
9. Every country has different natural resources. There would be no need for specialization in a product
and engaging in trade if resources were mobile. But in most cases, human and physical resources are
somewhat immobile. In such a situation, the cost differences and comparative advantage in
10. The world relative supply curve in this case consists of a step function, with as many “steps”
(horizontal portions) as there are countries with different unit labor requirement ratios. Any