Australia’s Current Account
Australia’s Current Account
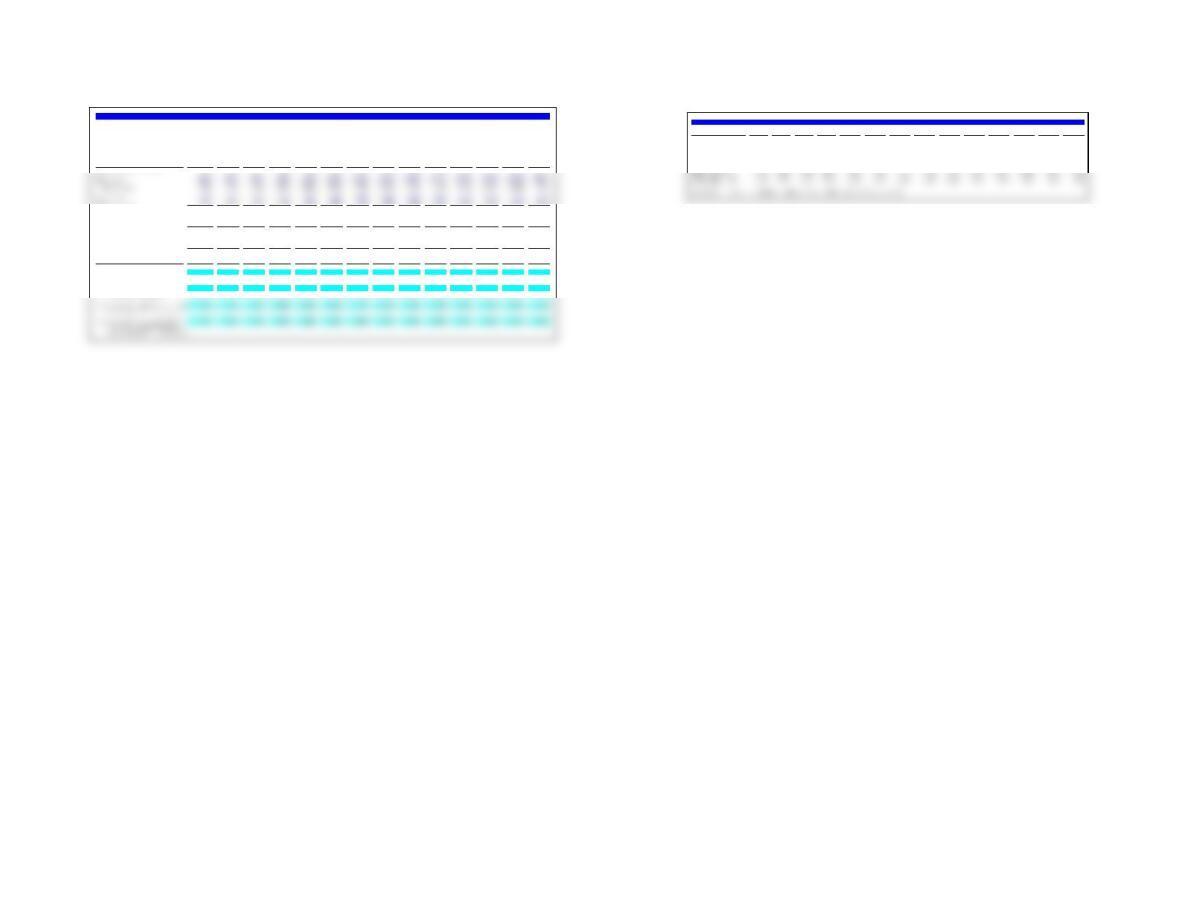
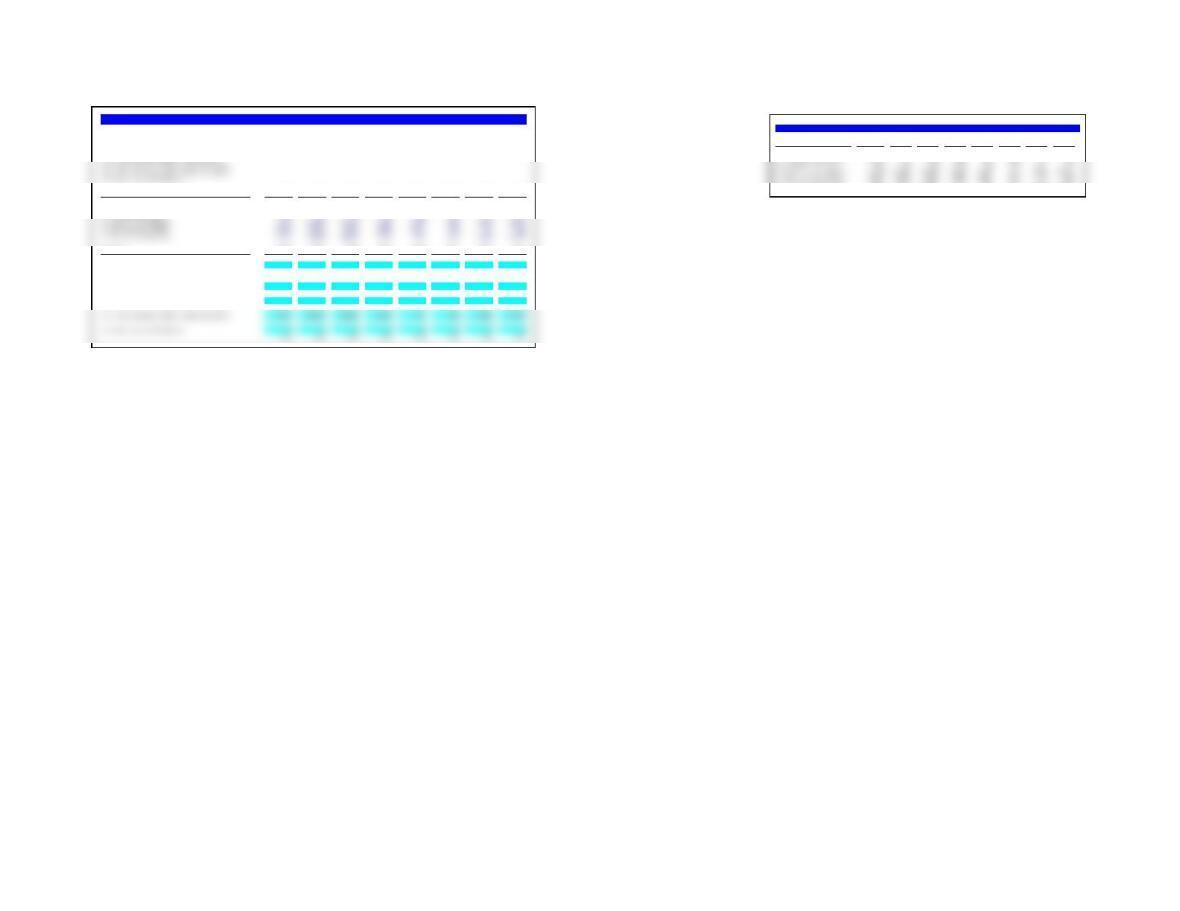
Use the following balance of payments data for Australia from the IMF to answer Problems 3.1–3.4.
Assumptions (million US$) 2000 2001 2002 2003 2004 2005 2006 2007 2008 2009 2010 2011 2012 2013
3.1 What is Australia’s balance on goods?
3.2 What is Australia’s balance on services? Goods, credit (exports) 64,052 63,676 65,099 70,577 87,207 107,011 124,913 142,421 189,057 154,777 213,782 271,719 257,950 254,164
3.3 What is Australia’s balance on goods and services? Goods, debit (imports) -68,865 -61,890 -70,530 -85,946 -105,238 -120,383 -134,509 -160,205 -193,972 -159,216 -196,303 -249,238 -270,136 -249,774
3.4 What is Australia’s current account balance? Services, credit (exports) 18,677 16,689 17,906 21,205 26,362 31,047 33,088 40,496 45,240 40,814 46,968 51,653 53,034 53,344
Services, debit (imports) -18,388 -16,948 -18,107 -21,638 -27,040 -30,505 -32,219 -39,908 -48,338 -42,165 -51,313 -61,897 -65,405 -67,399
Assumptions (millions of US dollars) 2000 2001 2002 2003 2004 2005 2006 2007 2008 2009 2010 2011 2012 2013 Primary income: credit 8,984 8,063 8,194 9,457 13,969 16,445 21,748 32,655 37,320 27,402 35,711 47,852 47,168 45,910
Services: debit -18,388 -16,948 -18,107 -21,638 -27,040 -30,505 -32,219 -39,908 -48,338 -42,165 -51,313 -61,897 -65,405 -67,399
Balance on services 289 -259 -201 -433 -678 542 869 588 -3,098 -1,351 -4,345 -10,244 -12,371 -14,055
Income: credit 8,984 8,063 8,194 9,457 13,969 16,445 21,748 32,655 37,320 27,402 35,711 47,852 47,168 45,910
Income: debit -19,516 -18,332 -19,884 -24,245 -35,057 -44,166 -54,131 -73,202 -76,719 -65,809 -84,646 -102,400 -88,255 -83,618
Balance on income -10,532 -10,269 -11,690 -14,788 -21,088 -27,722 -32,383 -40,547 -39,399 -38,407 -48,935 -54,548 -41,087 -37,708
Current transfers: credit 2,622 2,242 2,310 2,767 3,145 3,333 3,698 4,402 4,431 4,997 5,813 7,510 7,271 7,206
Current transfers: debit -2,669 -2,221 -2,373 -2,851 -3,414 -3,813 -4,092 -4,690 -4,805 -5,799 -7,189 -9,723 9,635 9,390
Balance on current transfers -47 21 -63 -84 -269 -480 -394 -288 -374 -802 -1,376 -2,213 16,906 16,596
Questions 2000 2001 2002 2003 2004 2005 2006 2007 2008 2009 2010 2011 2012 2013
3.1 What is Australia’s balance on goods? -4,813 1,786 -5,431 -15,369 -18,031 -13,372 -9,596 -17,784 -4,915 -4,439 17,479 22,481 -12,186 4,390
(goods exports – goods imports)
3.2 What is Australia’s balance on services? 289 -259 -201 -433 -678 542 869 588 -3,098 -1,351 -4,345 -10,244 -12,371 -14,055
India’s Current Account
India’s Current Account
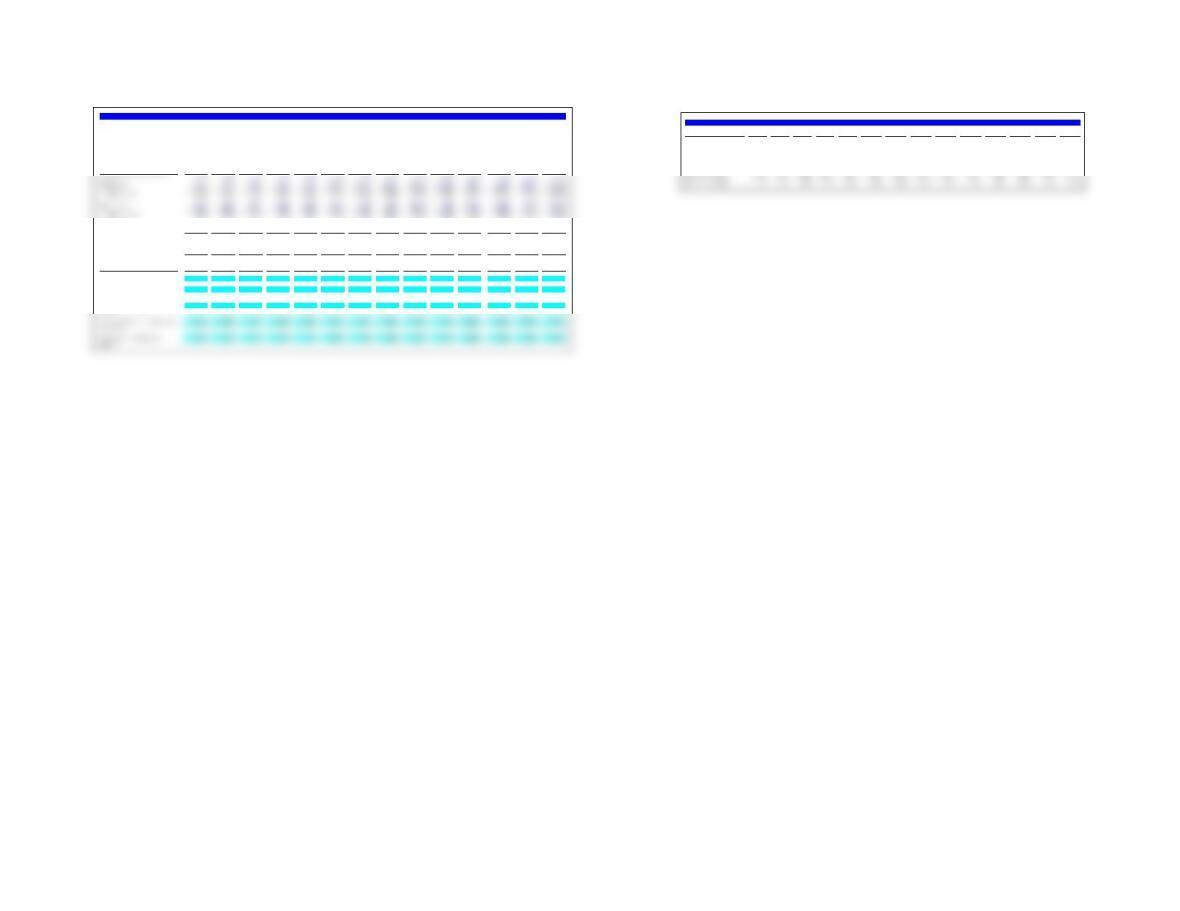
Use the following balance of payments data for India from the IMF to answer Problems 3.5–3.9.
Assumptions (millions of US$) 2000 2001 2002 2003 2004 2005 2006 2007 2008 2009 2010 2011 2012 2013
3.5 What is India’s balance on goods?
3.6 What is India’s balance on services? Goods, credit (exports) 43,247 44,793 51,141 60,893 77,939 102,175 123,876 153,530 199,065 167,958 230,967 307,847 298,321 319,110
3.7 What is India’s balance on goods and services? Goods, debit (imports) -53,887 -51,212 -54,702 -68,081 -95,539 -134,692 -166,572 -208,611 -291,740 -247,908 -324,320 -428,021 -450,249 -433,760
3.8 What is the balance on goods, services and income? Services, credit (exports) 16,684 17,337 19,478 23,902 38,281 52,527 69,440 86,552 106,054 92,889 117,068 138,528 145,525 148,649
3.9 What is India’s current account balance? Services, debit (imports) -19,187 -20,099 -21,039 -24,878 -35,641 -47,287 -58,514 -70,175 -87,739 -80,349 -114,739 -125,041 -129,659 -126,256
Primary income: credit 2,521 3,524 3,188 3,491 4,690 5,646 8,199 12,650 15,593 13,733 9,961 10,147 9,899 11,230
Income: credit 2,521 3,524 3,188 3,491 4,690 5,646 8,199 12,650 15,593 13,733 9,961 10,147 9,899 11,230
Income: debit -7,414 -7,666 -7,097 -8,386 -8,742 -12,296 -14,445 -19,166 -20,958 -21,272 -25,563 -26,191 -30,742 -33,013
Balance on income -4,893 -4,142 -3,909 -4,895 -4,052 -6,650 -6,245 -6,516 -5,365 -7,539 -15,602 -16,044 -20,843 -21,783
Current transfers: credit 13,548 15,140 16,789 22,401 20,615 24,512 30,015 38,885 52,065 50,526 54,380 62,735 68,611 69,441
Current transfers: debit -114 -407 -698 -570 -822 -869 -1,299 -1,742 -3,313 -1,764 -2,270 -2,523 -3,176 -4,626
Balance on current transfers 13,434 14,733 16,091 21,831 19,793 23,643 28,716 37,143 48,752 48,762 52,110 60,212 65,435 64,815
Questions 2000 2001 2002 2003 2004 2005 2006 2007 2008 2009 2010 2011 2012 2013
3.5 What is India’s balance on goods? -10,640 -6,419 -3,561 -7,188 -17,600 -32,517 -42,696 -55,081 -92,675 -79,950 -93,353 -120,174 -151,928 -114,650
3.6 What is India’s balance on services? -2,503 -2,762 -1,561 -976 2,640 5,241 10,926 16,377 18,315 12,540 2,329 13,487 15,866 22,393
-13,143 -9,181 -5,122 -8,164 -14,960 -27,276 -31,770 -38,704 -74,360 -67,410 -91,024 -106,687 -136,062 -92,257
3.8 What is the balance on goods, services
3.9 What is India’s current account
3.7 What is India’s balance on goods and
China’s (Mainland) Balance of Payments
China’s (Mainland) Balance of Payments
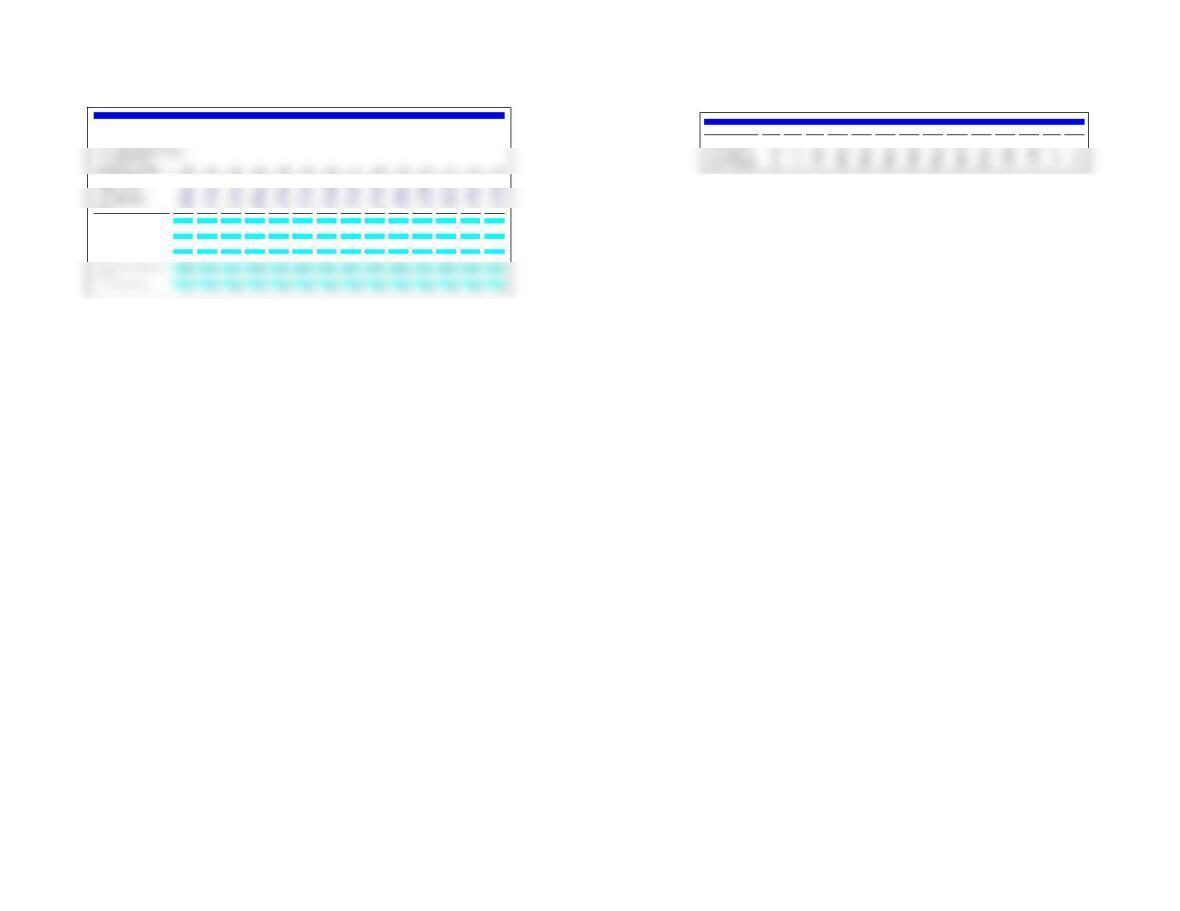
Use the following balance of payments data for China (Mainland) from the IMF to answer Problems 3.10–3.14.
Assumptions (million US$) 2000 2001 2002 2003 2004 2005 2006 2007 2008 2009 2010 2011 2012 2013
3.10 Is China experiencing a net capital inflow or outflow?
A. Current account balance 20,518 17,401 35,422 45,875 68,659 134,082 231,844 353,183 420,569 243,257 237,810 136,097 215,392 182,807
Questions 2000 2001 2002 2003 2004 2005 2006 2007 2008 2009 2010 2011 2012 2013
1,923 34,778 32,291 52,726 110,660 101,046 49,305 94,231 40,126 198,432 286,864 265,470 -31,766 326,203
“inflow” “inflow” “inflow” “inflow” “inflow” “inflow” “inflow” “inflow” “inflow” “inflow” “inflow” “inflow” “inflow” “inflow”
20,483 17,347 35,372 45,827 68,590 138,184 235,864 356,282 423,620 247,195 242,440 141,543 219,664 185,859
22,441 52,179 67,713 98,601 179,319 235,128 281,149 447,414 460,695 441,689 524,674 401,567 183,626 509,010
through C?
3.13 What is China’s Total for Groups A
through D?
3.10 Is China experiencing a net capital
inflow or outflow?
3.11 What is China’s Total for Groups A
and B?
3.12 What is China’s Total for Groups A
Finland’s Balance of Payments
Finland a (Finland’s Federation’s) Balance of Payments
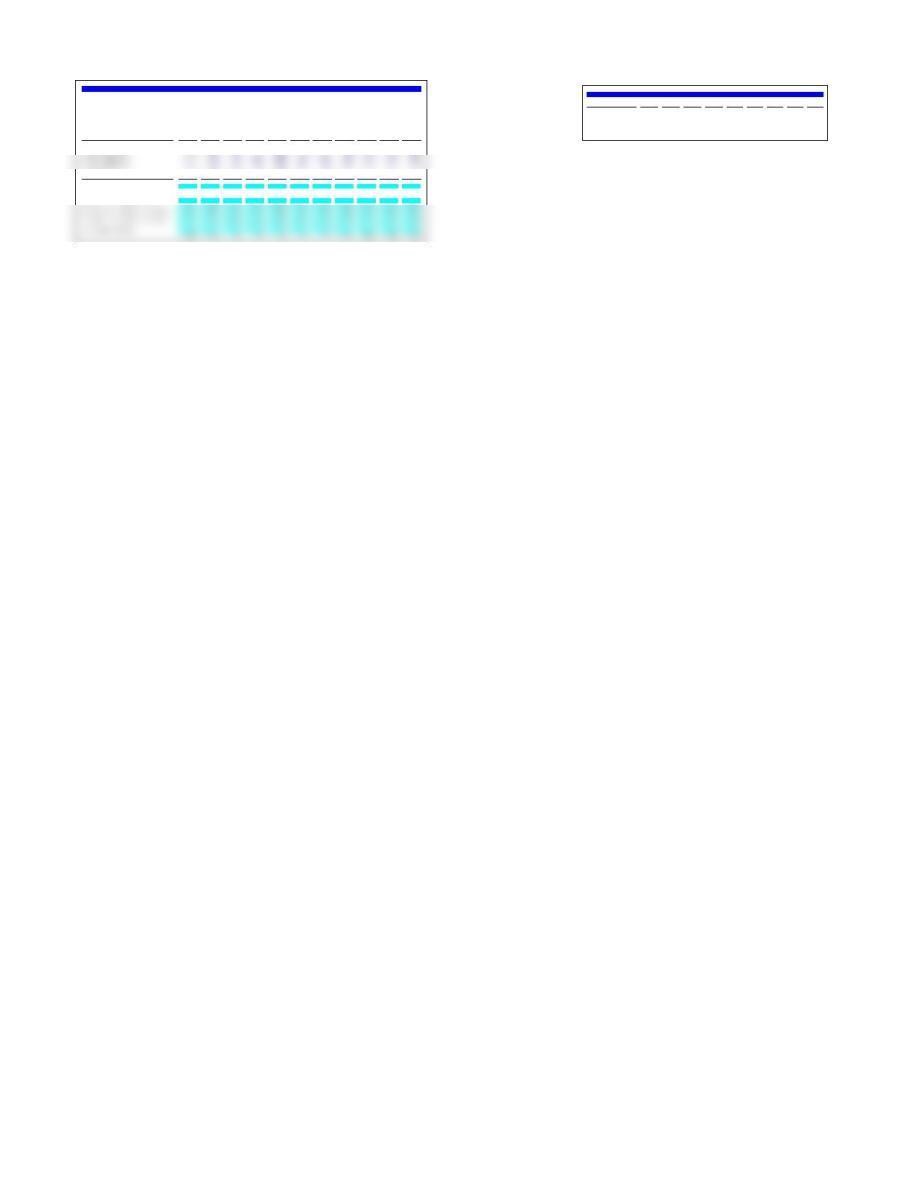
Use the following balance of payments data for Finland from the IMF to answer Problems 3.15 – 3.19.
Assumptions (million US$) 2005 2006 2007 2008 2009 2010 2011 2012 2013
3.15 Is Finland experiencing a net capital inflow?
3.16 What is Finland’s Total for Groups A and B? A. Current account balance 5,713 4,407 2,792 -4,797 -5,901 -5,239 -4,331 -1,683 -1,788
3.17 What is Finland’s Total for Groups A through C? B. Capital account balance 272 227 234 264 265 308 247 174 272
3.18 What is Finland’s Total for Groups A through D? C. Financial account balance -6,407 -9,141 6,482 -11,919 -22,842 -10,428 -10,803 -7,652 -14,574
3.19 Does Finland’s BOP balance? D. Net errors and omissions -12,151 -11,260 1,338 -6,871 -16,518 -4,446 -7,004 -6,272 -12,403
E. Reserves and related items 238 2,516 -2,118 516 688 1,052 -284 -129 659
Assumptions (millions of US dollars) 2008 2009 2010 2011 2012 2013 2014 2015 2016 2017 2018
A. Current account balance 5,713 4,407 2,792 -4,797 -5,901 -5,239 -4,331 -1,683 -1,788 -1,743 -4,467
E. Reserves and related items 238 2,516 -2,118 516 688 1,052 -284 -129 659 -431 -73
Questions 2005 2006 2007 2008 2009 2010 2011 2012 2013 2014 2015
3.15 Is Finland experiencing a net capital inflow? -6,135 -8,914 6,716 -11,655 -22,577 -10,120 -10,556 -7,478 -14,302 -10,457 -11,779
“outflow” “outflow” “inflow” “outflow” “outflow” “outflow” “outflow” “outflow” “outflow” “outflow” “outflow”
Iceland Balance of Payments
Iceland Balance of Payments
Use the following balance of payments data for Iceland from the IMF to answer Problems 3.20–3.24
Assumptions (billion US$) 2008 2009 2010 2011 2012 2013 2014 2015
3.20 Is Iceland experiencing a net capital inflow?
E. Reserves and related items 1,413 15,148 10,023 5,127 991 -132 -3,588 –71,177
Assumptions (billions of US dollars) 2008 2009 2010 2011 2012 2013 2014 2015
A. Current account balance
-4,149 -669 -308 -605 -937 888 616 709
Questions 2006 2007 2008 2009 2010 2011 2012 2013
3.20 Is Iceland experiencing a net capital inflow?
7,356 -21,050 –11,978 -7,361 1,037 -952 2,996 70,100
“inflow” “outflow” “outflow” “outflow“ “inflow” “outflow“ “inflow“ “inflow”
3.21 What is Iceland’s Total for Groups A and B?
-4,161 -680 -320 -618 -947 877 602 698
3.22 What is Iceland’s Total for Groups A through C?
3,206 -21,719 –12,286 -7,966 100 -65 3,612 70,809
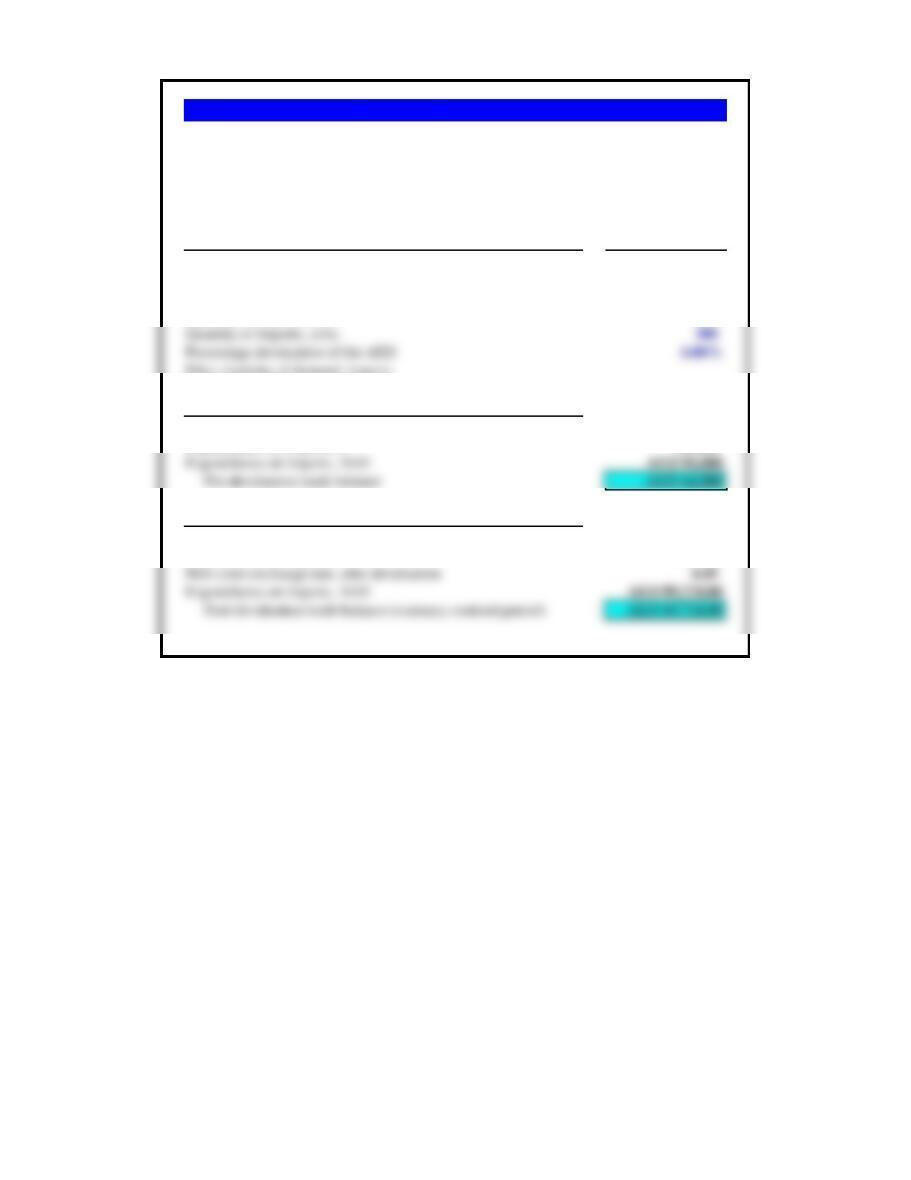
Problem 3.25 Trade Deficits and J-Curve Adjustment Paths
Assumptions Values
Initial cross exchange rate, AED/€ 4.20
Price of exports, (AED) 100 billion
Price of imports, (€) 112 billion
Quantity of exports, units 300
Price elasticity of demand, imports
a. What is the pre-devaluation trade balance?
Revenues from exports, AED AED 30,000
b. Resulting trade balance immediately after devaluation?
Revenues from exports, AED AED 30,000
Expenditures on imports, € 22,400
Assume that the United Arab Emirates has the following import/export volumes and
prices. It undertakes a major “devaluation” of the UAE dirham (AED) by 6% on average
against all major trading partner currencies. What is the pre-devaluation and post-
devaluation trade balance?