1
2 Trade and Technology: The Ricardian Model
Notes to Instructor
Chapter Summary
The first chapters of this textbook address the question of why countries trade with one another. We will
find that the reasons for trade include differences in technology, resources, cost of offshoring, and
proximity to trading partners.
The Ricardian model is based on the level of technology in use within nations. As the use of technology
within industries varies, some goods will have a comparative advantage over other goods. Having a
comparative advantage in a good means that a country can produce some goods at a lower opportunity
cost compared with their other goods. The Ricardian model will show that a nation will trade in the good
2
The three key lessons of the Ricardian model are as follows: (1) Comparative advantage determines the
pattern of trade; (2) there are mutual gains from trade; and (3) wages are determined by absolute
advantage.
As a sidenote, the snowboard example in the beginning of the chapter serves as an introduction to all the
trade chapters (Chapters 2–7), allowing the instructor to skip Chapter 1 if desired. Keep in mind, though,
that Chapter 1 provides a good overview of who trades with whom and by how much in the real world.
It is also a good overview of the international trade topics that this book discusses. Chapter 1 provides
an excellent background and springboard for students that may help to guide them toward an
Comments
Although most students may be familiar with the concept of comparative advantage from principles of
microeconomics, it is a good idea to reintroduce this concept because many students find it challenging.
This chapter also provides a more in-depth analysis of the Ricardian model by covering the

3
Lecture Notes
Introduction
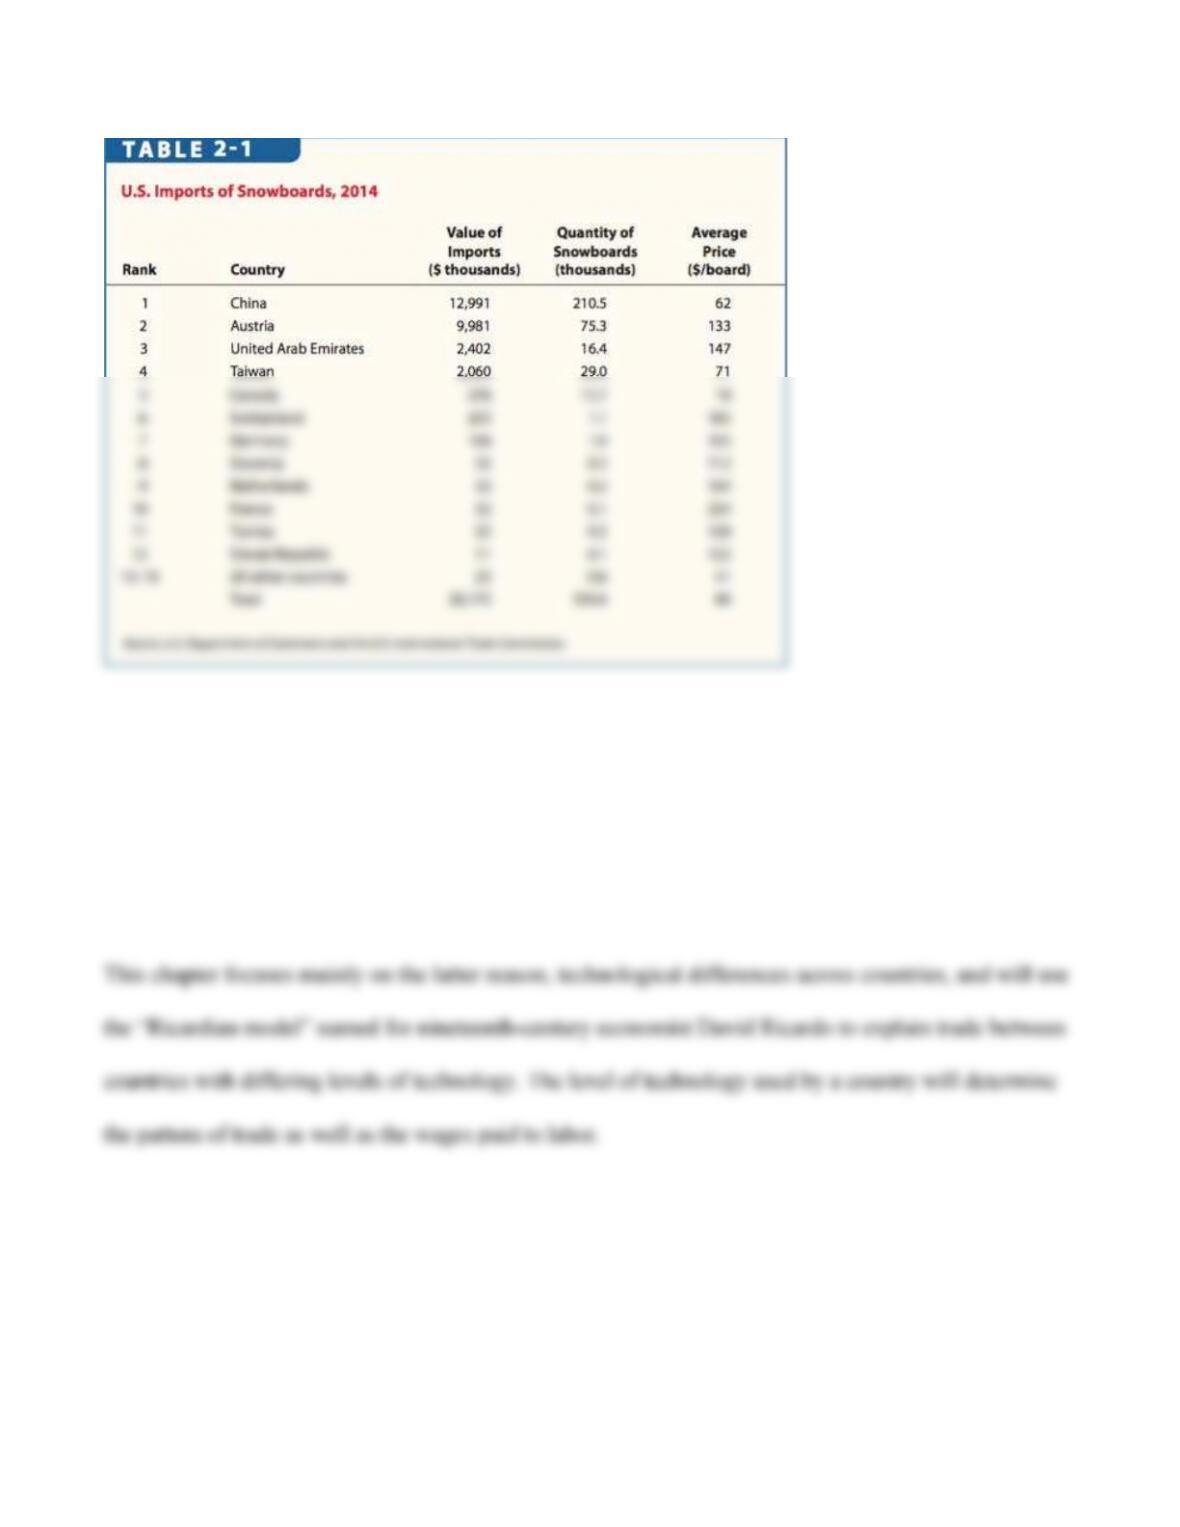
Most manufactured products are traded between countries, including the snowboard. In 2014, the United
States imported 350.6 thousand snowboards worth $28.2 million from 18 different countries. The top 12
countries selling snowboards to the United States are shown in Table 2-1, with China at the top of the
list, followed by Austria, the United Arab Emirates, Taiwan, Canada, Switzerland, Germany, Slovenia,
the Netherlands, France, Tunisia, and Slovak Republic. But, why does the United States purchase
snowboards from these countries at all when it already has the resources and technology to produce the
snowboards?
4
To answer this question and understand why countries trade goods with each other, we will examine the
reasons for trade. These trade determinants include proximity (geographic distance between countries),
resources (land, labor, and capital), offshoring, and differences in level of technology.
1 Reasons for Trade
Proximity The proximity of Canada to the United States means lower transportation costs relative to
5
trade between the United States and countries in Asia or Europe. This close distance between the two
neighboring countries may explain why Canada is not only one of the top exporters of snowboards to the
United States, but also one of its largest trading partner overall. Proximity may additionally be the
Resources Resources are another reason that helps to explain why nations trade with one another.
Consider Austria that sells some 30 times more in value to the United States than does Canada, in spite
And it is important to note that a country can create a comparative advantage. Consider Germany’s
invention of ice wine, which is now also produced in the Niagara Falls region of Canada (see Side Bar:
6
Can Comparative Advantage Be Created?). The United Arab Emirates is another such example, with a
Ski Dubai indoor ski center having opened there. The country has since initiated an industry that
produces high-quality snowboards.
The lower-priced snowboards from Canada ($18) and Mexico ($14) may be indicative of companies
selling unfinished boards that require further processing. The process of trading unfinished goods and
spreading production across several countries is called offshoring. This type of trade is covered in
Chapter 7.
Absolute Advantage Although Germany also has a natural resource, the Alps on its southern border,
the reason it is the seventh largest exporter of snowboards to the United States may be better explained
by its advanced technology. As a world leader in the production of many manufactured goods, Germany
S I D E B A R
Can Comparative Advantage Be Created? The Case of “Icewine”
By linking the production of “icewine,” first developed in Germany in 1794, to the cold climate of its
7
Niagara Falls region, Canada is able to create a new comparative advantage in producing this sweet
dessert wine.
Comparative Advantage To determine trade patterns, we need to examine the relative rather than
absolute differences in technology between countries. To gain a better understanding of the topic, we
turn to the concept of comparative advantage, introduced by David Ricardo using a simple example
The concept of comparative advantage may explain why the United States imports more snowboards
S I D E B A R
David Ricardo and Mercantilism
David Ricardo introduced the concept of comparative advantage as the basis for trade in response to the
mercantilist school of thought that a country should actively export while preventing imports with high
8
2 Ricardian Model This section provides a detailed example of the Ricardian model with the home
country trading wheat and cloth. We will find that absolute advantage is not a good reason for trade and
The Home Country To gain a better understanding of the main concepts of the Ricardian model, we
simplify the example by assuming that labor is the only factor of production for both goods. We use the
Home Production Possibilities Frontier Suppose that there are = 25 workers in the home country.
We will begin by plotting Home’s production possibilities frontier (PPF). To graph the PPF, we
calculate the maximum bushels of wheat Home could produce in an hour if all workers were employed
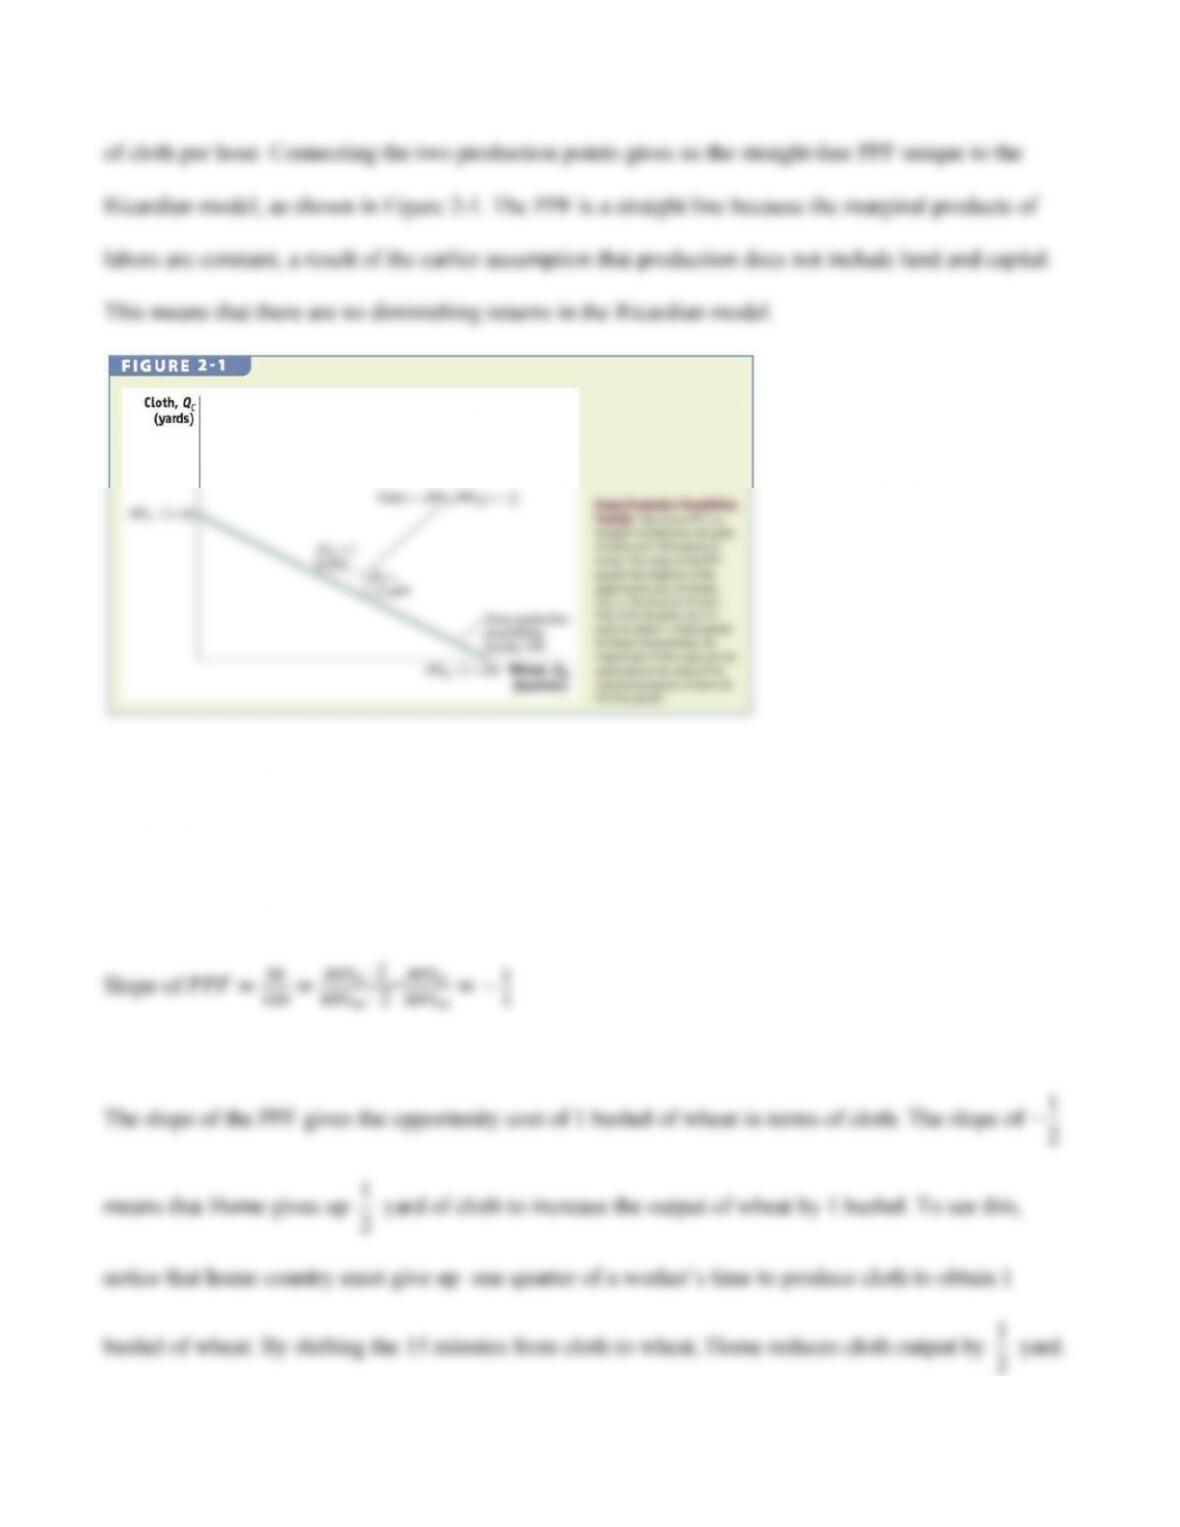
9
The slope of the PPF, equal to the ratio of the marginal products in the two goods, gives the opportunity
cost of one good (on horizontal axis) in terms of the other (on vertical axis).
2
10
Thus,
1
2
yard of cloth is the opportunity cost of obtaining one more bushel of wheat and this is exactly
the slope of the PPF.
Home Indifference Curve To determine the level of wheat and cloth production, we examine Home’s
demand for the two goods, as represented by the country indifference curves. Similar to indifference
curves representing individual preferences, an indifference curve for a country reflects higher levels of
11
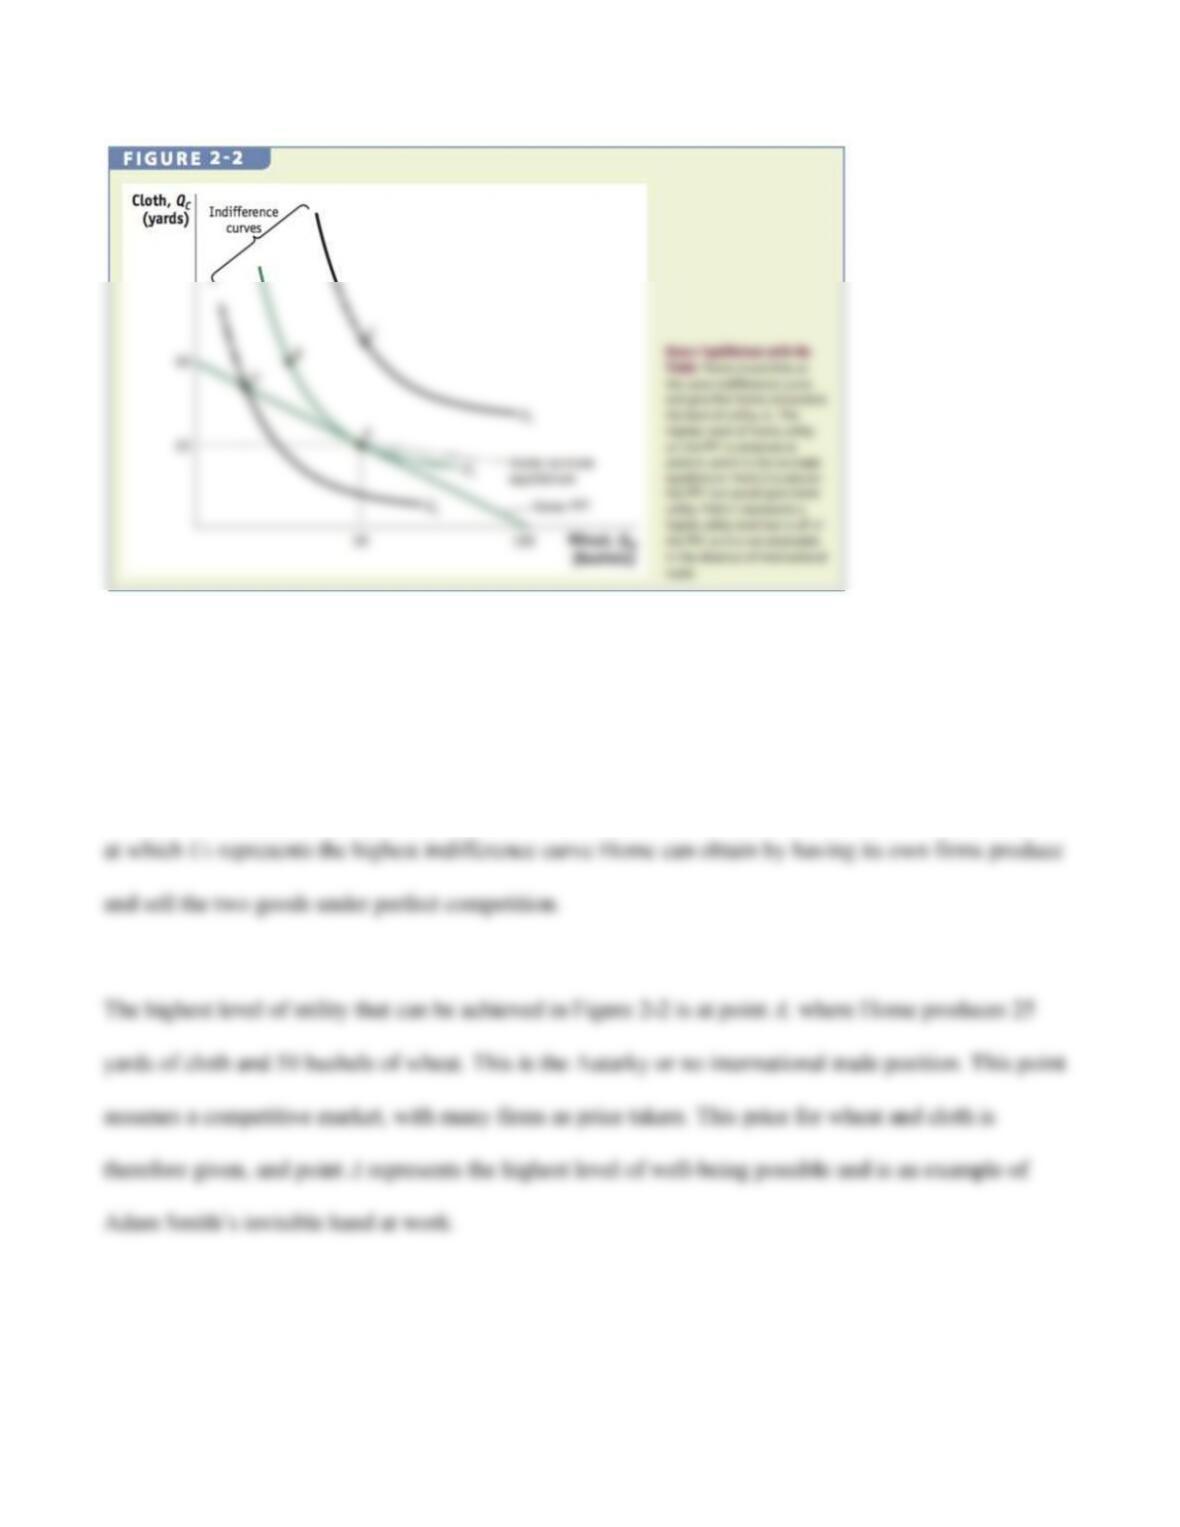
Home Equilibrium Without international trade, Home will produce at the point where the indifference
curve is just tangent to the PPF, which acts like the country’s budget constraint. Figure 2-2 shows that
Home achieves the most satisfaction at the “no-trade” or the “pre-trade” equilibrium denoted by point A,
Opportunity Cost and Prices Under perfect competition, at the no-trade equilibrium, the opportunity
12
cost and relative price of wheat (on horizontal axis) are equal. This result follows from assuming that
labor is perfectly mobile between the two industries and that firms will hire labor up to the point where
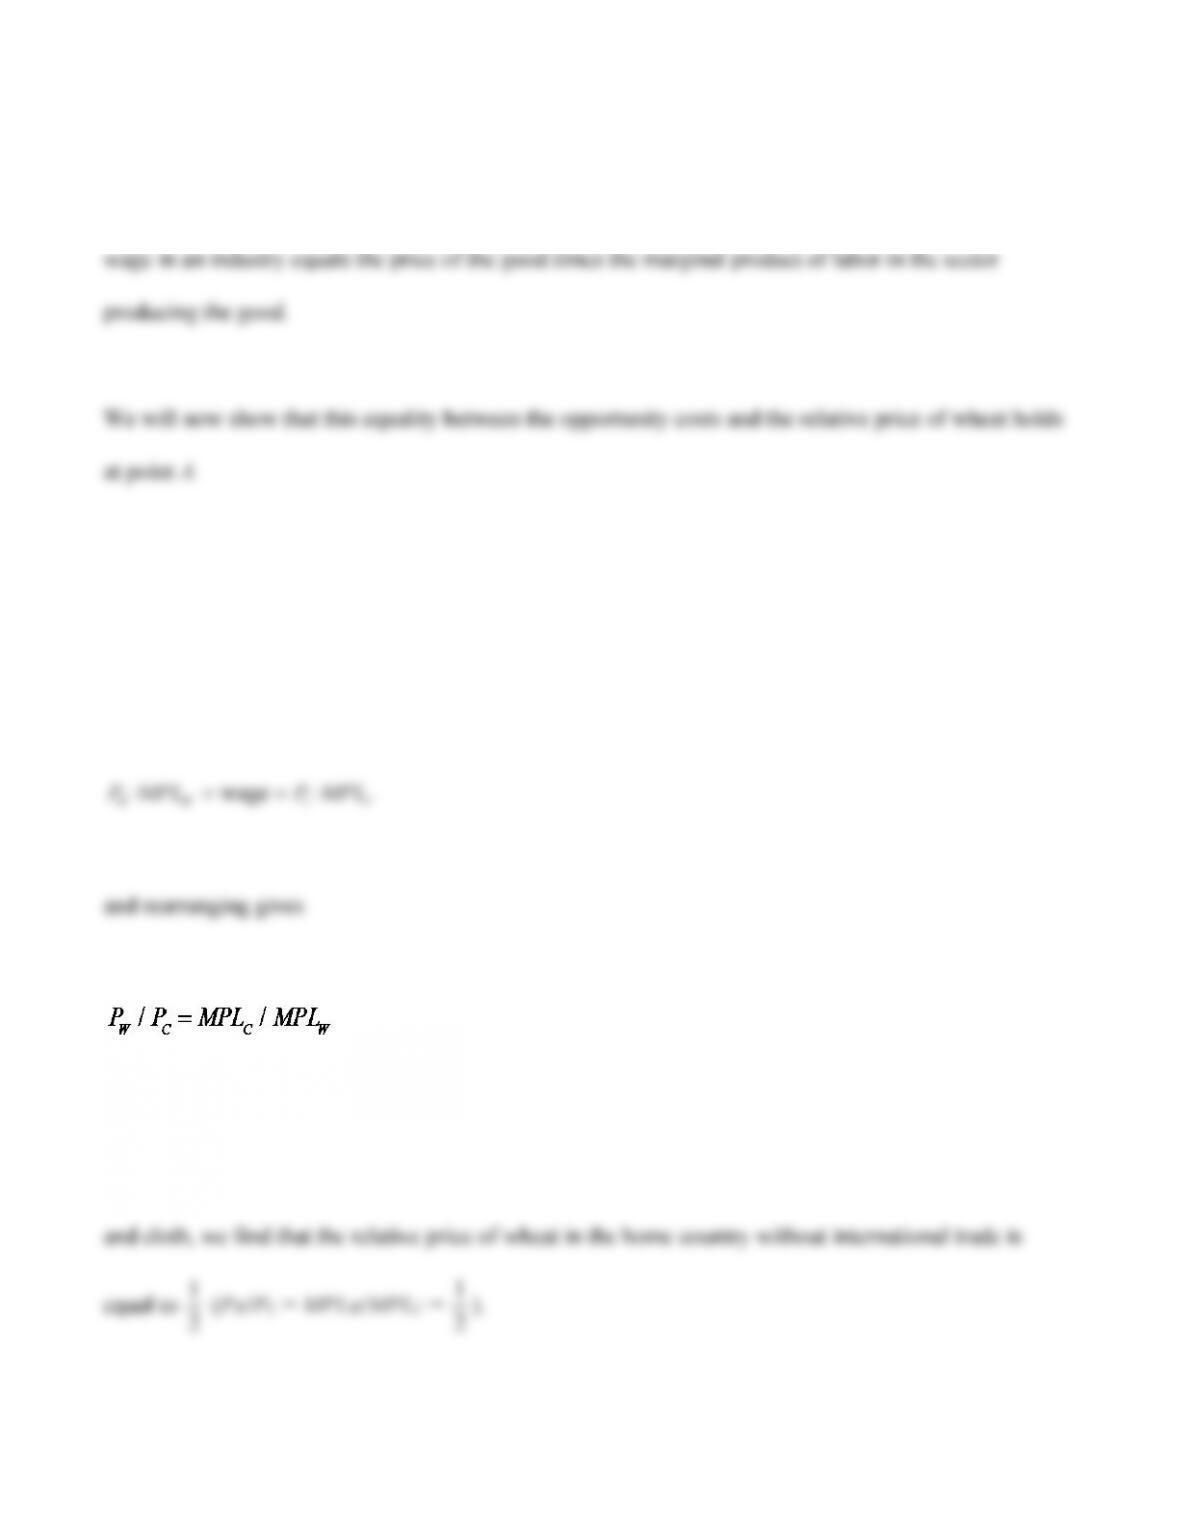
Wages With labor freely able to move between the industries, wages across the industries must be equal,
which gives the equality of the price ratio with the ratio of the marginal products in the two goods.
Setting wage equal in the two sectors
· wage ·
WW CC
P MPL P MPL= =
and rearranging gives
The right side is the slope of the PPF, which also is the opportunity cost of wheat in terms of cloth,
whereas the left side is the relative price of wheat. Substituting the marginal product of labor in wheat
2
2
13
The price ratio (PW/PC ) denotes the relative price of the good in the numerator and is measured in terms
The Foreign Country We have seen the equilibrium in both countries in the absence of trade. Now let’s
see what happens when trade begins. The lesson we will learn is that each country will export that good
in which it has a comparative advantage over its trading partner, even though it may have an absolute
are
∗· =100 bushels of wheat per hour
14
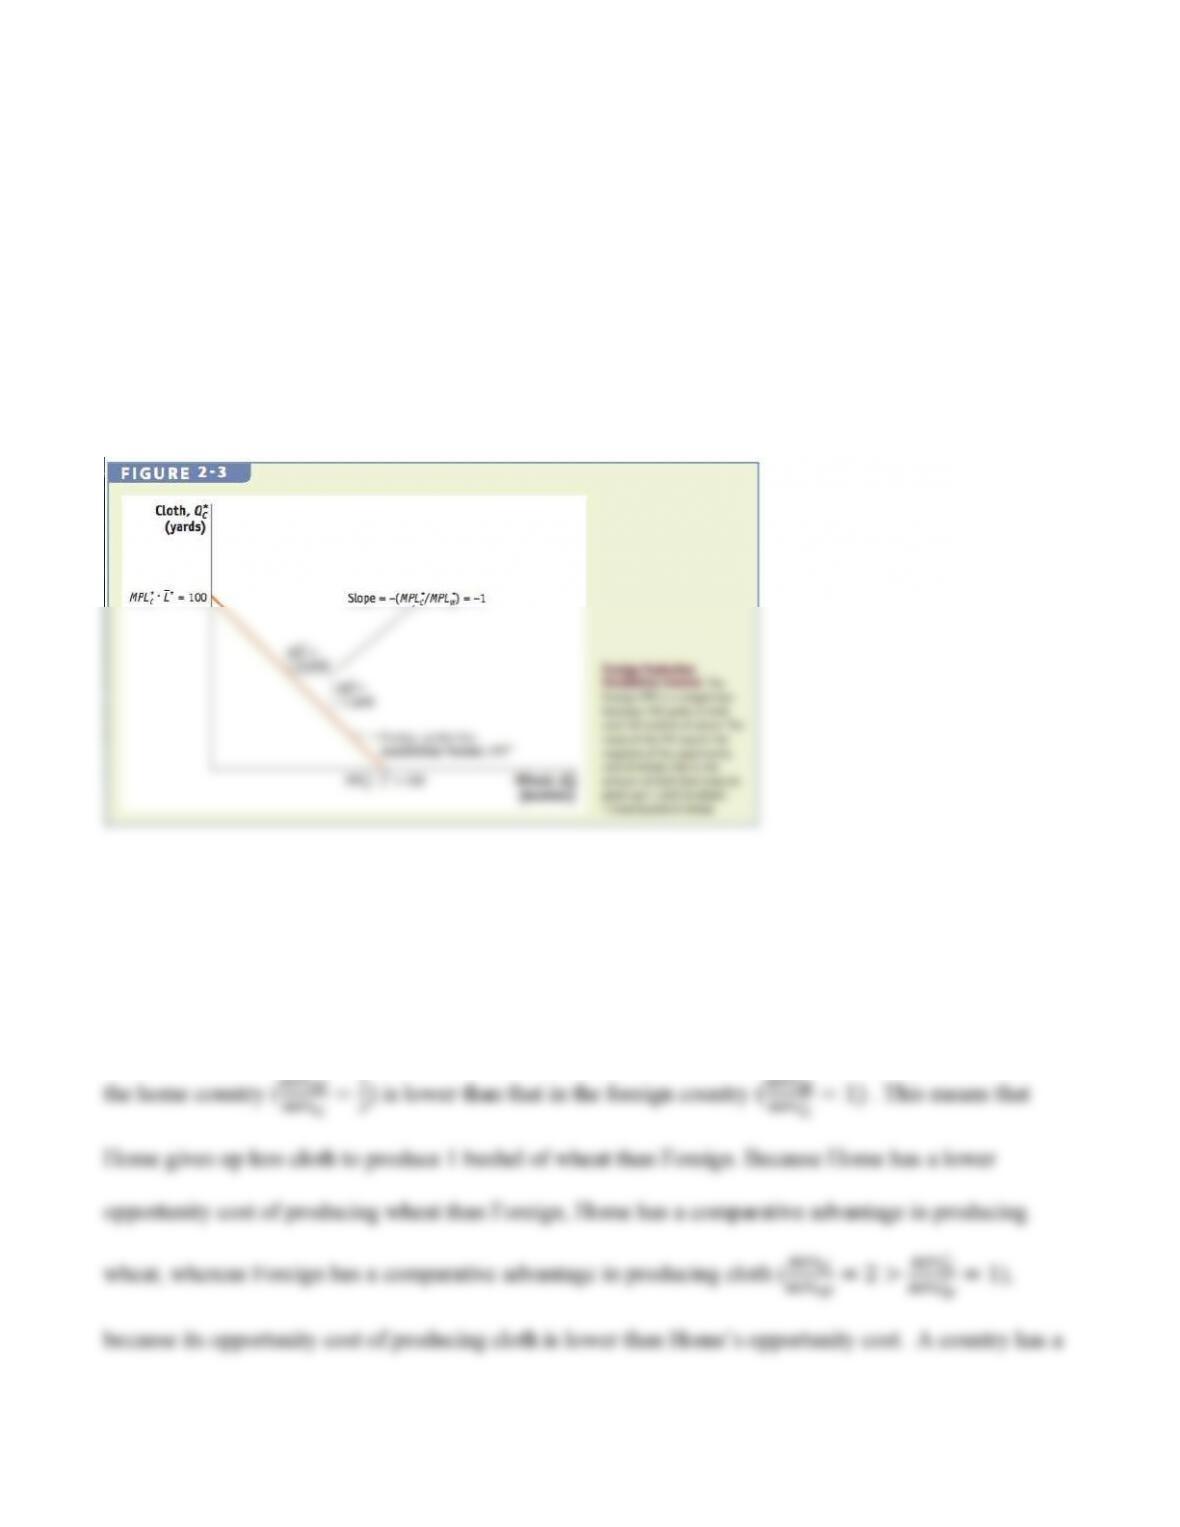
Foreign Production Possibilities Frontier The Foreign PPF, given in Figure 2-3, is the straight line
between the two Foreign production points. The slope of the Foreign PPF, measured by the ratio of the
marginal products in the two goods, is −1. We will now turn to the concept of comparative advantage to
understand why the United States, with its superior technology in the production of both wheat and
cloth, would import most of its clothing from countries in Asia and Latin America.
Comparative Advantage The opportunity cost of 1 bushel of wheat in terms of yards of cloth in the
foreign country is equal to 1. But, the opportunity cost of 1 bushel of wheat in terms of yards of cloth in
∗
15
comparative advantage in a good when it is able to produce the good at a lower opportunity cost than its
trading partner. Importantly, we get this result despite the assumption that Home has an absolute
advantage in the production of both goods.
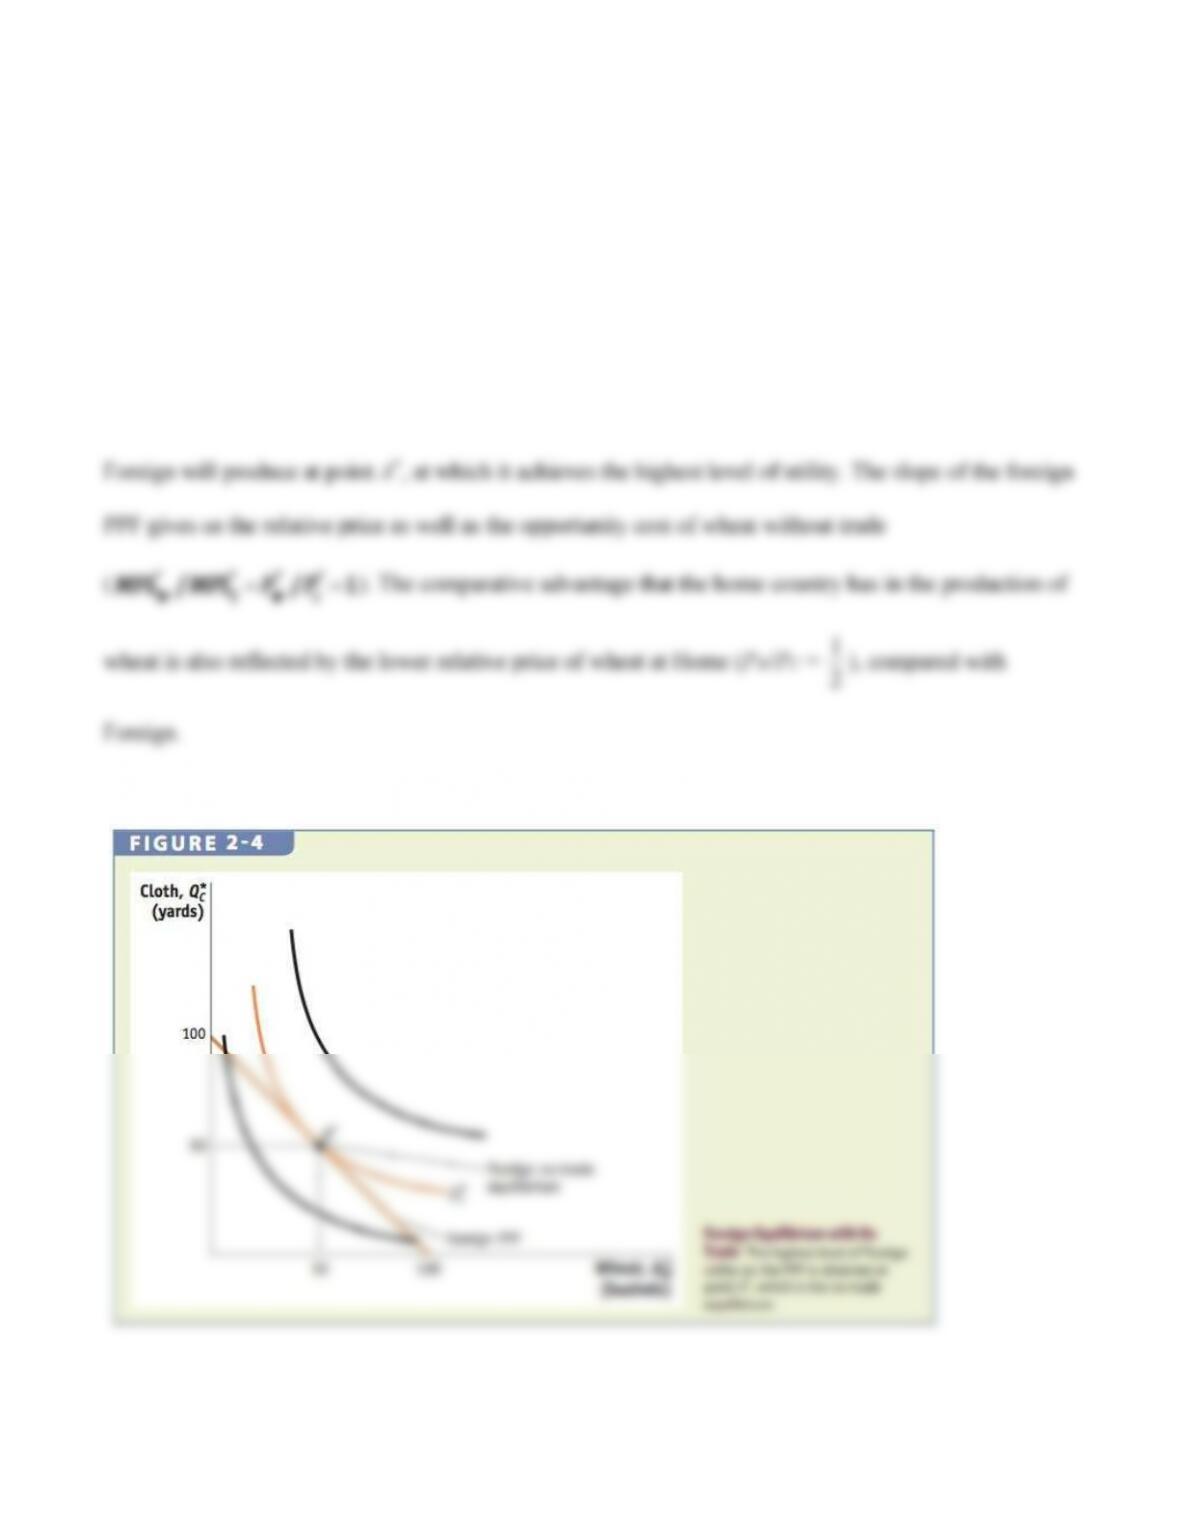
Applying the same methodology for Home, we include Foreign’s preferences for wheat and cloth with
indifference curves to obtain the no-trade equilibrium. Figure 2-4 shows that under competitive markets,
16
APPLICATION
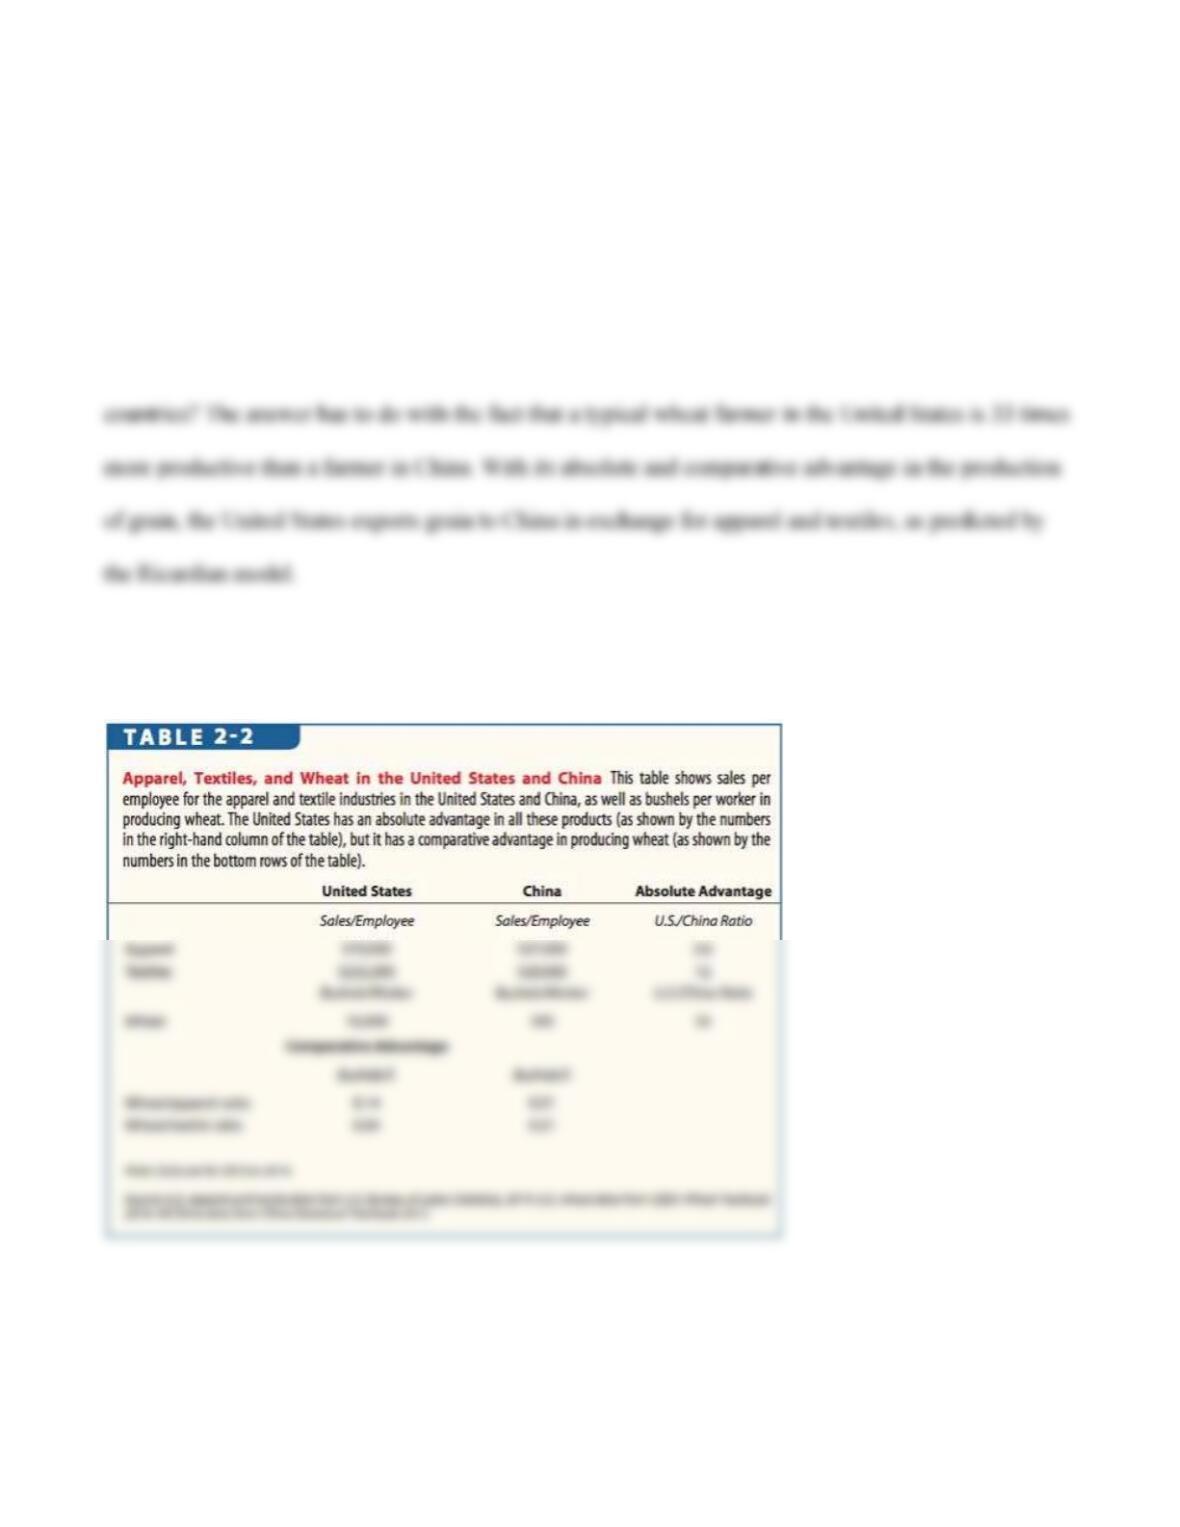
Comparative Advantage in Apparel, Textiles, and Wheat
Table 2–2 shows that a worker in the United States generates 2.6 times more apparel sales and 12 times
more textiles sales per year than a worker in China. With its absolute advantage in the production of
both industries, why does the United States import apparel and textiles from China and other Asian
17
3 Determining the Pattern of International Trade
International Trade Equilibrium We now examine why the two countries participate in international
trade. Because the relative price of wheat in the home country (PW/PC =
1
2
) is lower than the relative
As predicted by the Ricardian model, both countries export the good in which they have a comparative
advantage. This is the fundamental law that determines trade patterns in the Ricardian model.
International trade equilibrium between the two countries occurs only when the relative price of wheat
(or cloth) is the same across the countries. This occurs because as Home exports wheat, the supply of
18
Change in Production and Consumption We must address two questions to fully understand the
international trade position:
1. What will be the relative price of wheat (cloth) in the trade equilibrium?
2. How does trade impact production and consumption in both Home and Foreign?
We will address the second question first and assume a relative price has been established. To determine
how trade impacts each country’s production and consumption patterns, we begin by supposing that the
2
1
Wage
·
3)(4
2) = 8
6> 1, which implies
Because of the higher wages in the wheat industry, no cloth is produced and the home country fully
specializes in the production of wheat, as occurs at point B in Figure 2-5. This fully specialized position
2
1
2
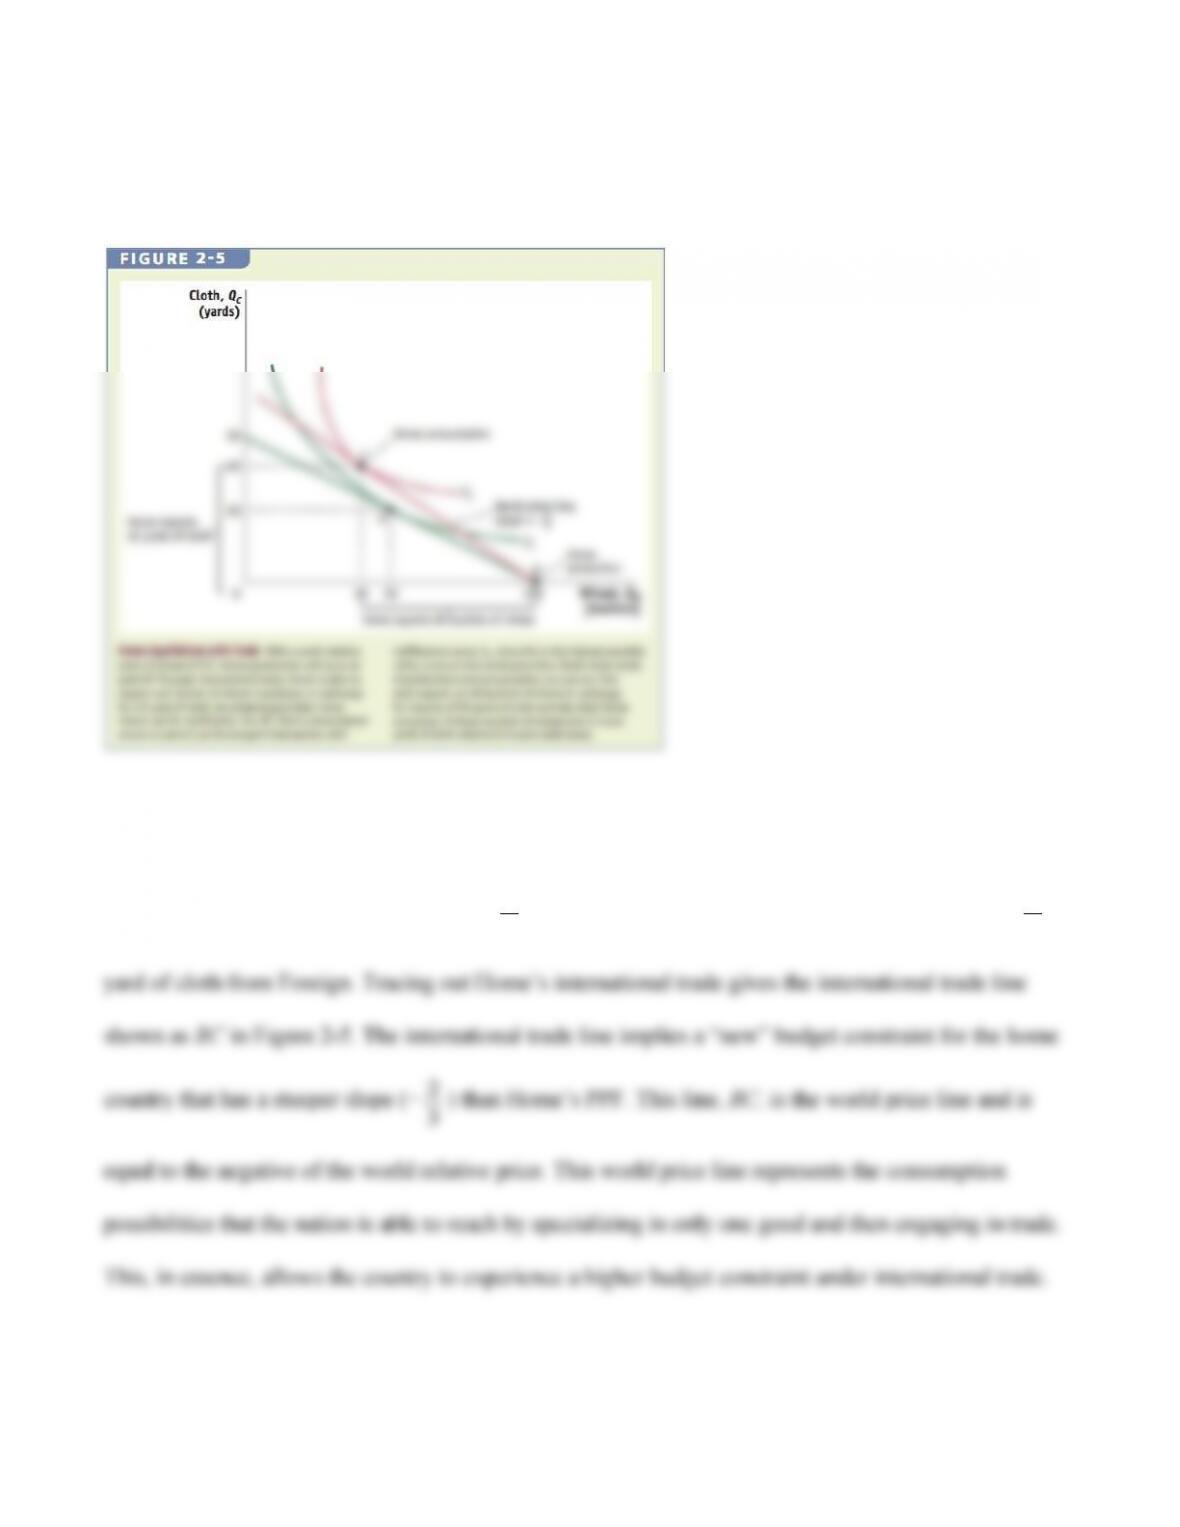
19
is due to the straight line for the PPF.
International Trade Starting from Home’s production point (point B in Figure 2-5), we know that with
the international relative price of wheat at
2
3
, Home can export 1 bushel of wheat in exchange for
2
3
20
Pattern of Trade and Gains from Trade With the international relative price of wheat at
2
3
, Home
produces 100 bushels of wheat (point B) but consumes only 40 bushels (point C). The extra 60 bushels
are exported to the foreign country in exchange for 40 yards of cloth imported from Foreign. The value
of the wheat in terms of cloth is determined by multiplying the international relative price of wheat by
the amount of wheat export, (
2
3
) · 60 = 40 yards of cloth. Because the value of exported wheat is equal
to the value of imported cloth, trade in the home country is balanced.
The results for the foreign country produce trade patterns that are opposite those of the home country
because the international relative price of wheat is less than the foreign no–trade relative price of wheat.
given by the tangency of indifference curve