
INTERNATIONAL ECONOMICS, 7TH EDITION
Study Resources: Questions for Study & Review
Chapter 19
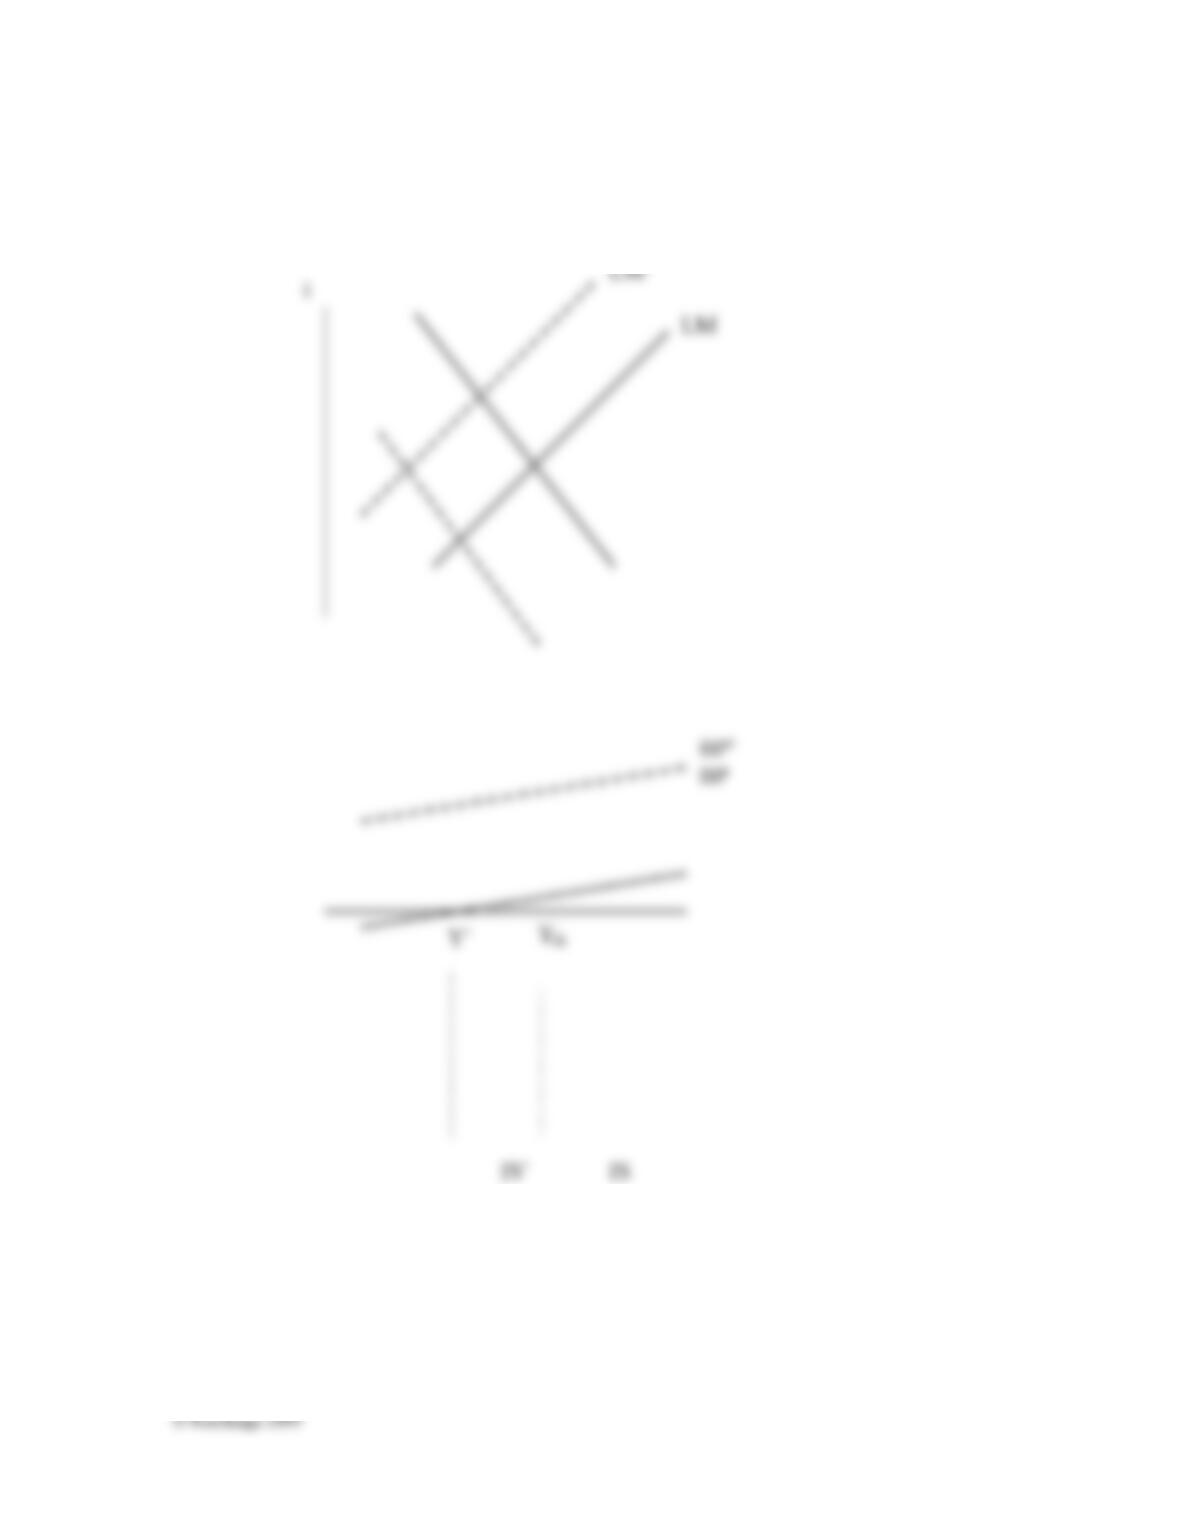
1. From its inception in 1999 to about 2002, the euro kept depreciating against the dollar.
a. Show, with a graph, how European monetary policy could have been used to boost
the euro and how that would have impacted on he U.S. economy.
b. Draw a full employment line in your graph and discuss how this policy you have
suggested would affect employment in Europe.
2. A small country, Pecunia, under a flexible exchange rate regime has achieved both
internal (IS–LM intersection) and external balance. Pecunia trades a lot with the rest of
the world, but allows only limited access to its capital market while its citizens need
authorizations to invest abroad. Pecunia’s central bank does not intervene at all.
Pecunia is facing a serious housing slump and the central bank worries about its
impact on its economy. If you were the president of the central bank, what would you
do to deal with this situation?
a. Spell out the policy carried out by the central bank (be specific).
b. Use a graph showing the IS–LM–BP to illustrate the impact of the policy – name the
starting equilibrium point a. Show the shifts (if any) of the three curves IS–LM–BP
resulting from the policy adopted. Break down the effect into two stages: (i) name
the impact of the policy alone, point b, (ii) name the final equilibrium point c.
c. What is the status of the balance of payments in b? What will be the impact on the
exchange rate? What will eventually happen to income – compared to its initial
position in a?
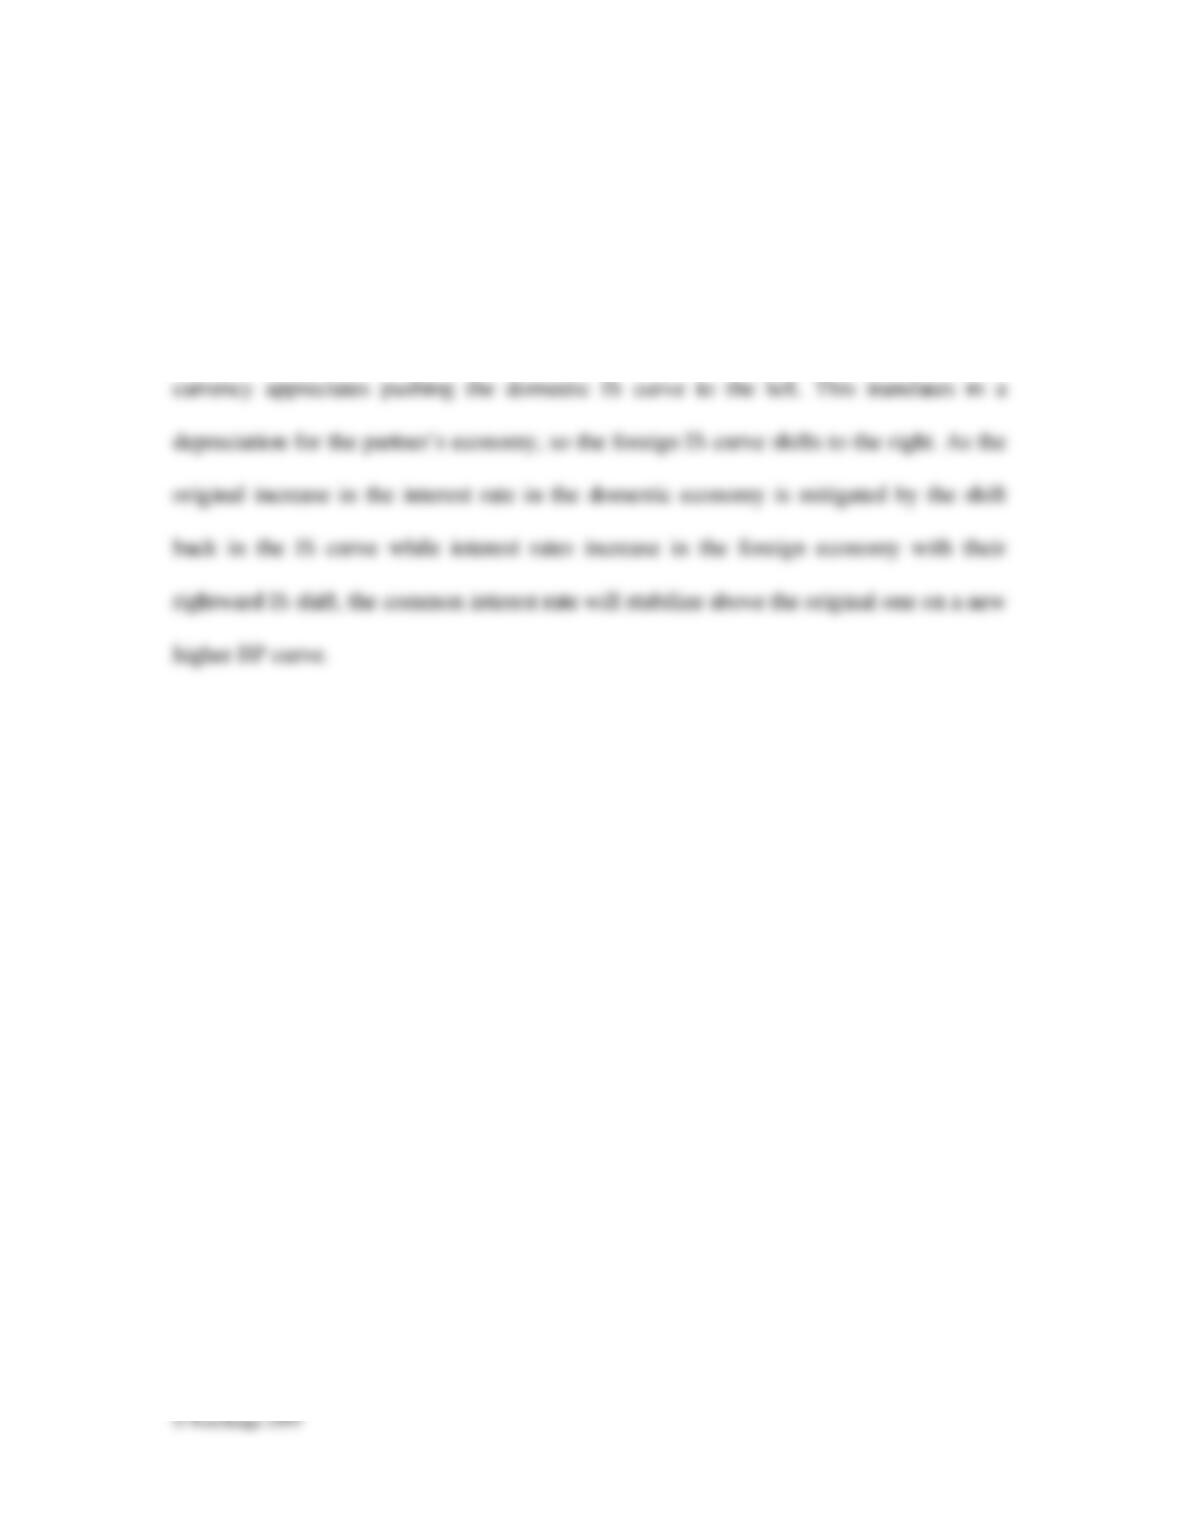
3. Two large countries, domestic and foreign, under a flexible exchange rate regime,
allow perfect capital mobility. The domestic economy, weary of inflationary pressures,
cuts the money supply. Draw two graphs side by side showing the IS and the LM
curves and the initial equilibrium for each country. Draw the relevant BP=0 curve and
name all the curves and axes.
a. Show the effect of the policy described above on the graph. Determine the initial
world interest rate and the final one. Show all the shifts of the relevant curves in the
two countries and the final two-country equilibrium.
b. What will happen to the exchange rate in the domestic economy? What will
eventually happen to income in each of the two countries?
4. The French and the German economies are very open to each other. They trade and
invest freely in each other’s economies. Assume that they had a flexible exchange rate
regime at the time of the German reunification (in reality this was not the case). In
order to finance the reunification of East and West Germany, Chancellor Köhl issued
new government bonds – a form of expansionary fiscal policy.

a. Draw two IS–LM graphs side by side, one for each country, to show the impact of
the policy on the two countries. Draw the relevant BP=0 curve and name all the
curves and axes on the graphs above. Name the original equilibrium point a for
Germany and a* for France.
b. Show the effect of the policy described above and the adjustment on the graph.
Show the initial world (= Germany+France) interest rate as i and the final world
interest rate as i¢. Show all the shifts of the relevant curves in the two countries and
the final two-country equilibrium (as respectively A and A*) as Y¢G and Y¢¢F.
c. What do you expect the impact to be on the German DM? On the French franc?
d. What happens to the interest rate in the two countries eventually (from the original
to the final situation)? And to income in each country?
Now let us start from this new equilibrium (the new interest rate is now i¢ and the
new equilibrium income are Y¢G and Y¢F) and figure out what will happen when
Germany uses monetary policy to fend off inflation.
e. Use a new set of graphs – one for each country. Draw the relevant BP¢ curve at
interest rate i¢ and name all the curves and axes on the graphs above. Name the
original equilibrium point A for Germany and A* for France. Show the effect of the
policy described above and the adjustment on the graph. Show the initial world
interest rate as i¢ and the final world interest rate as i¢¢. Show all the shifts of the
relevant curves in the two countries and the final two-country equilibrium.
f. What do you expect the impact to be on the German DM? On the French franc?
g. What happens to the interest rate in the two countries eventually (from the situation
in b to the final situation)? And to income in each country?
5. Switzerland adheres to a flexible exchange rate arrangement and allows very high to
perfect levels of capital mobility. Unfortunately their economy is in a slump and their
currency is too strong for the good of their economy. The exchange rate of 1.60 SF per
euro overestimates the health of the Swiss economy. An exchange rate of 1.66SF per
euro would be a better reflection of the Swiss fundamentals. Two problems need to be
tackled at once with two policies.
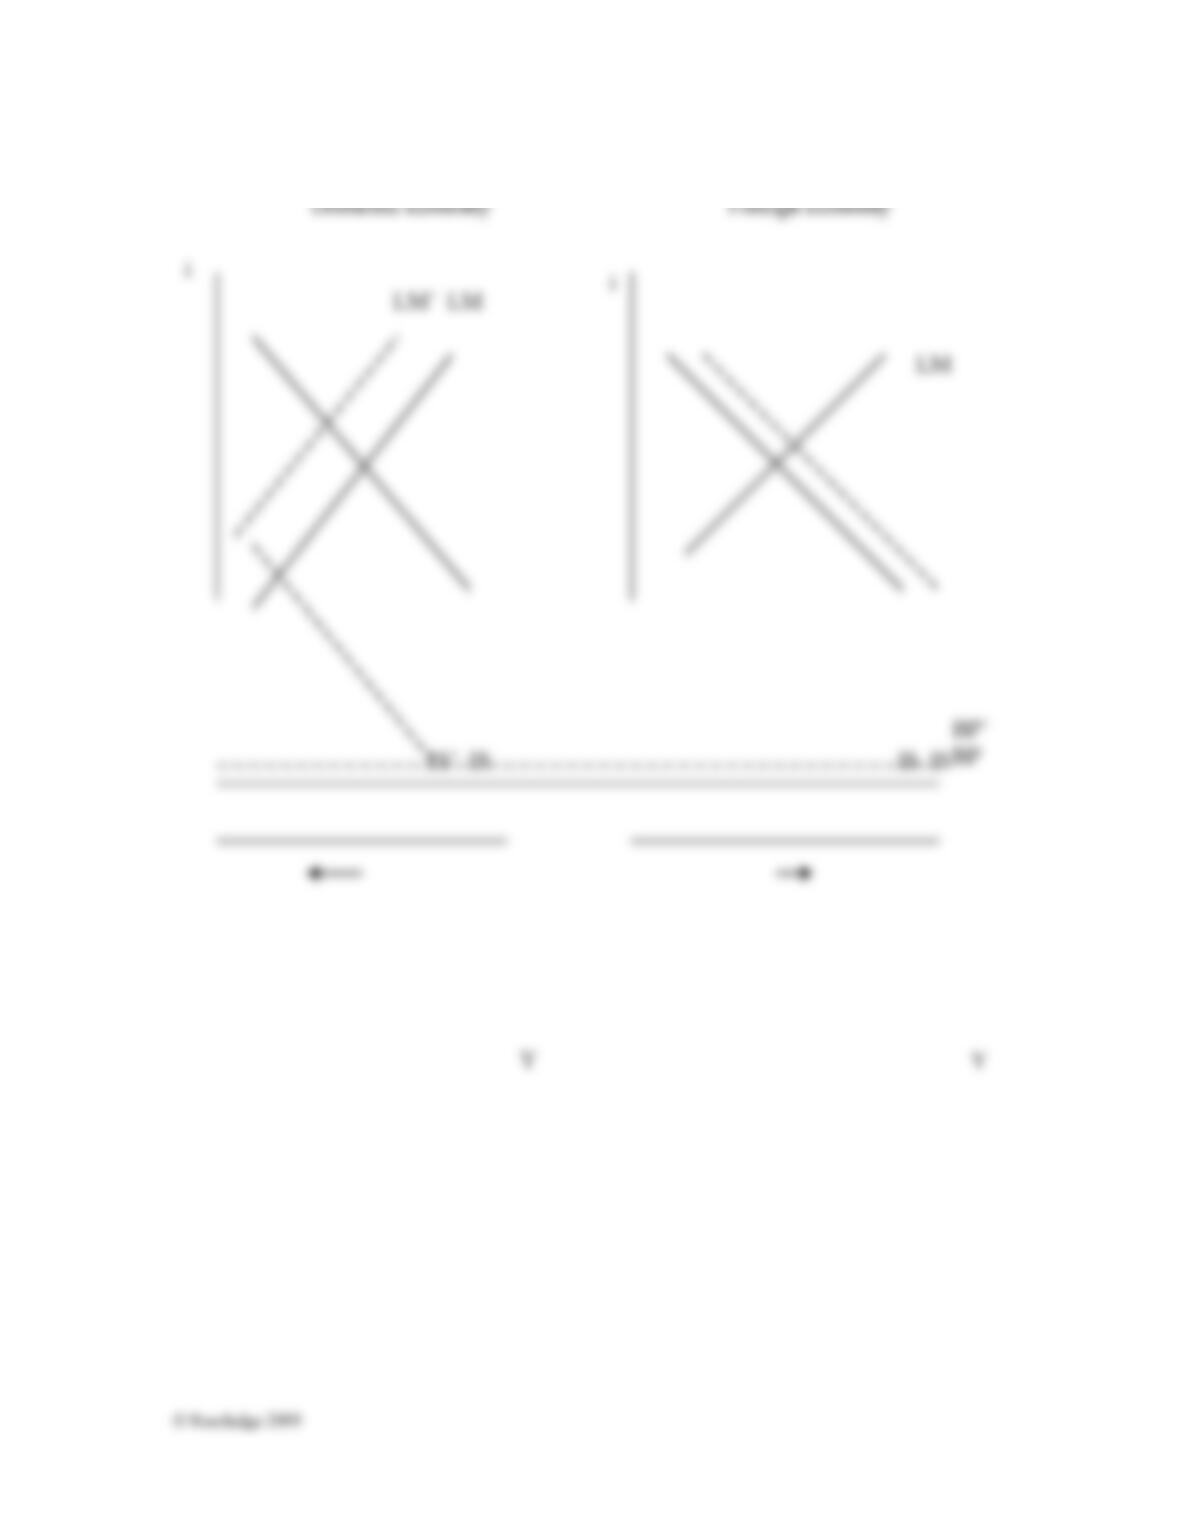
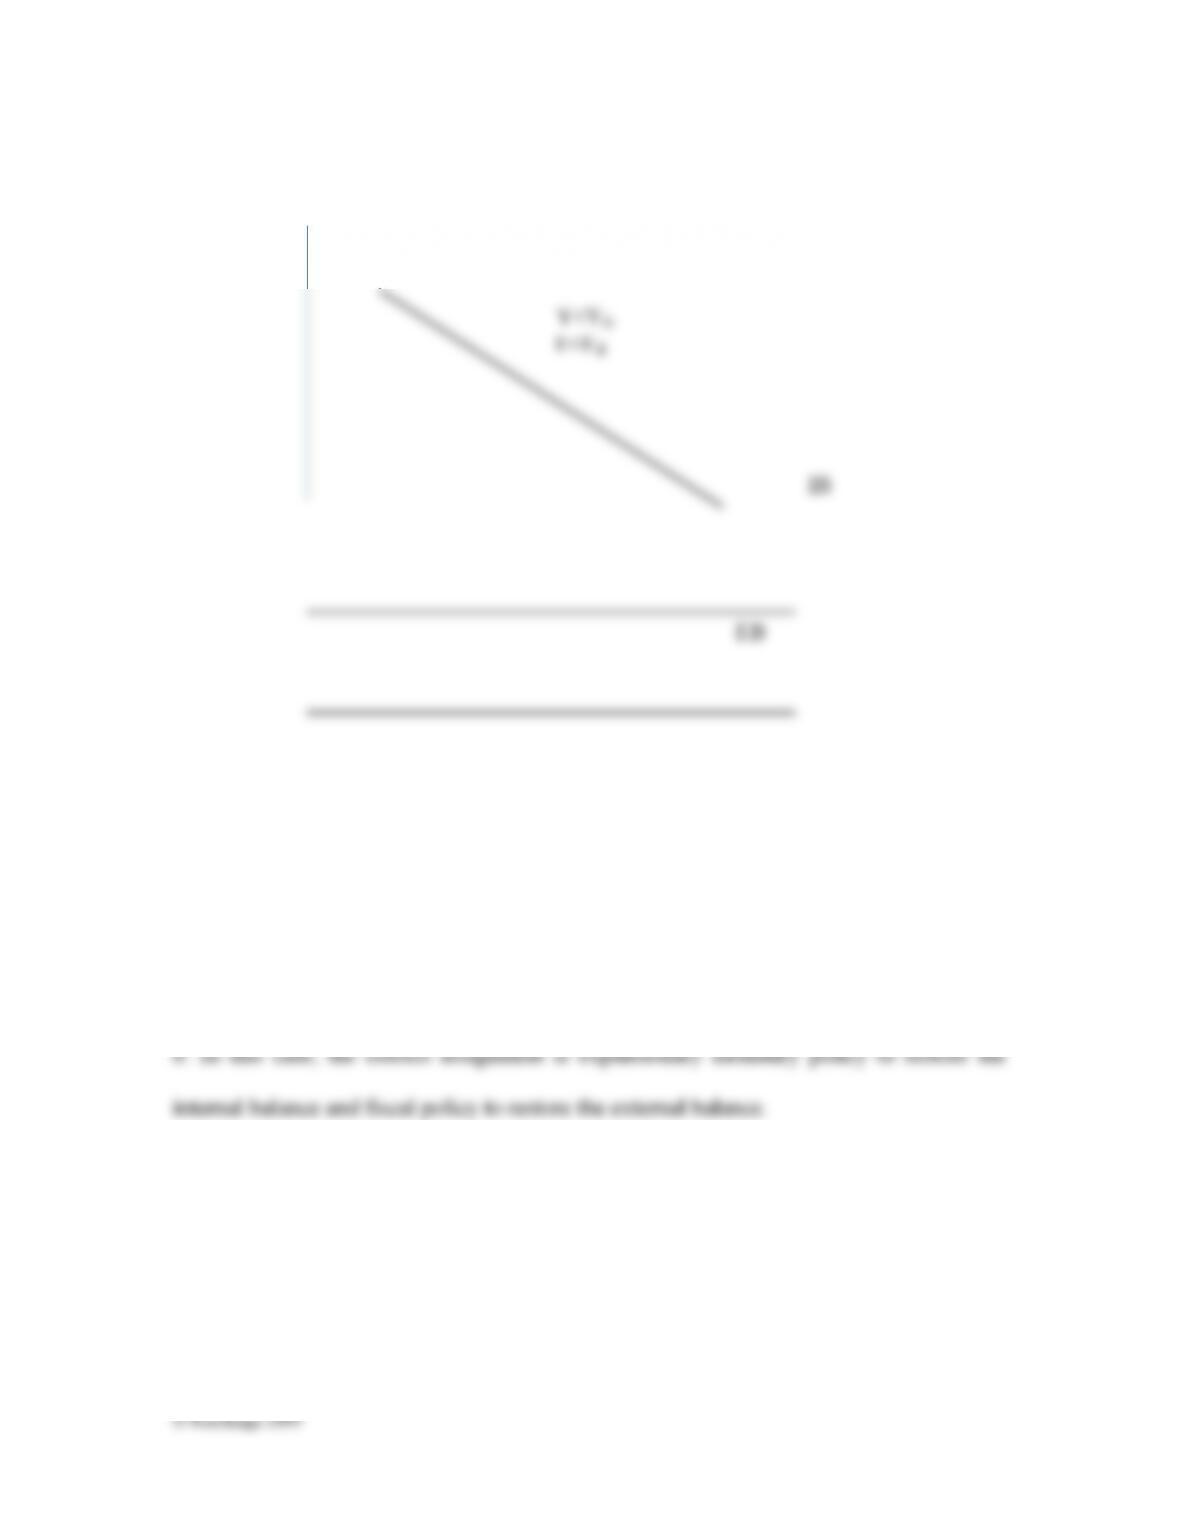
a. Draw a graph showing the internal balance and the external balance as two lines in
a space measuring, on the vertical axis, monetary policy as the level of interest rate
i and, on the horizontal axis, fiscal policy as the level of government spending G.
Show the position of the Swiss economy on the graph.
b. Suggest the correct assignment to restore both internal and external balance. Show
the path on the graph.
6. In the mid 1990s, the Irish economy was at full employment. However since Ireland
was planning to join the EMU, Ireland had a fixed exchange rate arrangement with the
other members and had to follow its cue from the European Monetary Institute (EMI),
the European organization that was harmonizing the monetary policy of the members.
Most of the other members had sluggish economies so monetary expansion was the
policy advocated.
a. What was the impact of the policy in the short run for Ireland?
b. Use the AD–AS diagram to show the effect of the policy on prices in Ireland in the
medium run.
INTERNATIONAL ECONOMICS, 7TH EDITION
Study Resources: Questions for Study & Review
Chapter 19: Answers
1.
a. Contractionary monetary policy would be needed to strengthen the euro. With high
capital mobility, the higher interest rates would attract foreign assets thus raising the
demand for euros while the improvement in the balance of trade resulting from the
LM’
i
Y
3.
a. As the money supply contracts in the domestic economy, the LM shifts back. With full
capital mobility, this results in capital inflows (higher interest rates) and the domestic
5. a. The Swiss economy is below full employment i.e. above the internal balance IB line
i
Y<Yfe
G