7 (18) Balance of Payments II: Output, Exchange Rates, and Macroeconomic
Policies in the Short Run
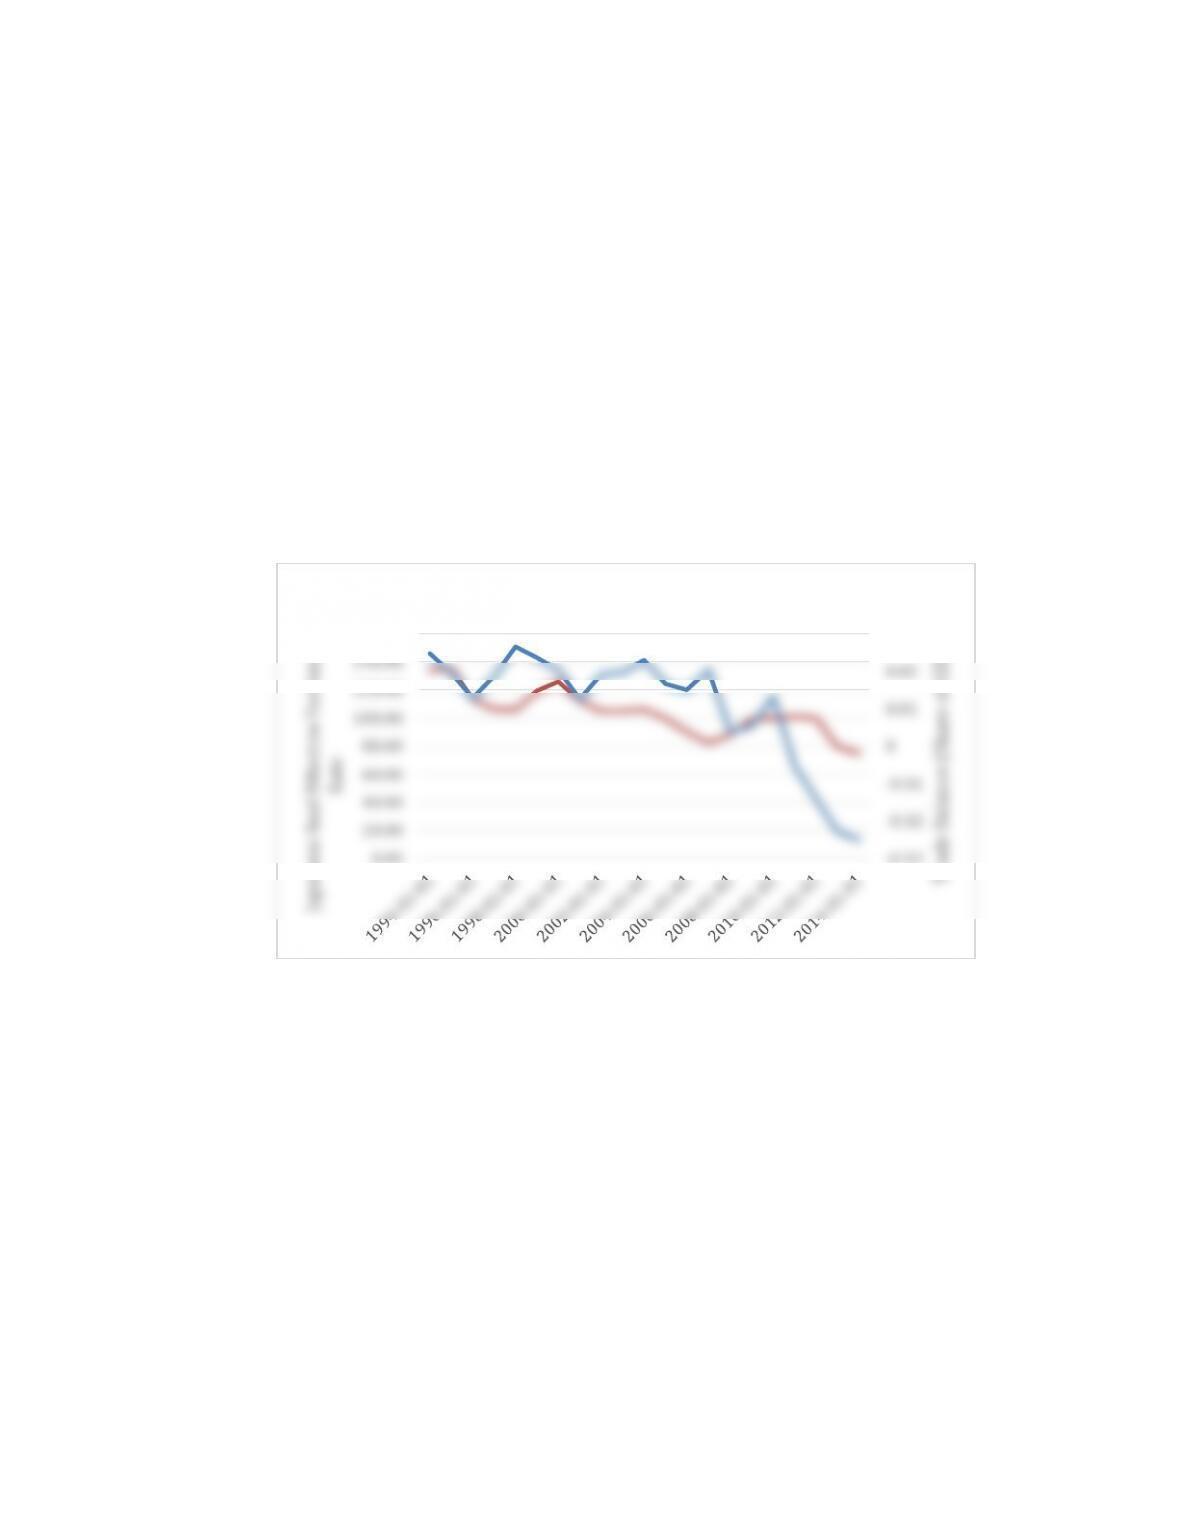
1. Discovering Data In this chapter we discussed the weak link between the real
exchange rate and the trade balance. We looked at a time series diagram showing
these two variables for the United States in Figure 18-4, but what about other
countries? Go to the online FRED database (https://fred.stlouisfed.org) and download
the data for the real effective exchange rate, the trade balance (in local currency)
and GDP (in local currency) for China and Japan from 1995 to the present.
a. For each country make a chart, like Figure 18-4, that shows the real exchange
rate and the trade balance as a share of GDP on the same line graph. Use the
left vertical axis for the real exchange rate and the right vertical axis for the
trade balance as a percent of GDP.
ANSWER: See the charts below.
-0.03
-0.02
-0.01
0
0.01
0.02
0.03
0.00
20.00
40.00
60.00
80.00
100.00
120.00
140.00
160.00
Trade Balance (Share of GDP)
Japanese Real Effective Exchange
Rate
Japan
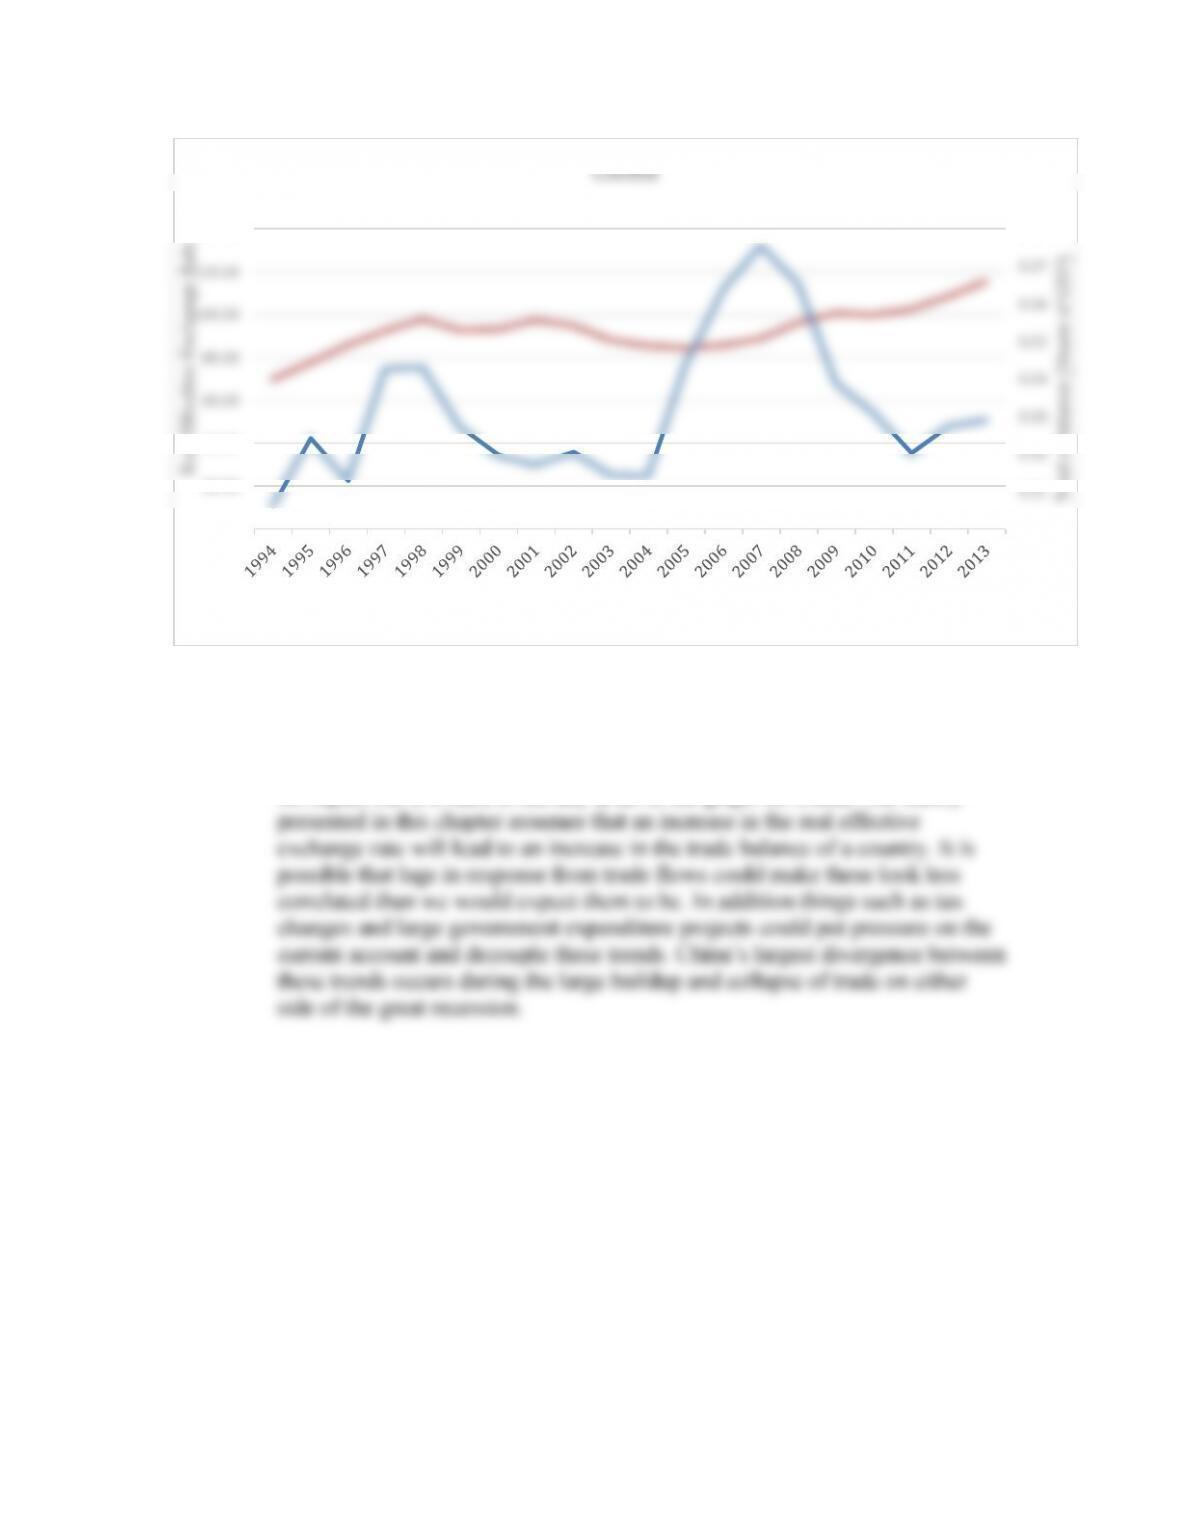
b. For each country, do you find that these variables have a strong relationship?
Is it what you would expect from this chapter? Explain why this relationship
might fail or even go in the opposite direction of what we would expect.
Answer: There does appear to be a weak relationship between these variables
for Japan, but it is hard to see any at all in the graph for China. Our theory
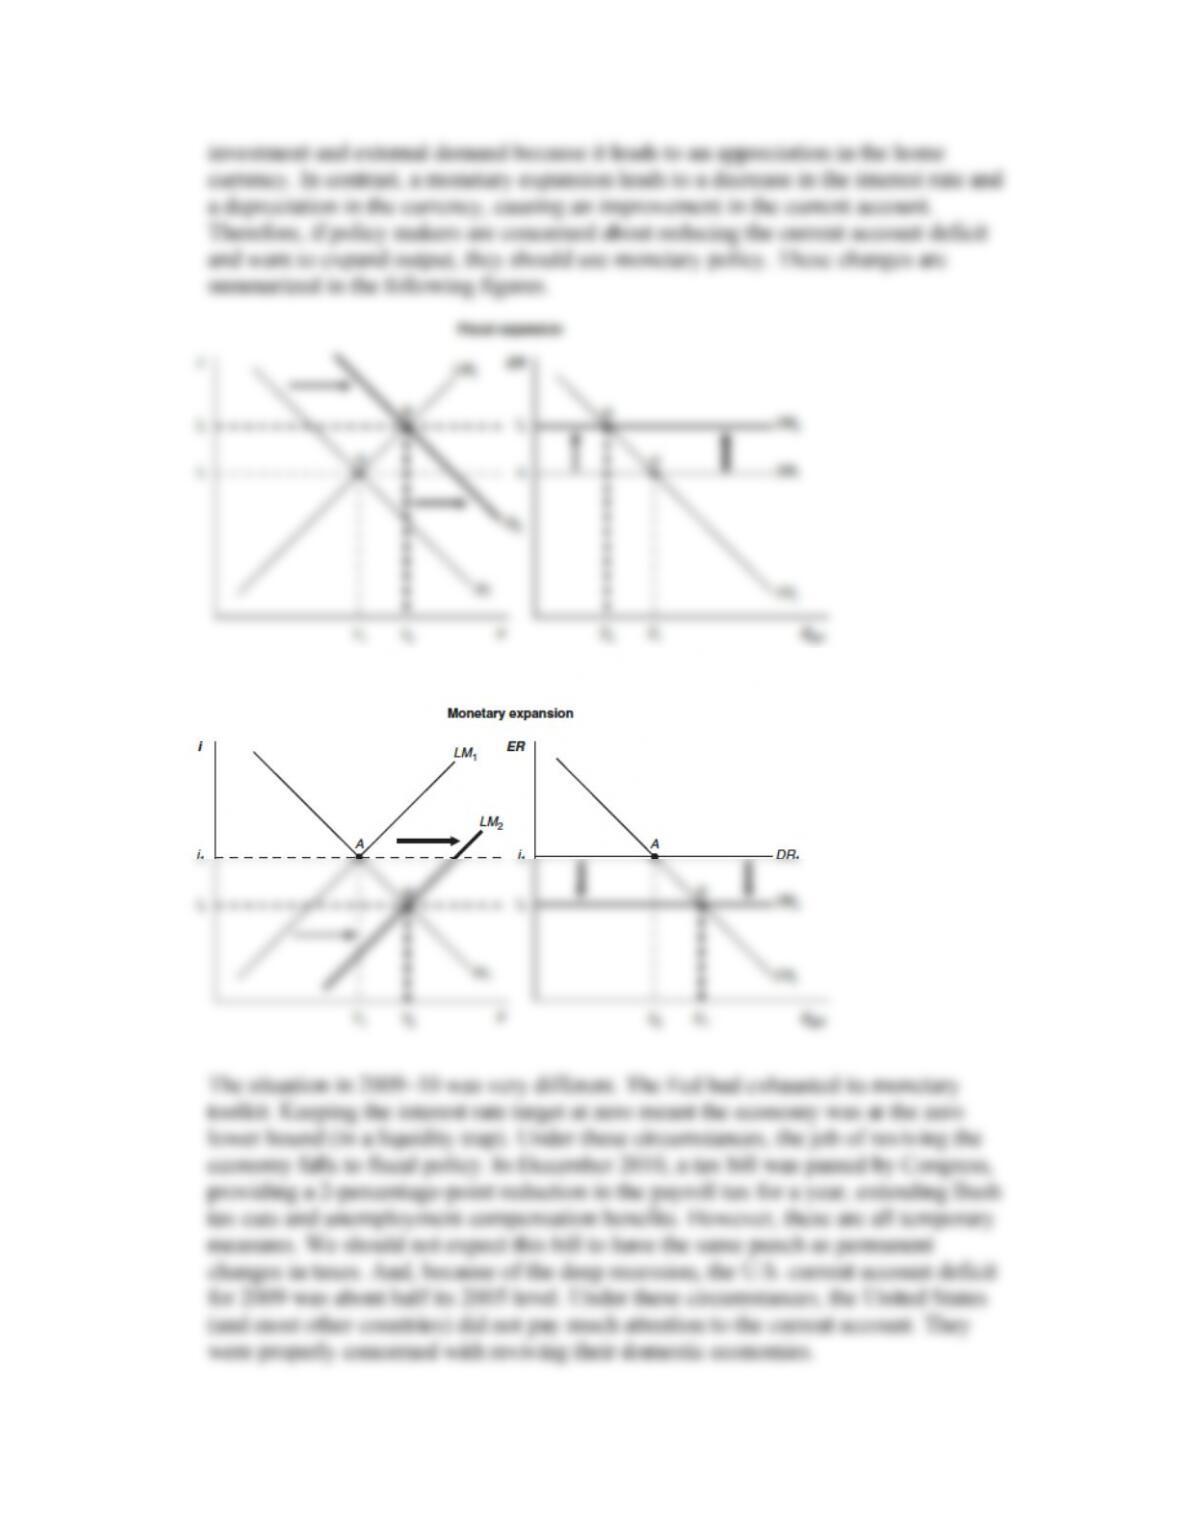
2. In 2001, President George W. Bush and Federal Reserve Chairman Alan Greenspan
were both concerned about a sluggish U.S. economy. They also were concerned about
the large U.S. current account deficit. To help stimulate the economy, President Bush
proposed a tax cut, while the Fed had been increasing U.S. money supply. Compare
the effects of these two policies in terms of their implications for the current account.
If policy makers are concerned about the current account deficit, discuss whether
stimulatory fiscal policy or monetary policy makes more sense in this case. Then,
reconsider similar issues for 2009–10, when the economy was in a deep slump, the
Fed had taken interest rates to zero, and the Obama administration was arguing for
larger fiscal stimulus. Why might many believe that the Fed should keep interest rates
at near zero levels in 2016 and beyond as growth remains stagnant?
Answer: From the model, we know that fiscal expansion leads to crowding out of
0
0.01
0.02
0.03
0.04
0.05
0.06
0.07
0.08
0.00
20.00
40.00
60.00
80.00
100.00
120.00
140.00
Trad e Balance (Share of GDP)
Real Effective Exchange Rate
China
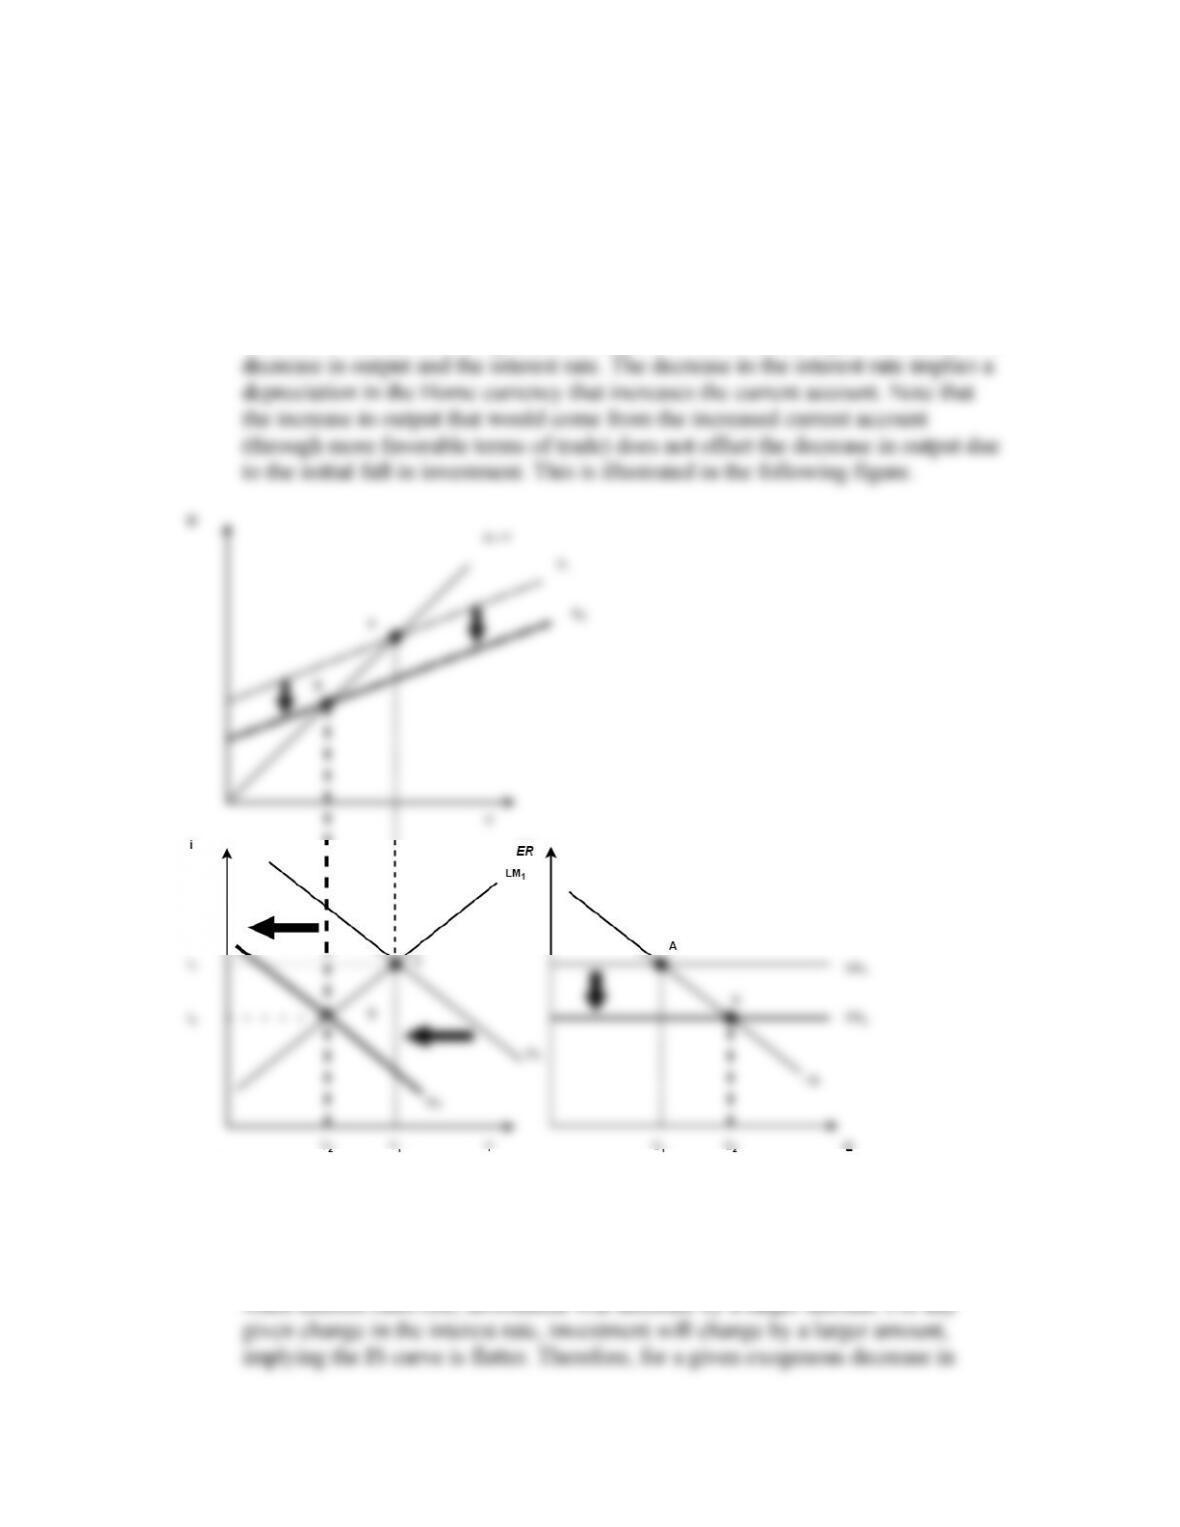
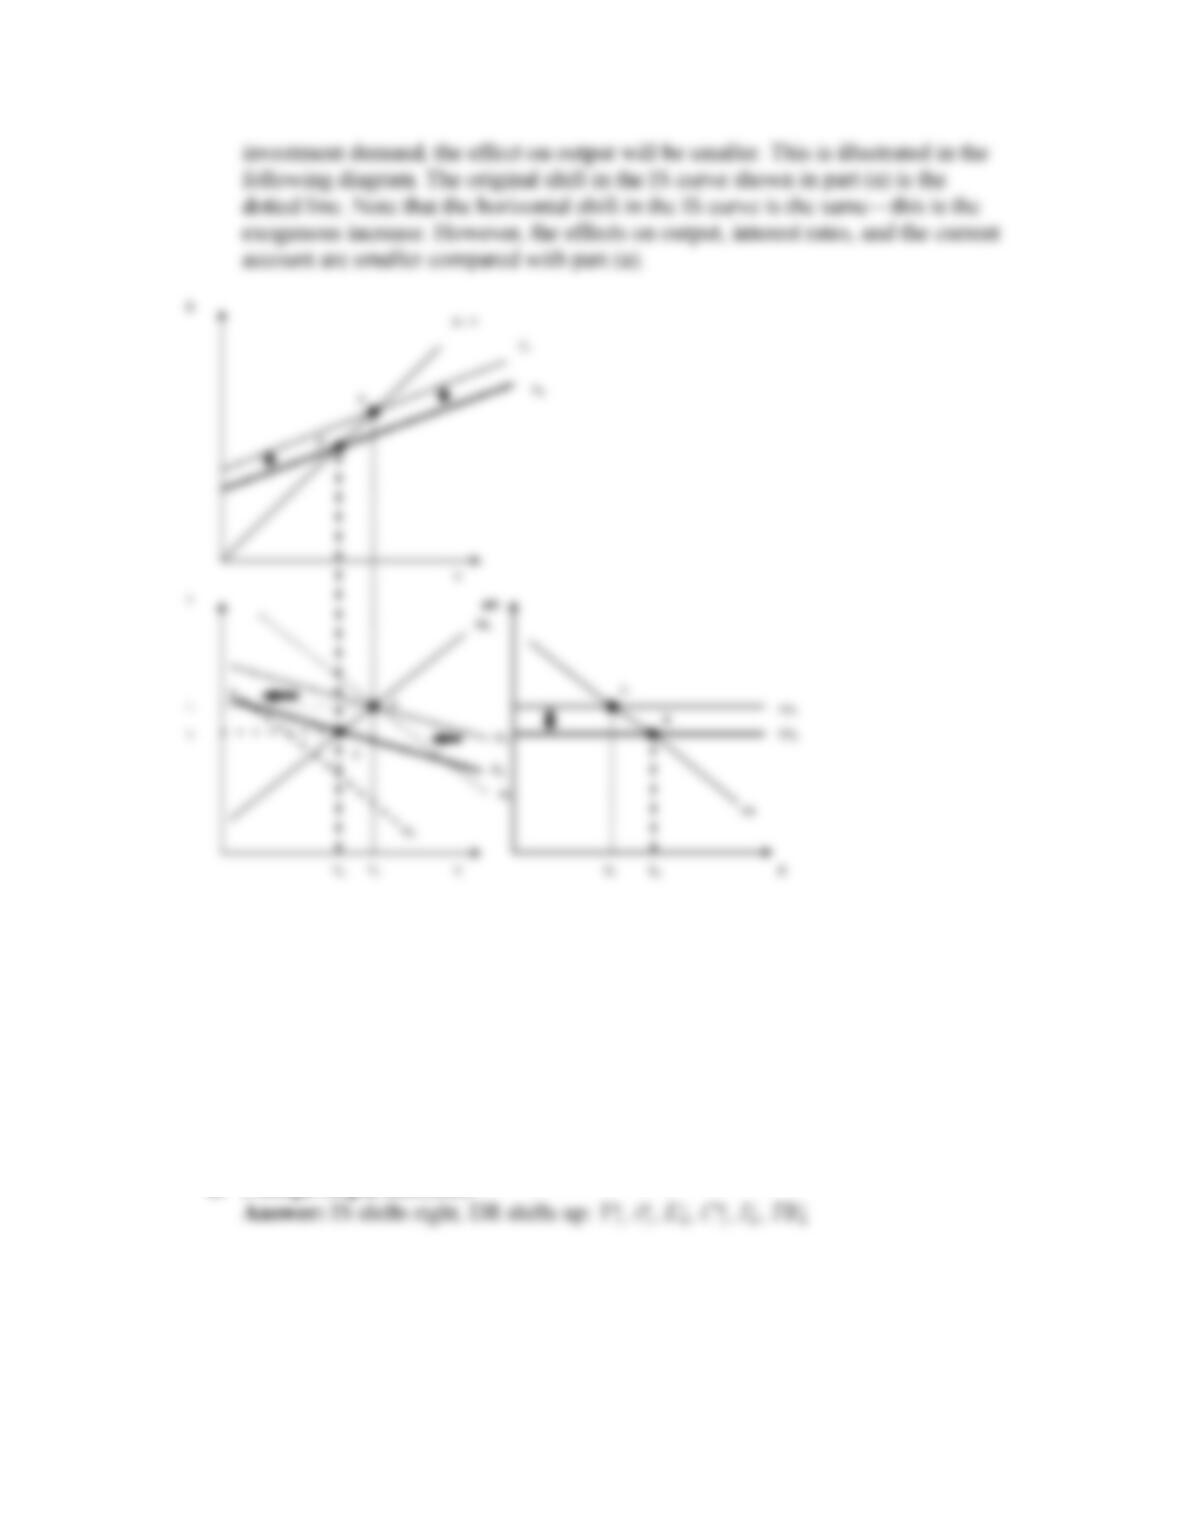
3. Suppose that American firms become more pessimistic and decide to reduce
investment expenditure today in new factories and office space.
a. How will this increase in investment affect output, interest rates, and the current
account?
Answer: This is an exogenous decrease in investment demand. This leads to an
increase in the demand for goods, shifting the IS curve to the right. This leads to a
b. Now repeat part (a), assuming that domestic investment is very responsive to the
interest rate so that U.S. firms will cancel most of their changes in investment
plans if the interest rate falls. How will this affect the answer you gave
previously?
Answer: If investment is very responsive to the interest rate, then this implies that
when interest rates rise, investment will decrease by a larger amount. For any
Work It Out
For each of the following situations, use the IS–LM–FX model to illustrate the effects of
the shock. For each case, state the effect of the shock on the following variables
(increase, decrease, no change, or ambiguous): Y, i, E, C, I, and TB. Note: In this
question, assume the government allows the exchange rate to float and makes no
policy response.
Hint: In each case, make use of the goods market equilibrium condition to understand
what happens to consumption, investment, and the trade balance in the shift from the
old to the new equilibrium.
a. Foreign output increases.
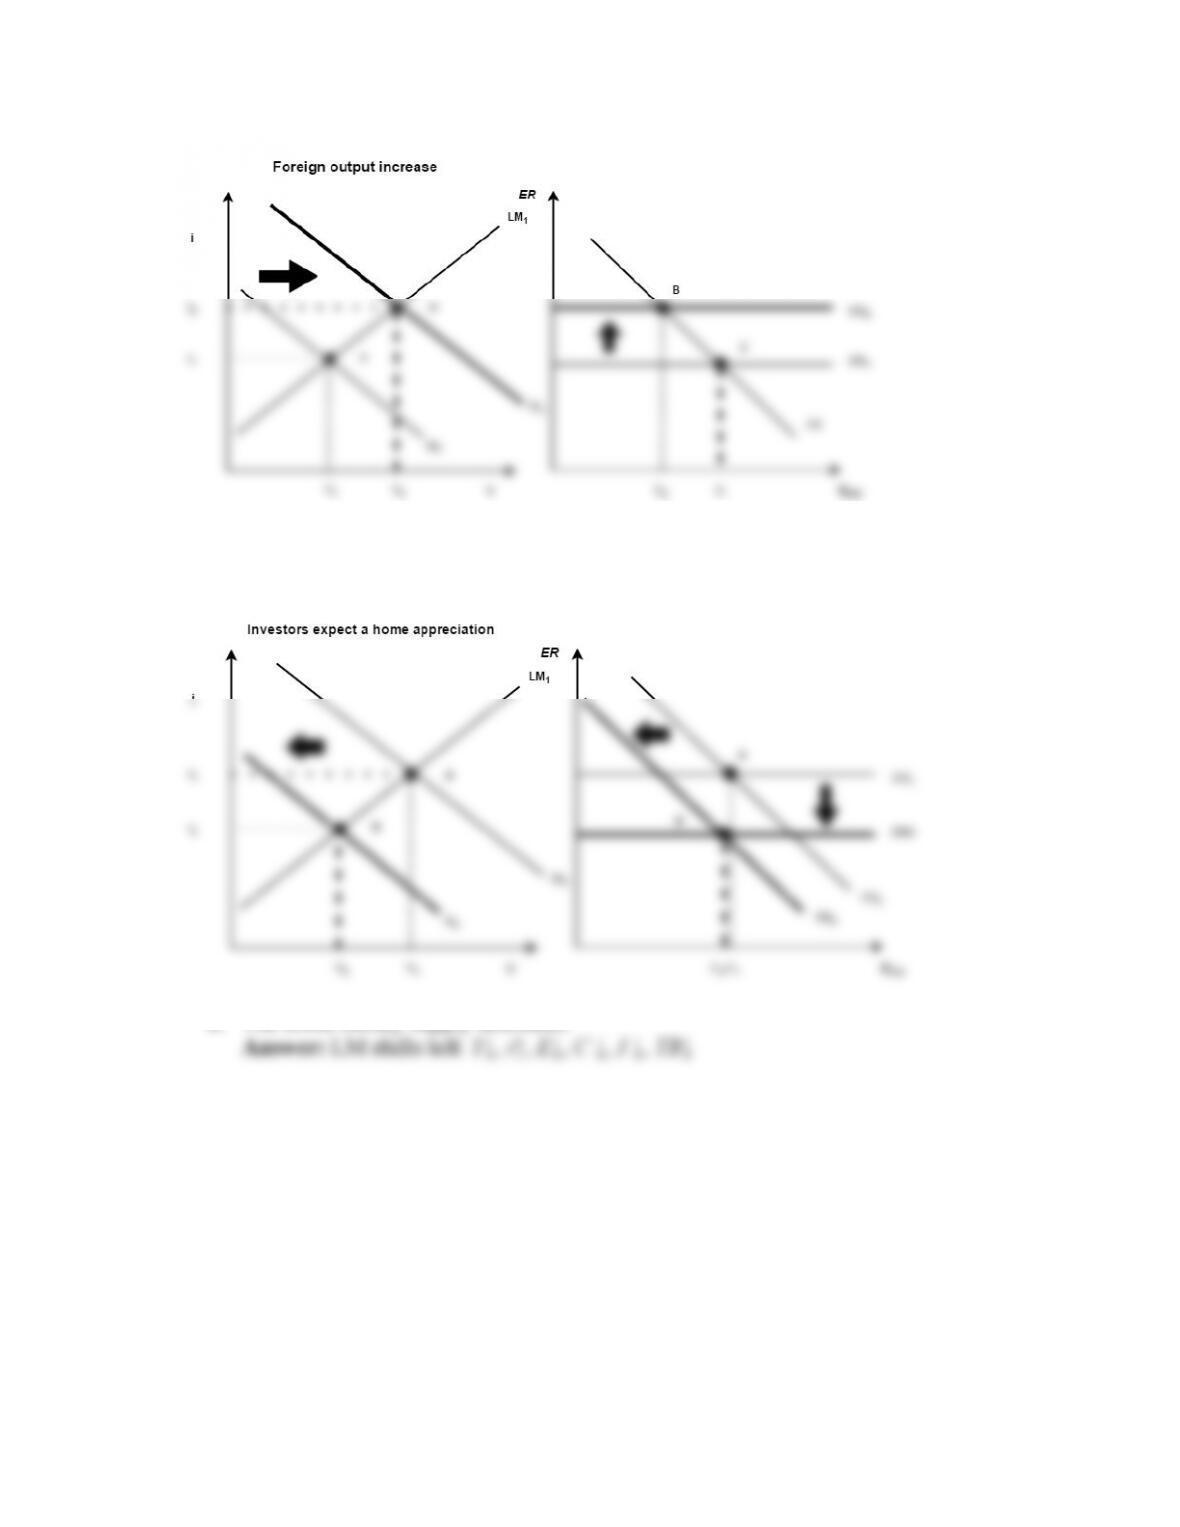
b. Investors expect an appreciation of the home currency in the future.
Answer: FR shifts left, IS shifts left, DR shifts down: Y ↓, i↓ , E↓ , C↓ , I ↑, TB↓
c. The home money supply decreases.
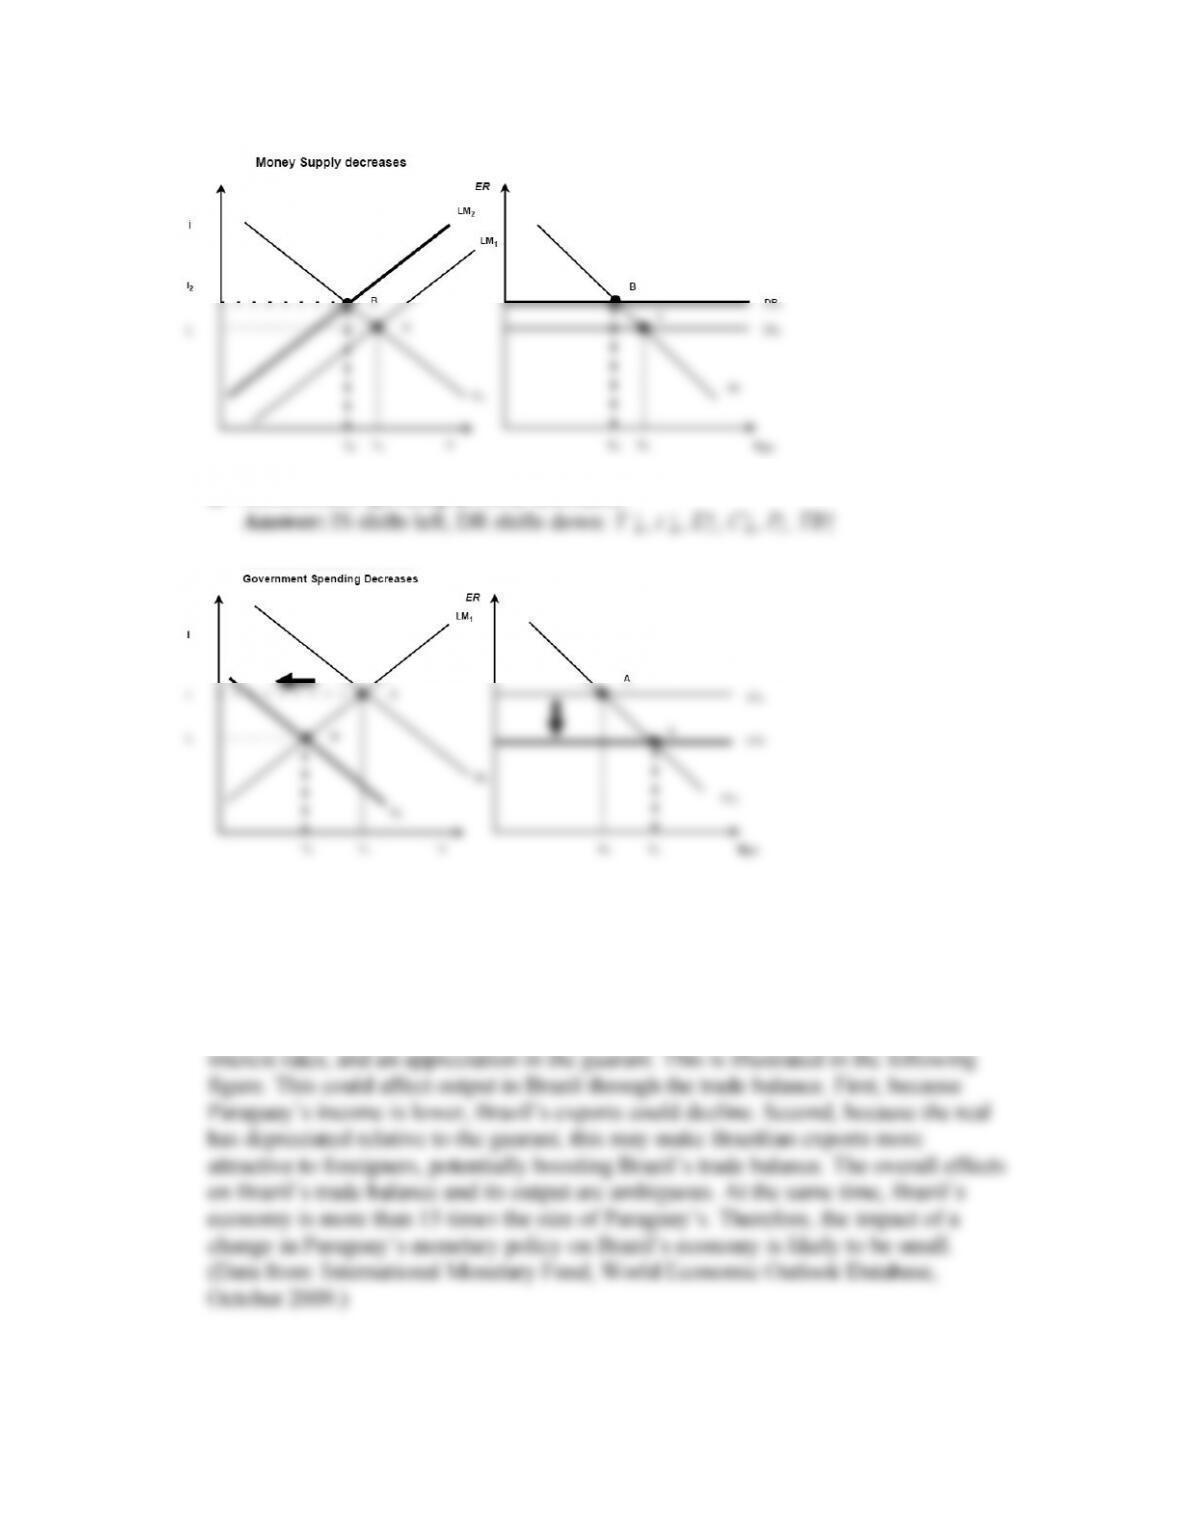
d. Government spending at home decreases.
4. How would a decrease in the money supply of Paraguay (currency unit: the guaraní)
affect its own output and its exchange rate with Brazil (currency unit: the real). Do
you think this policy in Paraguay might also affect output across the border in Brazil?
Explain.
Answer: A decrease in the real money supply leads to a leftward shift in the LM
curve. This leads to a decrease in Paraguay’s output, an increase in Paraguay’s
5. For each of the following situations, use the IS–LM–FX model to illustrate the effects
of the shock and the policy response. For each case, state the effect of the shock on
the following variables (increase, decrease, no change, or ambiguous): Y, i, E, C, I,
and TB. Note: In this question (unlike in the Work It Out question) assume that the
government allows the exchange rate to float but also responds by using monetary
policy to stabilize output.
Hint: In each case, make use of the goods market equilibrium condition to understand
what happens to consumption, investment, and the trade balance in the shift from the old
to the new equilibrium.
a. Foreign output increases.
Answer: IS shifts right, LM shifts left to stabilize Y: Y no change, i↑, E↓ , C no
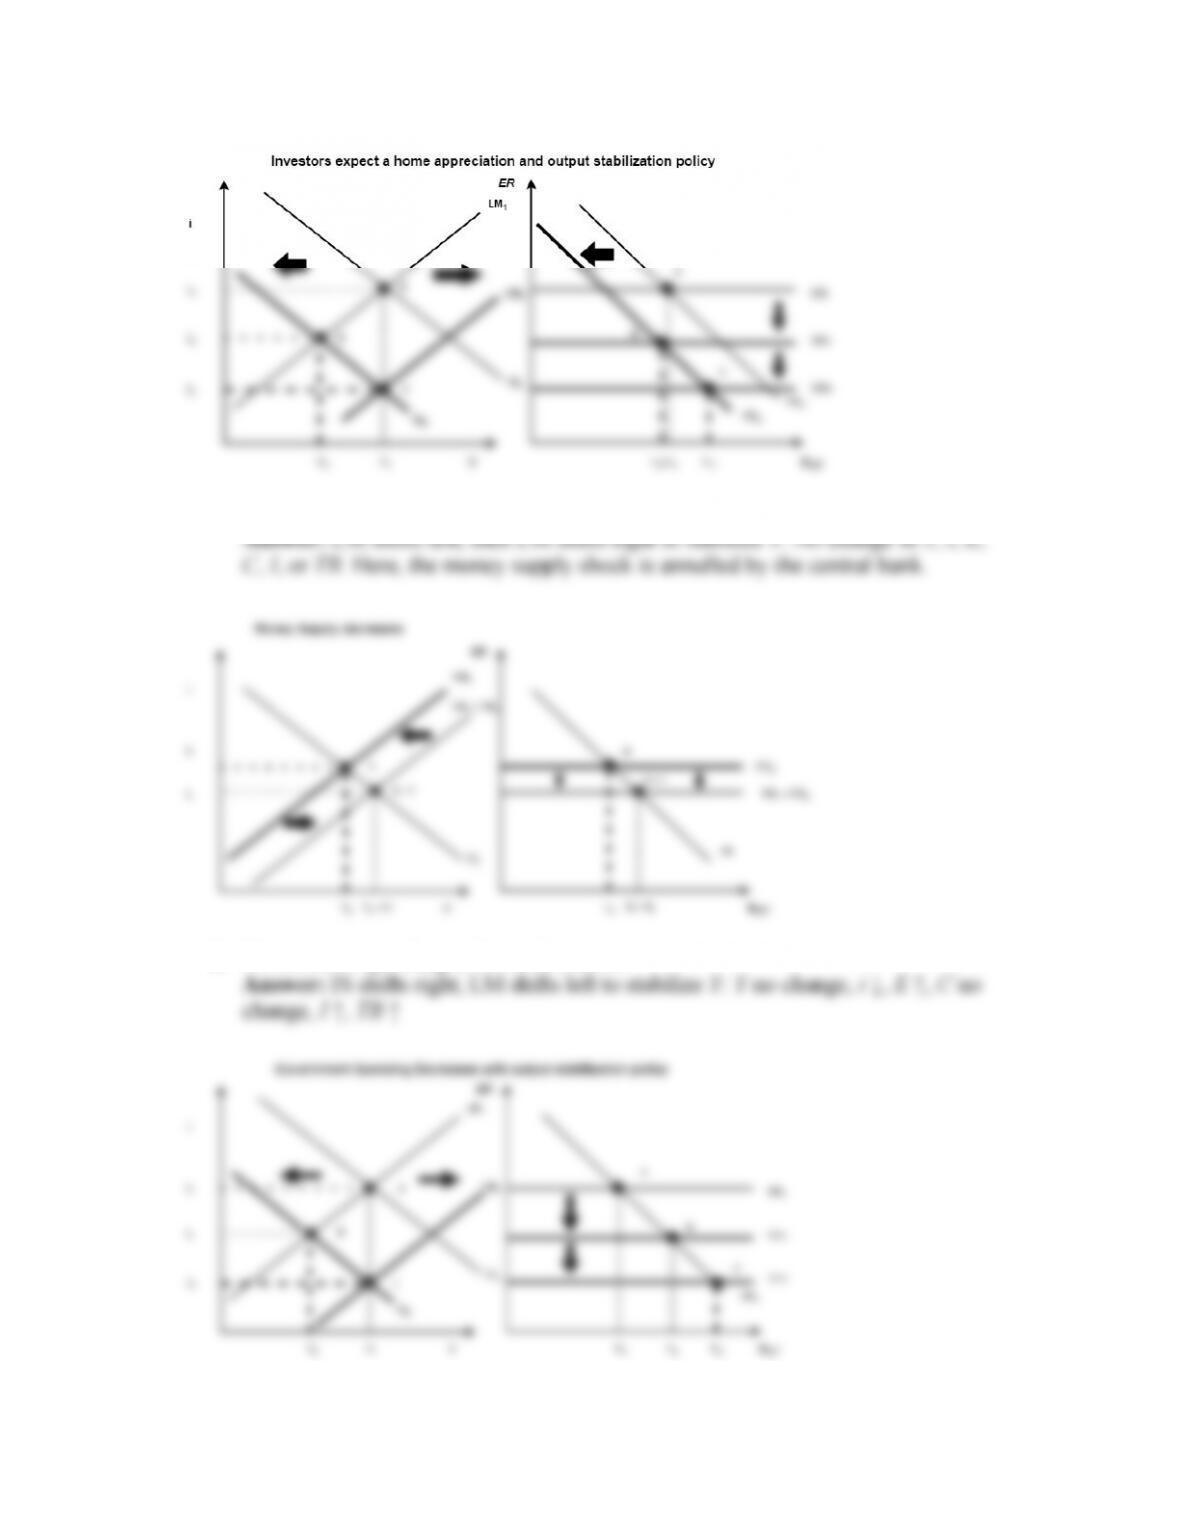
b. Investors expect an appreciation of the home currency in the future.
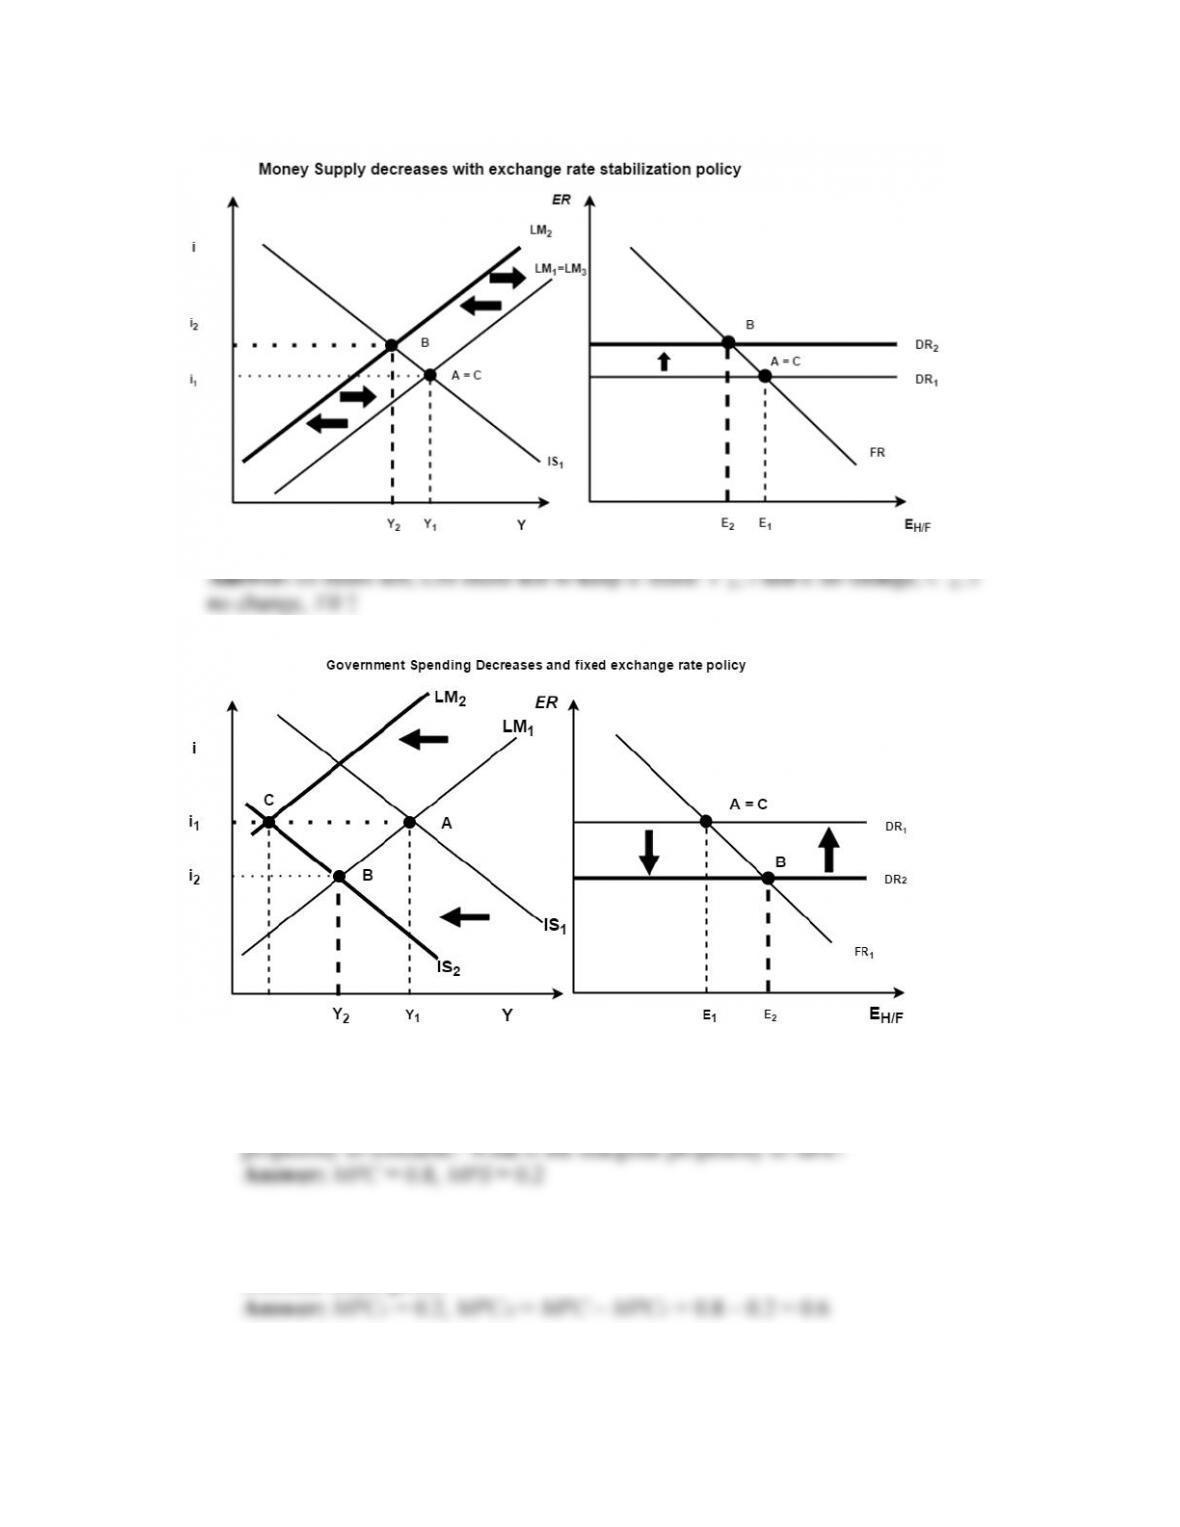
c. The home money supply decreases.
d. Government spending at home decreases.
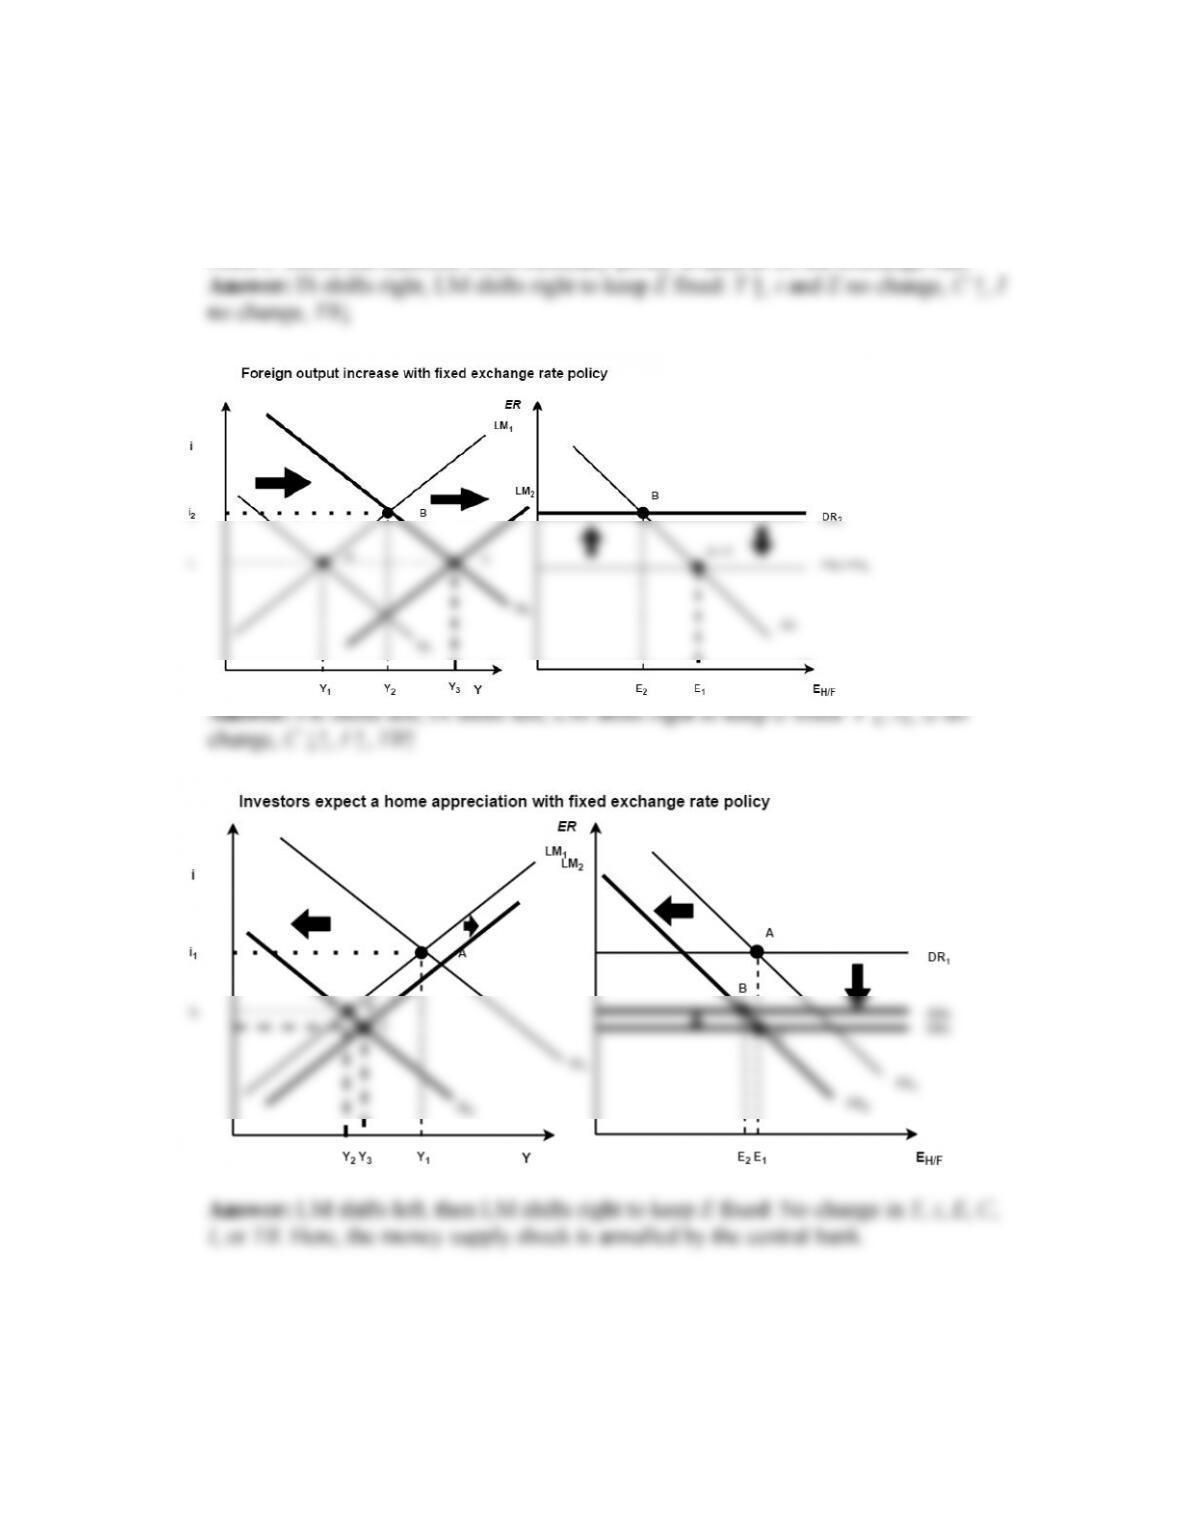
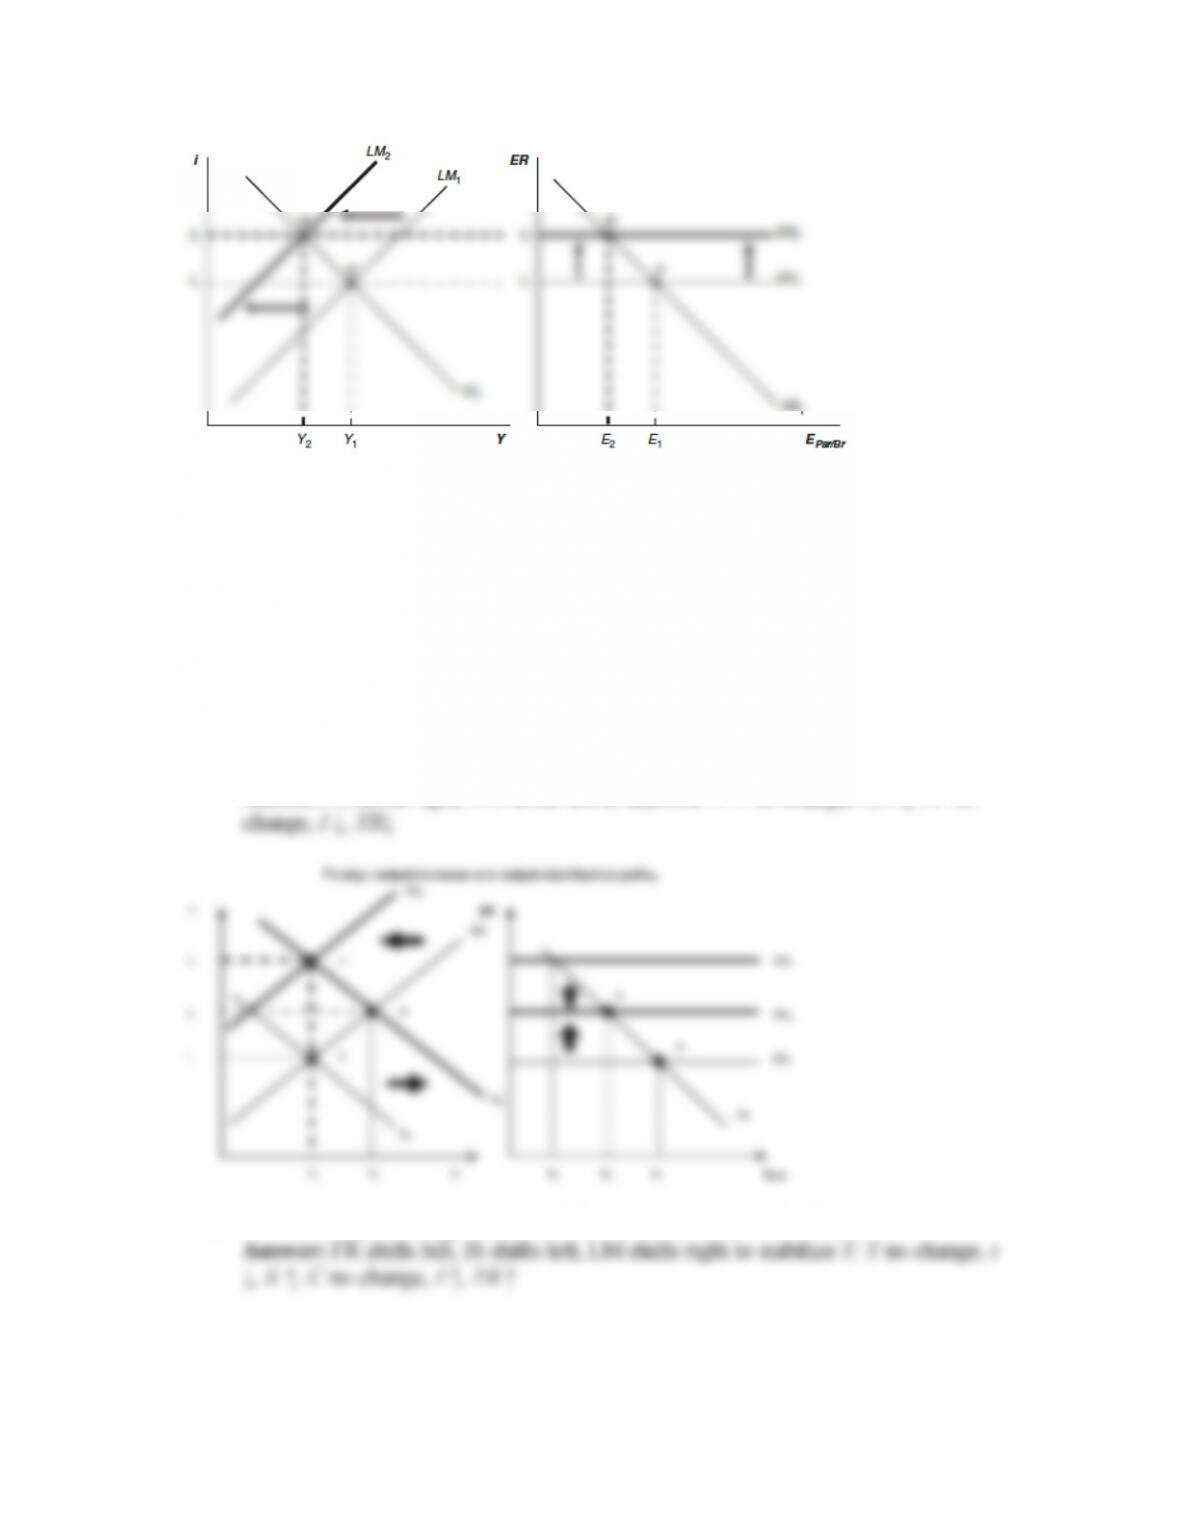
6. Repeat the previous question, assuming the central bank responds in order to maintain
a fixed exchange rate. In which case or cases will the government response be the
same as in the previous question?
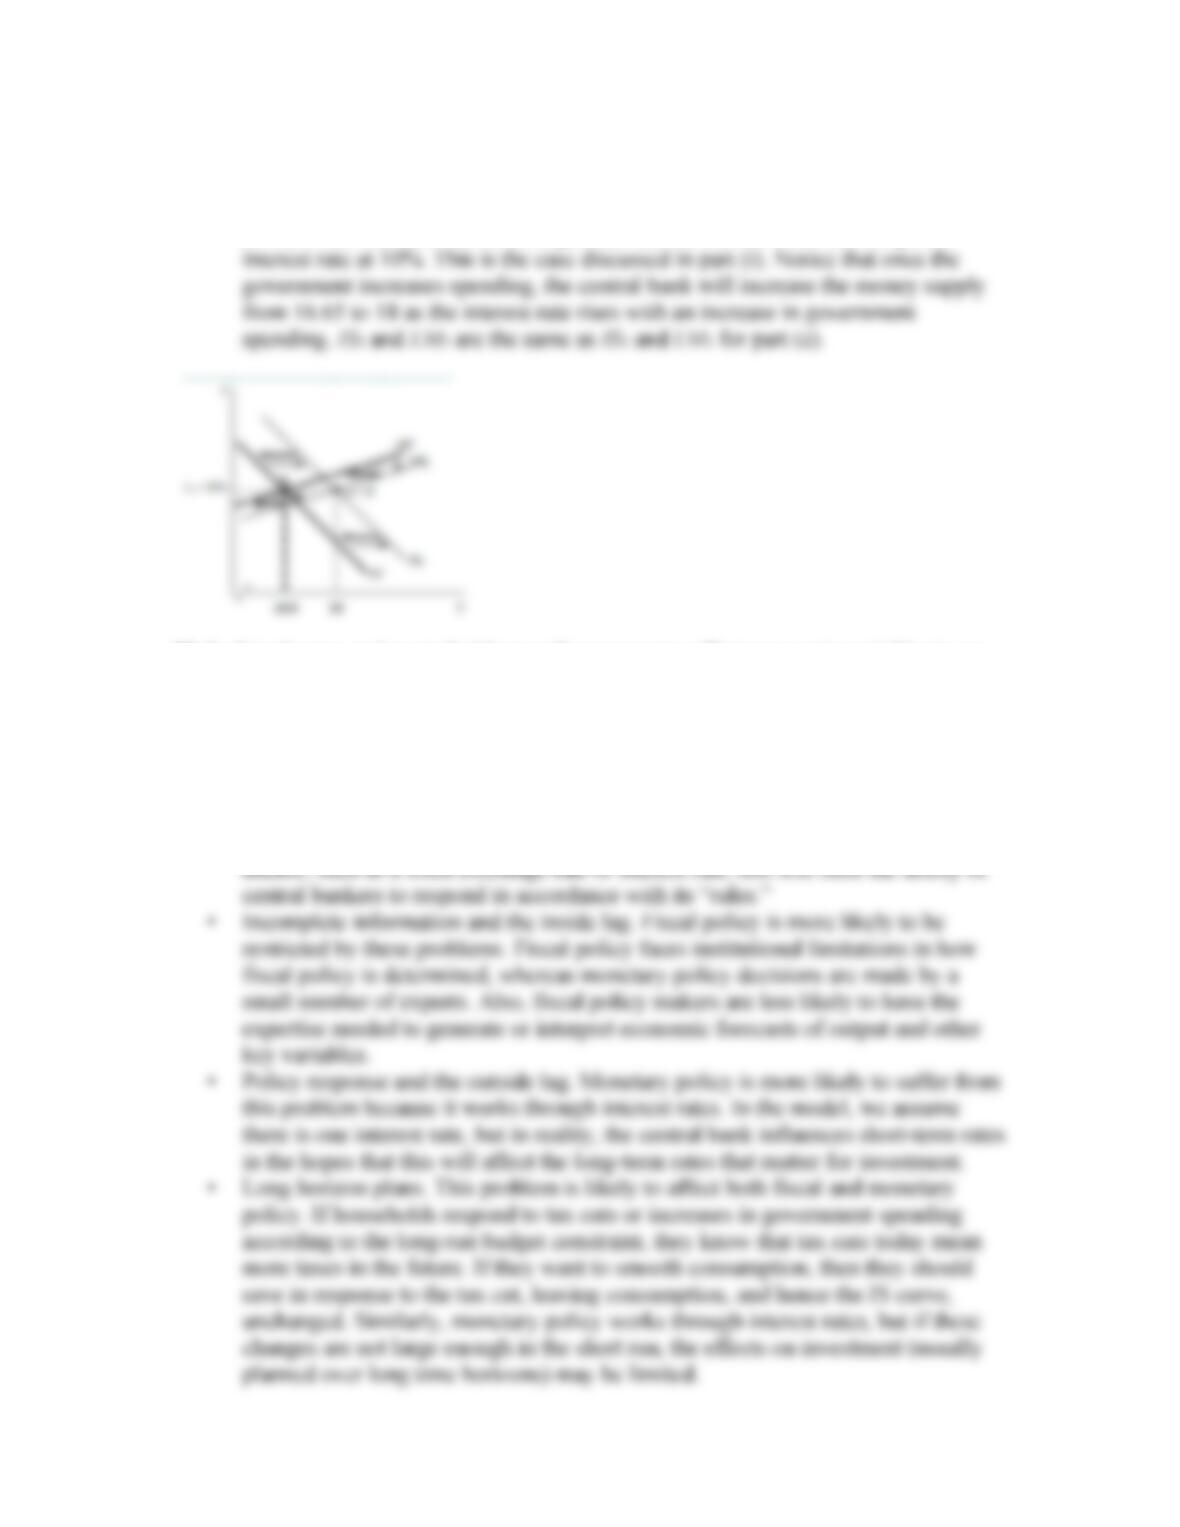
See the following diagrams. Point B is identical to the outcomes shown in Question 3.
Point C shows the outcome when monetary policy is used to fix the exchange rate.
7. This question explores IS and FX equilibria in a numerical example.
a. The consumption function is C = 1.5 + 0.8(Y – T). What is the marginal
b. The trade balance is TB = 5(1 – [1/E]) – 0.2(Y – 8). What is the marginal
propensity to consume foreign goods? What is the marginal propensity to
consume home goods?
c. The investment function is I = 3 – 10i. What is investment when the interest rate i
is equal to 0.10 = 10%?
d. Assume government spending is G. Add up the four components of demand and
write down the expression for D.
Answer: D = C + I + G + TB
e. Assume forex market equilibrium is given by i = ([1/E] – 1) + 0.15, where the two
foreign return terms on the right are expected depreciation and the foreign interest
rate. What is the foreign interest rate? What is the expected future exchange rate?
8. [More difficult] Continuing the last question, solve for the IS curve: obtain an
expression for Y in terms of i, G, and T (eliminate E).
Answer: Solve the UIP condition for E:
9. Assume that initially the IS curve is given by
IS1: Y = 22 – 1.5T – 30i + 2G
and that the price level P is 1, and the LM curve is given by
LM1: M = Y(1 – i)
The home central bank uses the interest rate as its policy instrument. Initially, the
home interest rate equals the foreign interest rate of 10% or 0.1. Taxes and
government spending both equal 2. Call this case 1.
a. According to the IS1 curve, what is the level of output Y? Assume this is the
desired full employment level of output.
b. According to the LM1 curve, at this level of output, what is the level of the home
money supply?
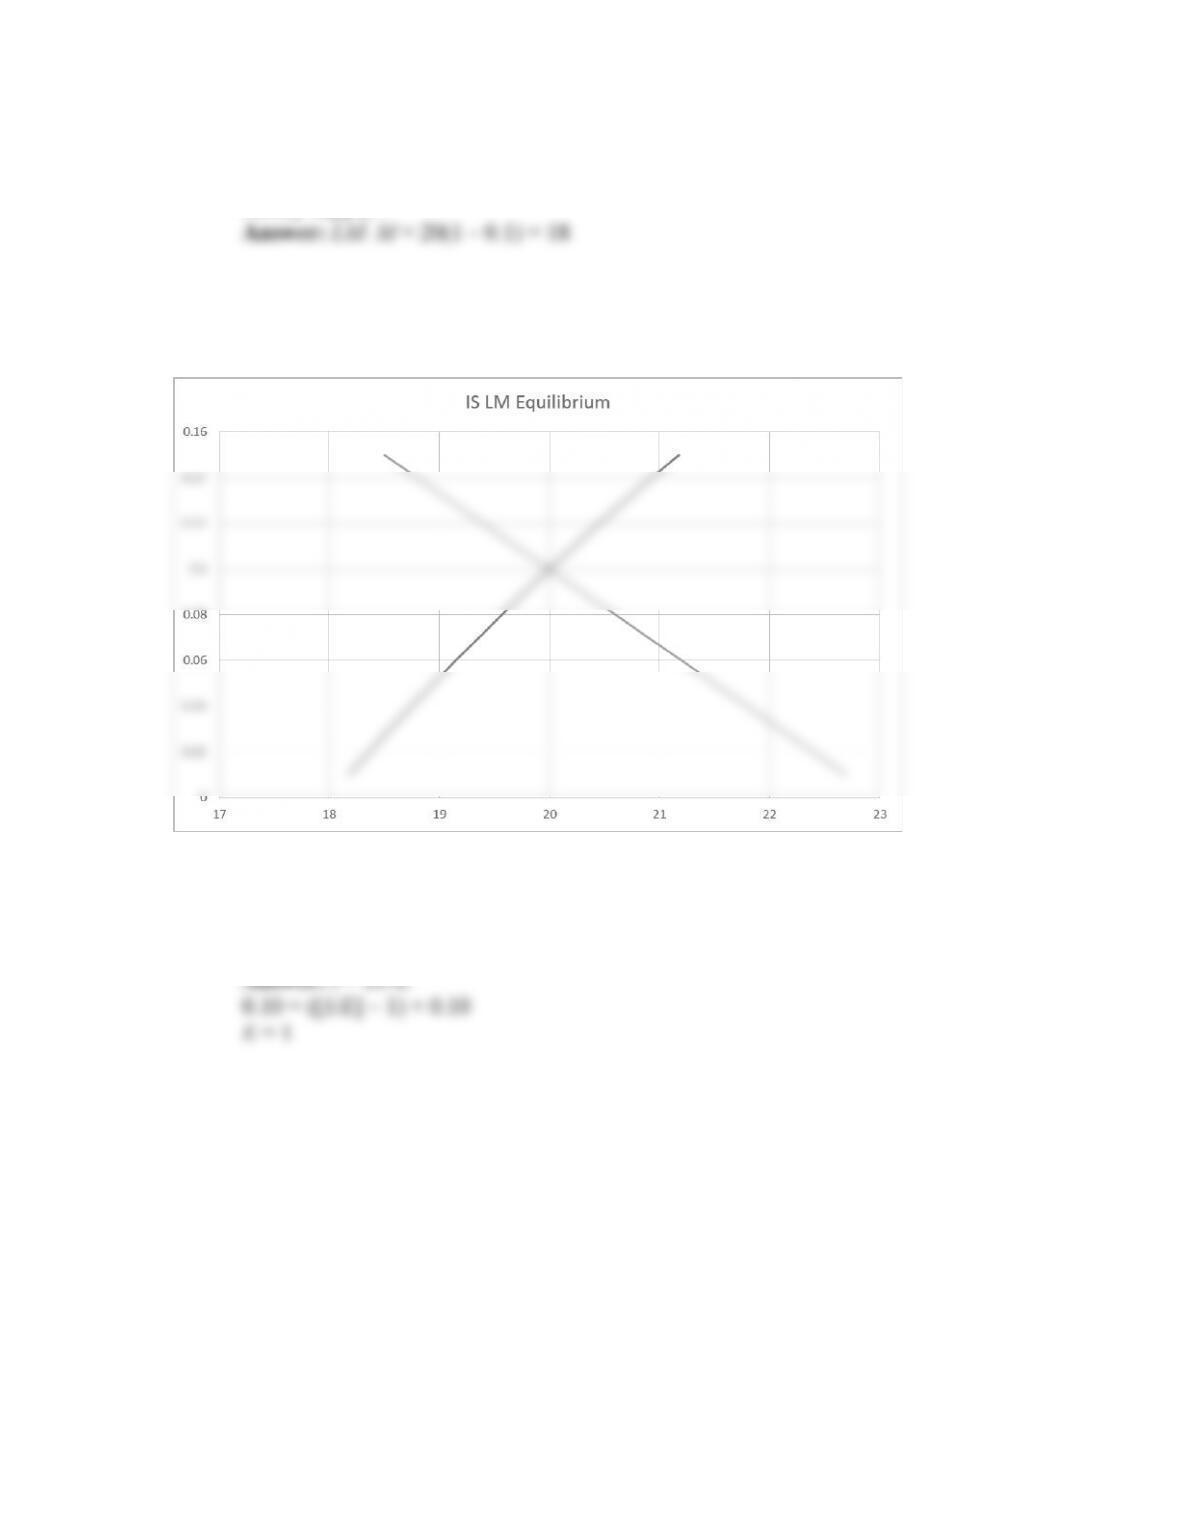
c. Plot the IS1 and LM1 curves for case 1 on a chart. Label the axes, and the
equilibrium values.
Answer: See the following diagram.
d. Assume that forex market equilibrium is given by i = ([1/E] – 1) + 0.10, where the
two foreign return terms on the right are expected depreciation and the foreign
interest rate. The expected future exchange rate is 1. What is today’s spot
exchange rate?
e. There is now a foreign demand shock, such that the IS curve shifts left by 1.5
units at all levels of the interest rate, and the new IS curve is given by
IS2: Y = 20.5 – 1.5T – 30i + 2G
The government asks the central bank to stabilize the economy at full
employment. To stabilize and return output back to the desired level, according to
this new IS curve, by how much must the interest rate be lowered from its initial
level of 0.1? (Assume taxes and government spending remain at 2.) Call this case
2.
Answer: Plug the desired value of output (Y = 20) into the new IS curve to find
the implied interest rate, i2:
f. At the new lower interest rate and at full employment, on the new LM curve
(LM2), what is the new level of the money supply?
Answer: Plug the output and interest rate from (e) into the LM curve to find M:
g. According to the forex market equilibrium, what is the new level of the spot
exchange rate? How large is the depreciation of the home currency?
Answer: Plug the new interest rate into the UIP condition:
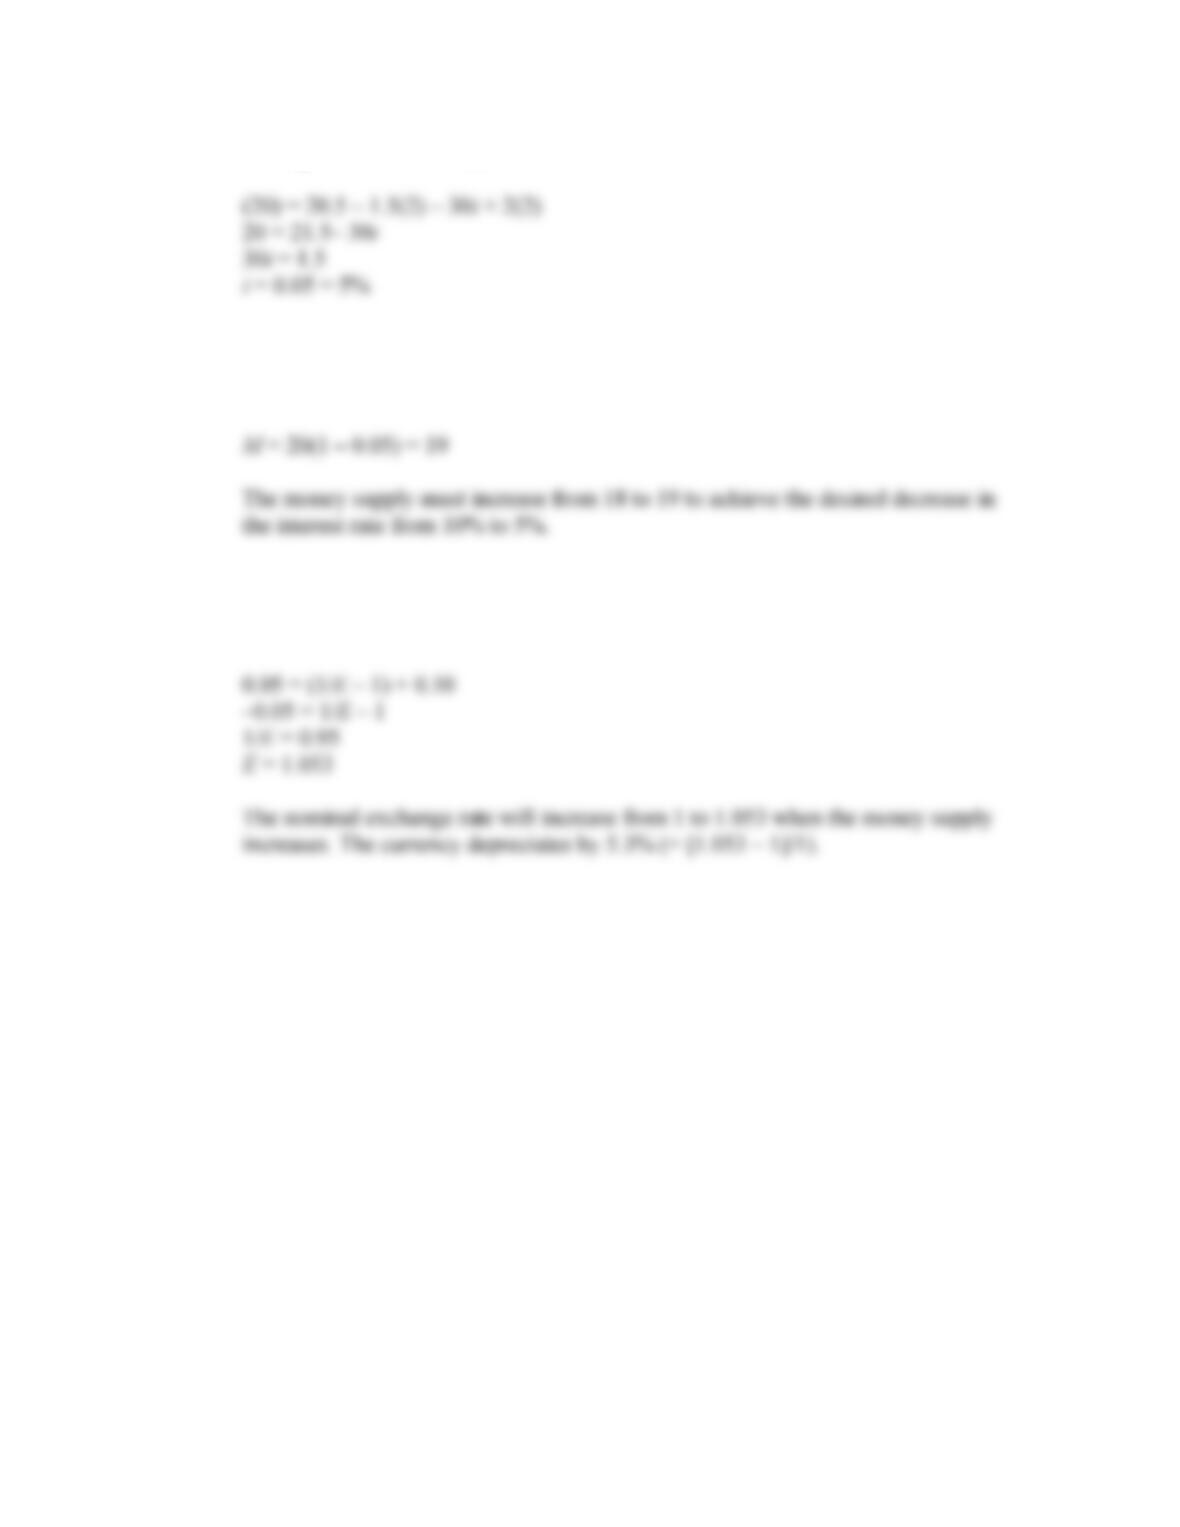
h. Plot the new IS2 and LM2 curves for case 2 on a chart. Label the axes, and the
equilibrium values.
Answer: See the diagram below.
IS–LM Equilibrium
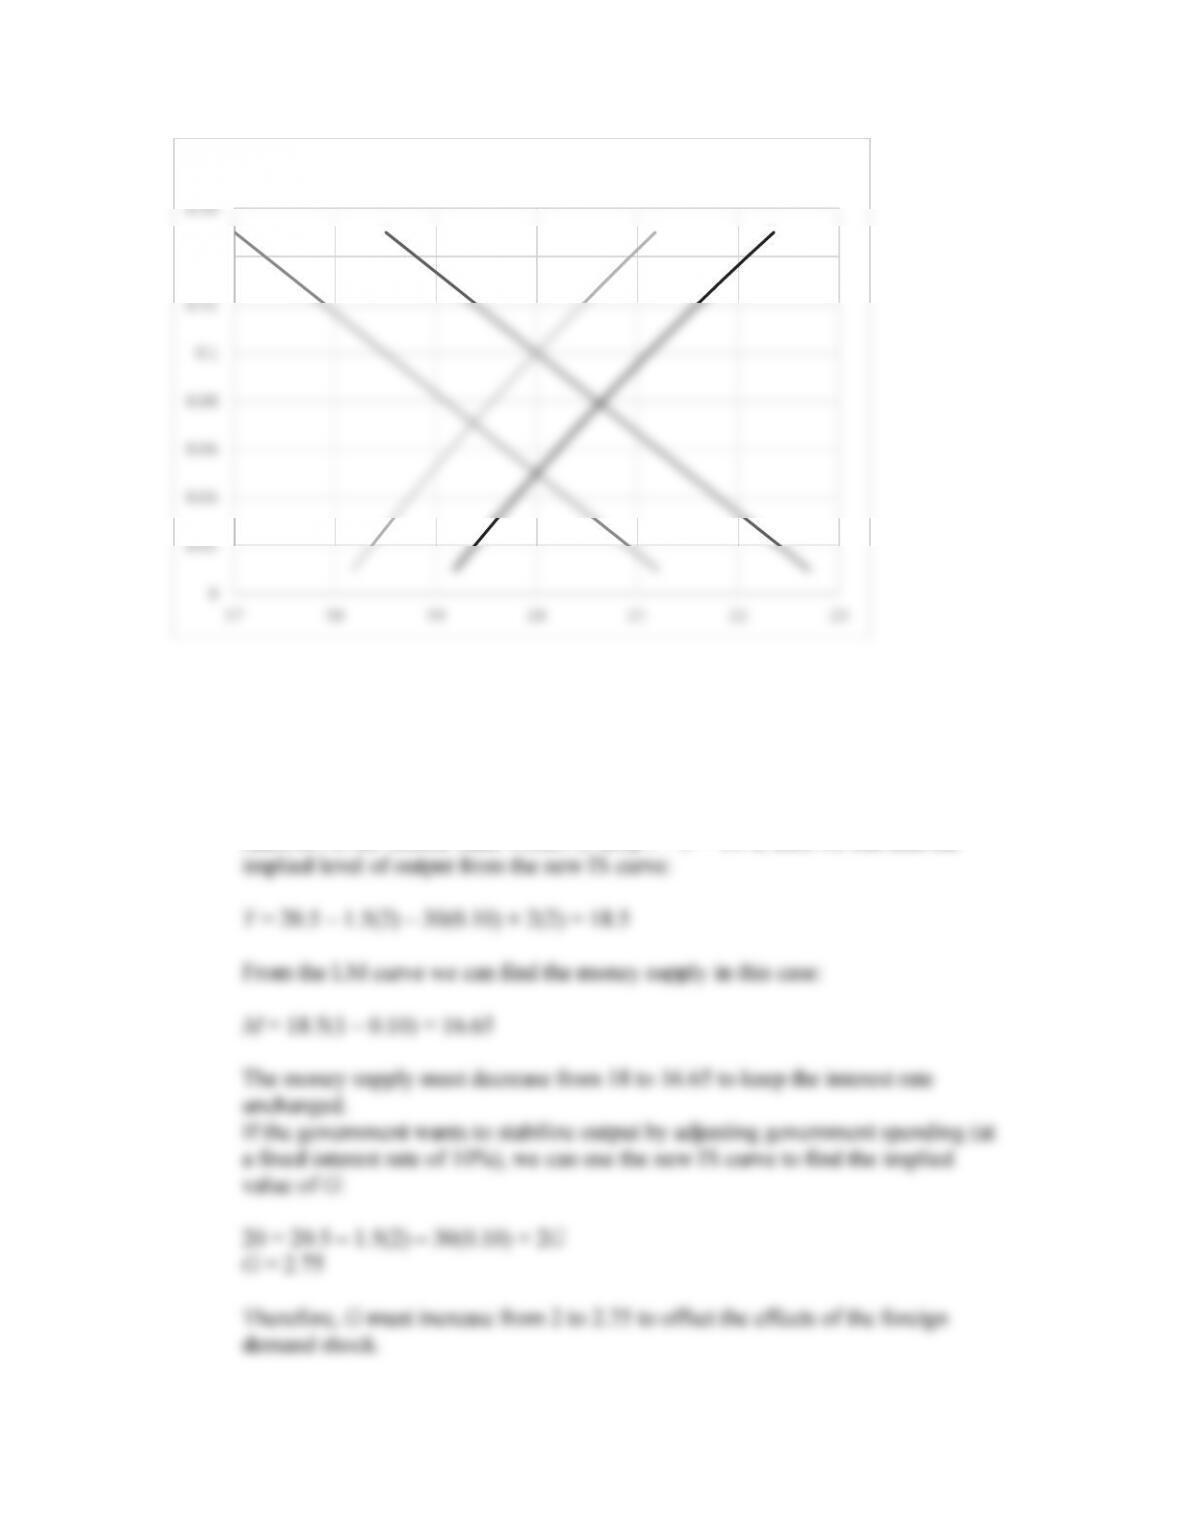
j. Plot the new IS3 and LM3 curves for case 3 on a chart. Label the axes, and the
equilibrium values.
Answer: See the figure below. IS’ and LM’ indicate the IS and LM curves when
IS curve has the same shock as in part (e) and the central bank still keeps the
10. In this chapter, we’ve studied how policy responses affect economic variables in an
open economy. Consider each of the problems in policy design and implementation
discussed in this chapter. Compare and contrast each problem as it applies to
monetary policy stabilization versus fiscal policy stabilization.
Answer: Consider the following limitations:
• Policy constraints. Depending on the exchange rate regime, these are more likely
to restrict monetary policy. Because monetary policy typically uses a nominal