
INTERNATIONAL ECONOMICS, 7TH EDITION
Study Resources: Questions for Study & Review
Chapter 18
1. Hong Kong managed to maintain its currency board during the East Asian crisis.
During the crisis Hong Kong had severe reserve outflows and then exorbitant interest
rates. Use the Mundell–Fleming model to show how that could occur. Start with a
balance-of-payments equilibrium. Draw a graph.
2. If a country with a fixed exchange rate has an outstanding reserve loan from the IMF,
what does the country need to do to repay it? Draw a graph of the exchange rate
market and of the Mundell–Fleming model.
3. Be an economic detective. How could the above country have ever been in need of
the reserve loan? Be specific. Use the Mundell–Fleming model and draw a graph.
4. You are a benevolent dictator in a small open economy with a massive government
deficit, capital controls, and a large balance-of-payments deficit. Given your fixed
exchange rate regime, describe the policies you can use to get the economy back to
an internal and external balance. Provide diagrams that show your starting point and
your final equilibrium.
5. Countries within the European Economic and Monetary Union have adopted a
common currency, the euro, and a common monetary policy dictated by the European
Central Bank. Can members raise their output using domestic fiscal and monetary
policies? Use graphs to explain both policies.
6. A small country, Pecunia, under a fixed exchange rate regime, has achieved both
internal (IS–LM intersection) and external balance. Pecunia trades a lot with the rest of
the world. Pecunia’s central bank does not sterilize, but it fears inflation. In addition,
Pecunia only allows limited access to its capital market while its citizens need
authorizations to invest abroad. The government plans to use fiscal policy (more
specifically government spending) to ease the inflationary pressures on its economy.
a. Spell out the policy carried out by the government.
b. Use a graph slowing the IS–LM–BP to illustrate the impact of the policy – point a is
the starting equilibrium. Show the shifts (if any) of the three curves IS–LM–BP
resulting from the fiscal policy adopted.
c. Break down the effect into two stages: (i) name the impact of the fiscal policy alone
point b, (ii) name the final equilibrium point c. What can you say about the balance
of payments in point b? Compare the level of income in a, b, and c.

7. A small country, Cascadia, has initially achieved internal and external balance.
International financial capital flows are high but not perfectly mobile. Cascadia
commits to a fixed exchange arrangement and defends it through intervention, but it
does not sterilize. Cascadia elects a new prime minister who happens to be an
excellent economist with an international reputation. As a result financial capital
inflows increase dramatically and remain higher.
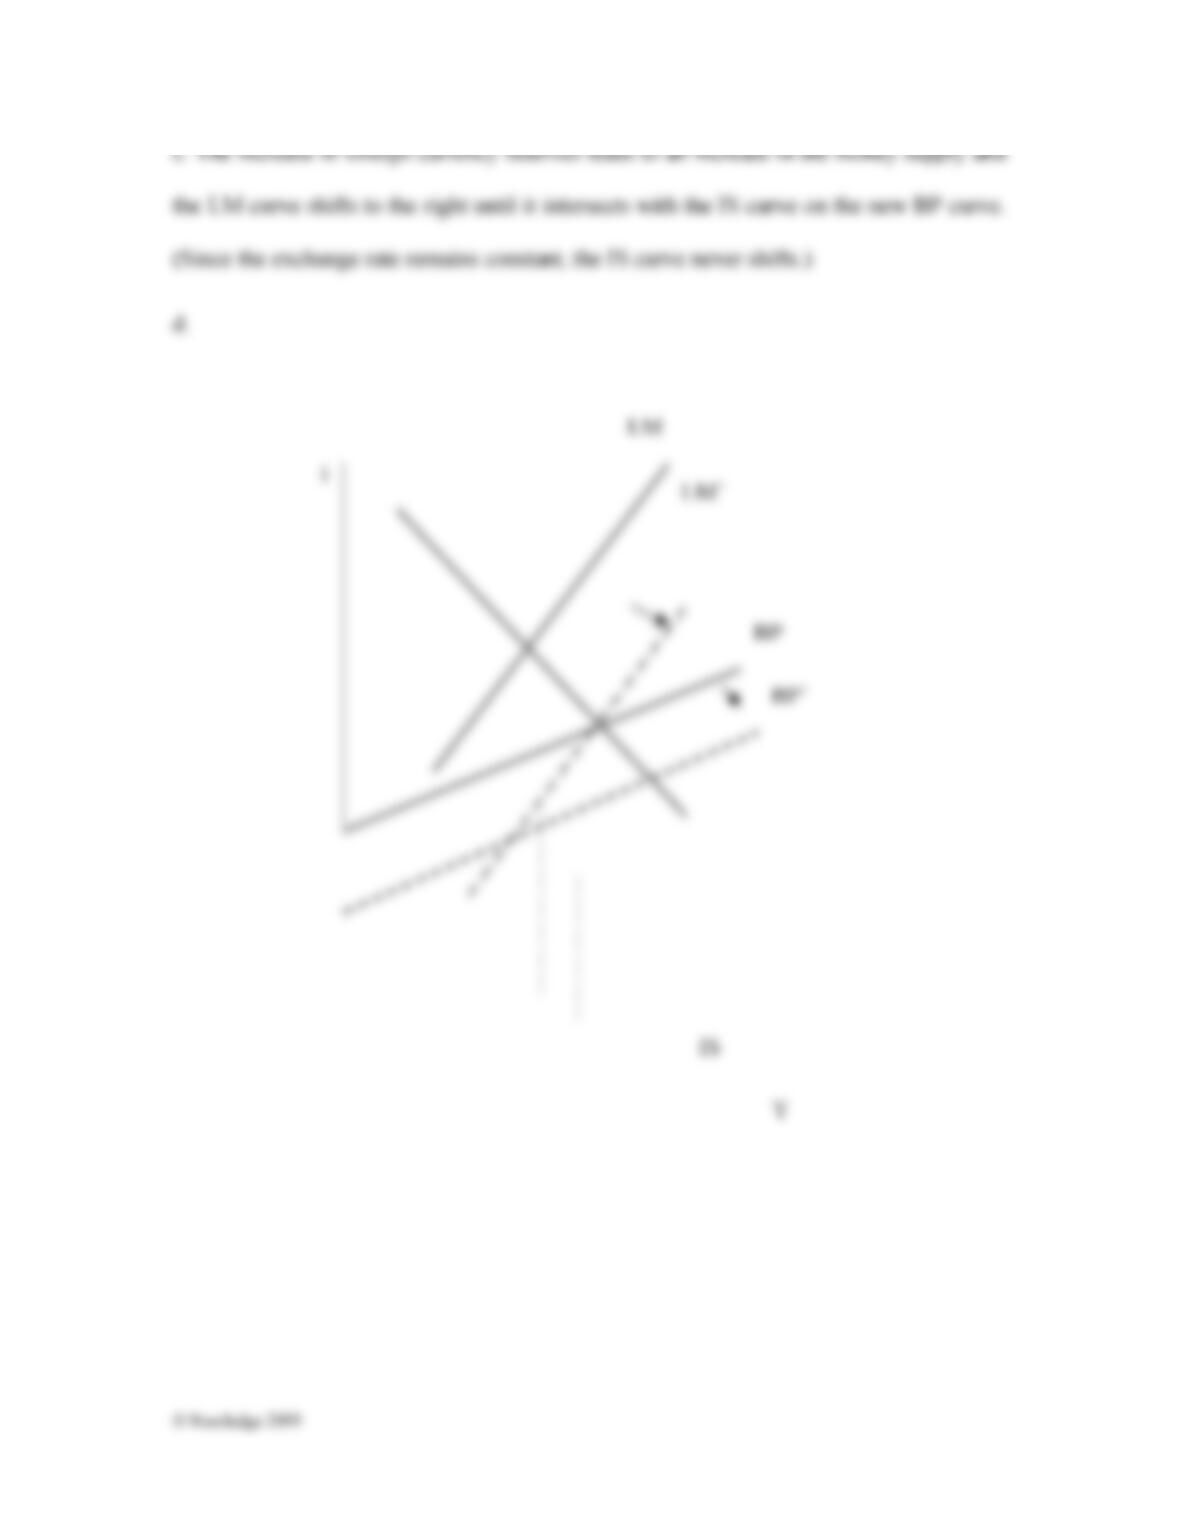
a. What shift occurs to the BP curve because of the increased capital inflows?
b. What intervention is necessary to defend the fixed exchange rate?
c. As a result, how does Cascadia adjust back to external balance? What is the effect
on its internal balance?
d. Show all your results on a IS–LM–BP graph.
8. A small country, Alpenstein, has initially achieved both internal and external balance.
Alpenstein prohibits international financial capital flows, so FA=0. Alpenstein has a
fixed exchange rate regime and defends it through official intervention; it does not
sterilize. An exogenous shock occurs: foreign demand for Alpenstein’s exports
increases.
a. What is the slope of the BP curve?
b. What shift(s) occur in the IS–LM–FE setup because of the increase in foreign
demand for its exports?
c. What intervention is necessary to keep the exchange rate fixed?
d. As a result, how does Alpenstein adjust back to external balance? What is the effect
on the internal balance?
e. Show all your results on a IS–LM–BP graph.
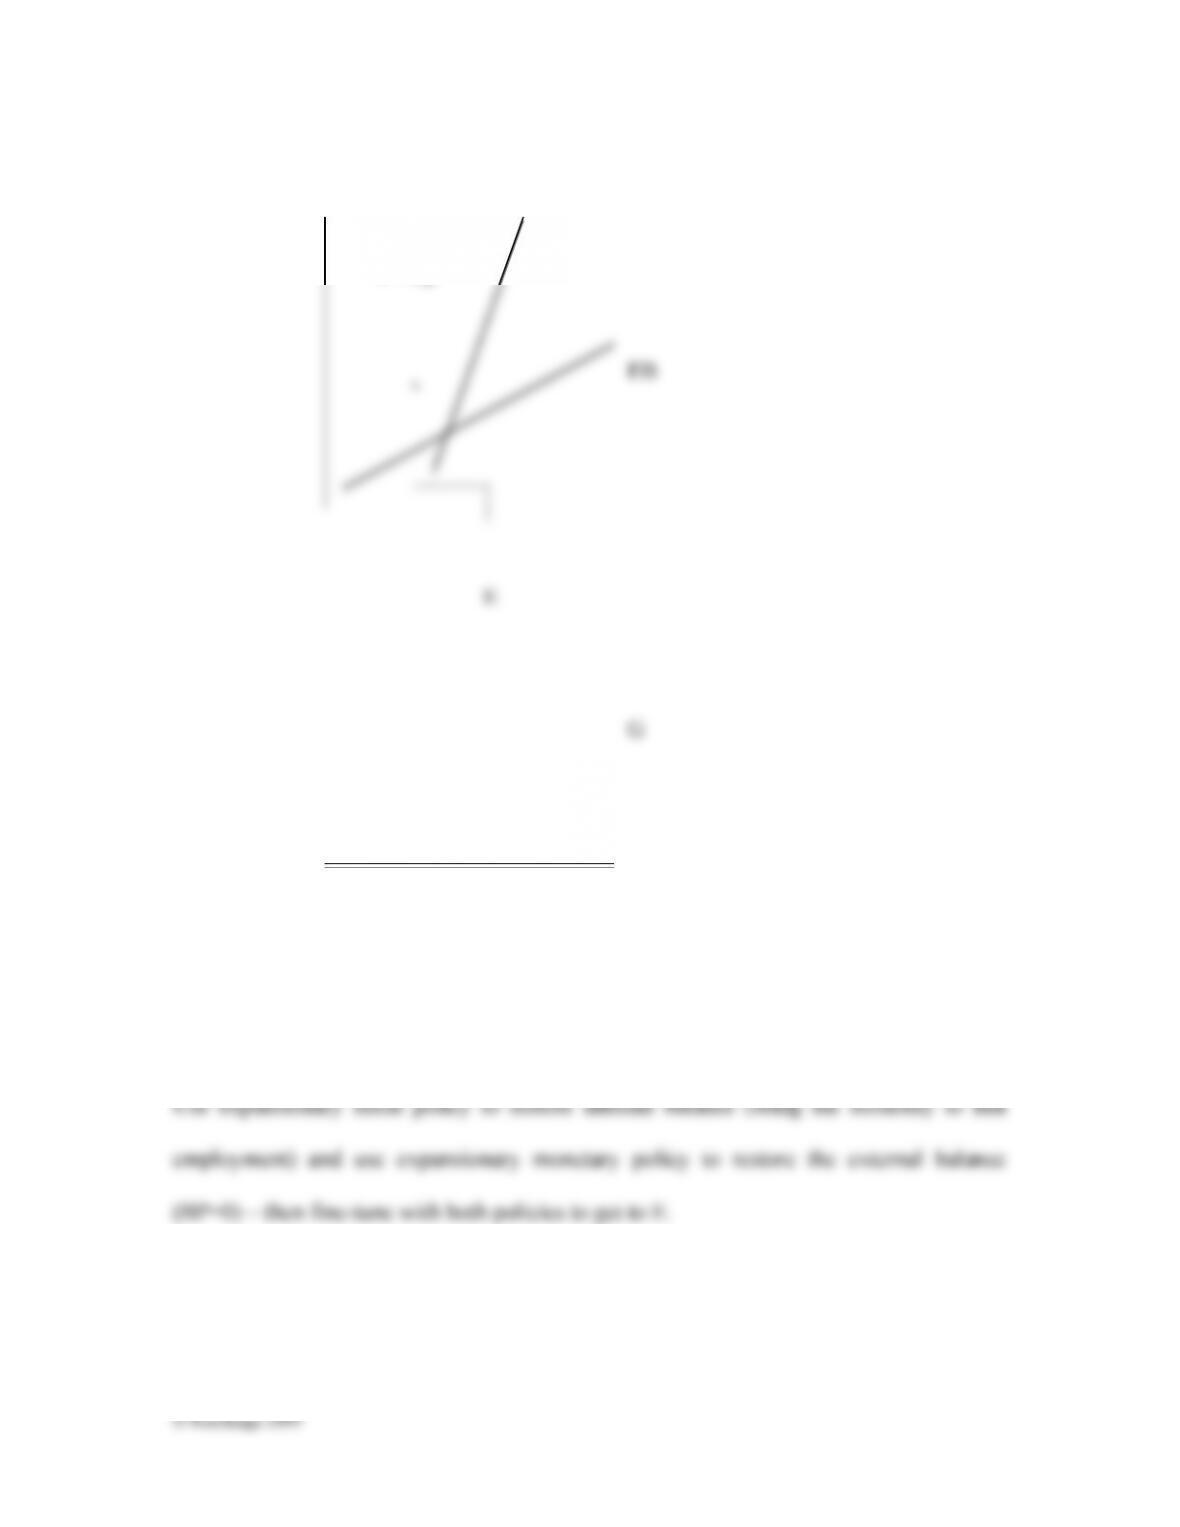
9. Use the policy mix graph to show how the policy makers can bring an economy with
balance-of-payments surpluses and unemployment to a stable level of output at full
employment.
INTERNATIONAL ECONOMICS, 7TH EDITION
Study Resources: Questions for Study & Review
Chapter 18: Answers
1.
3. The country must have weathered chronic balance of payment deficits. These deficits
5. The members of the European Monetary Union share the same monetary policy
dictated by the European Central Bank, so they cannot use monetary policy for domestic
i
LM
7.
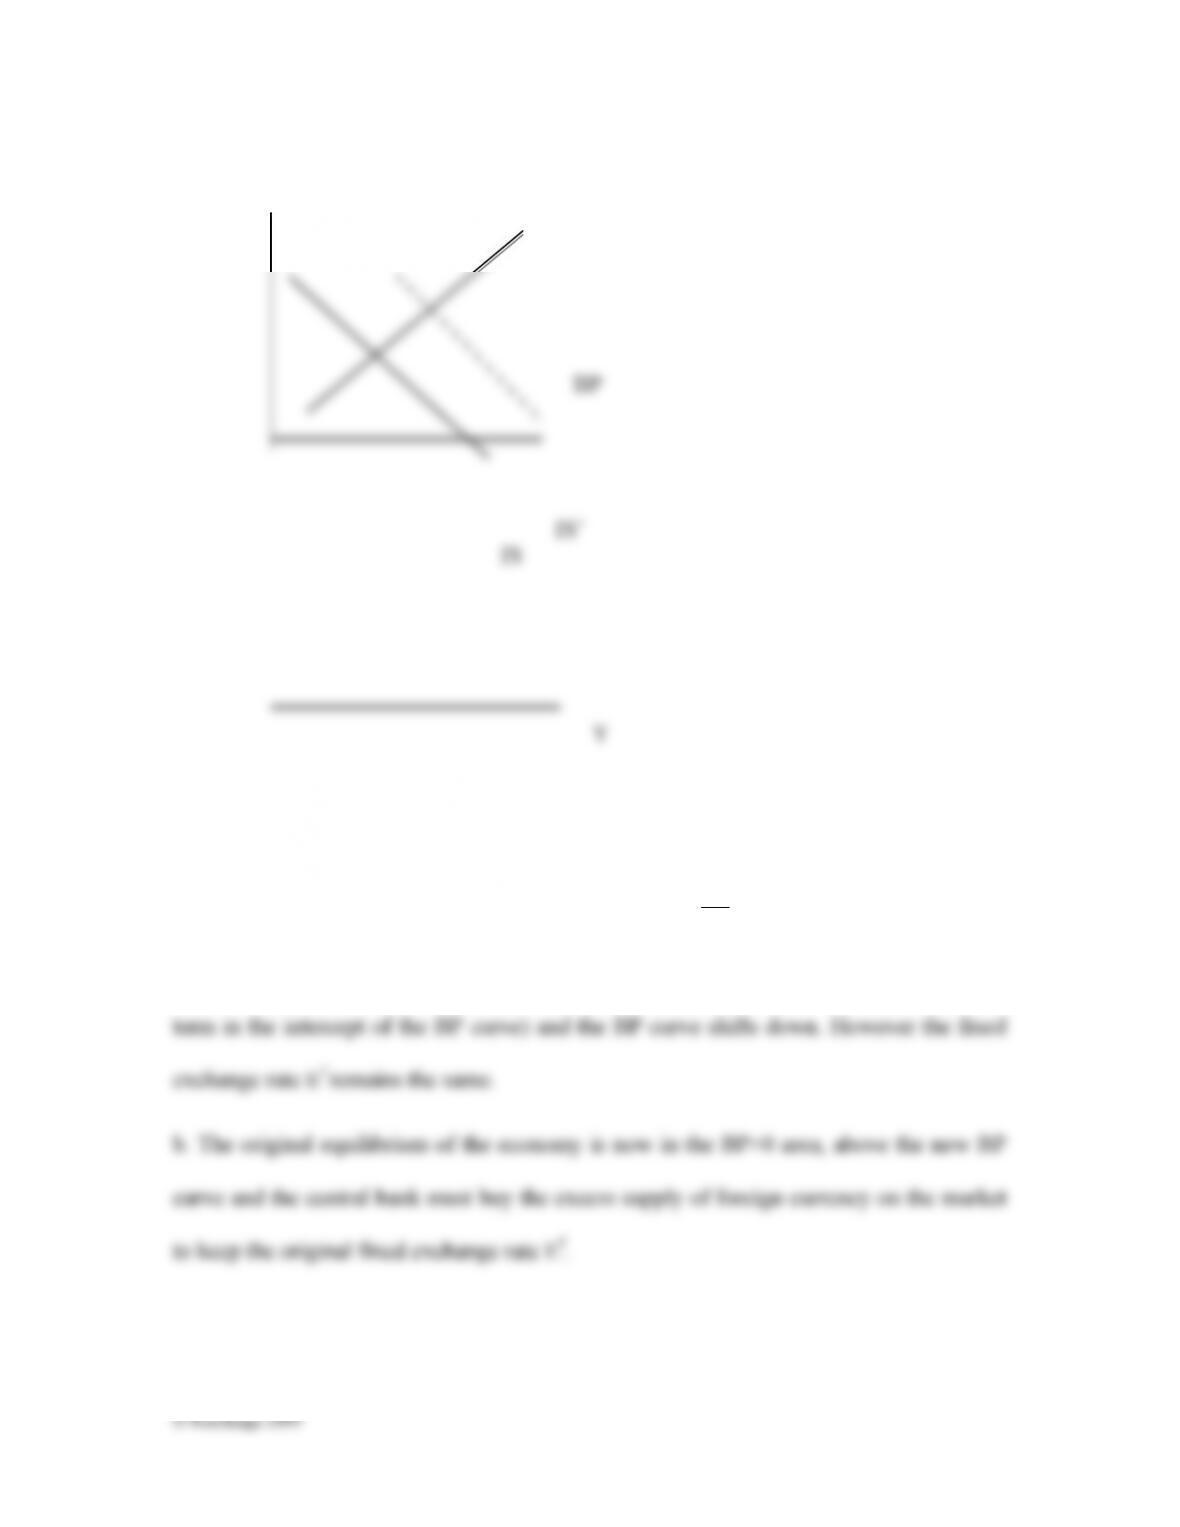
a. The financial account is specified with an intercept FA that can be construed as an
index of confidence in the economy. Basically this term increases (it enters as a negative

9.
i BP>0
Y<Yfe
IB