6 (17) Balance of Payments I: The Gains from Financial Globalization
1. Discovering Data Go to the BEA website (bea.gov). Find the latest annual balance of
payments data for the United States.
Answers will depend on the year of the data and the date retrieved. The following
answer is based on 2016 data that was downloaded in April 2017.
a. Compute income earned on (1) external assets and (2) income paid on external
liabilities.
b. Find the latest net international investment position data for the United States.
Compute (3) external assets and (4) external liabilities for the end of the prior
year.
c. Divide (1) by (3) and then divide (2) by (4) to find the implied rates of interest on
external assets and liabilities. Is the United States still privileged?
2. Using the notation from the text, answer the following questions. You may assume
that net labor income from abroad is zero, there are no capital gains on external wealth,
and there are no unilateral transfers.
a. Express the change in external wealth (∆W0) at the end of period 0 as a function
of the economy’s trade balance (TB), the real interest rate (a constant, r*), and
initial external wealth (W−1).
b. Using (a), write an expression for the stock of external wealth at the end of period
0 (W0). This should be written as a function of the economy’s trade balance (TB0),
the real interest rate, and initial external wealth (W−1).
Answer: Rewriting the previous expression, solving for W0:
c. Using (a) and (b), write an expression for the stock of external wealth at the end
of period 1 (W1). This should be written as a function of the economy’s trade
balance (TB) each period, the real interest rate, and initial external wealth (W−1).
Answer: From (a), we know that the change in wealth in period 1 is equal to the
trade balance in period 1 plus interest earned on external wealth from period 0:
d. Using your answers from (a), (b), and (c), write an expression for the stock of
external wealth at the end of period 2 (W2). This should be written as a function of
the economy’s trade balance (TB) each period, the real interest rate, and initial
external wealth (W−1).
Answer: Using the same method from (c) to solve for W2:
e. Suppose we require that W2 equal zero. Write down the condition that the three
trade balances (in periods 0, 1, and 2) must satisfy. Arrange the terms in present
value form.
Answer: If W2 = 0, then
3. Using the assumptions and answers from the previous question, complete the
following:
a. Write an expression for the future value of the stock of external wealth in period
N (WN). This should be written as a function of the economy’s trade balance (TB)
each period, the real interest rate r*, and initial external wealth.
Answer: The future value of external wealth in period N is the sum of the trade
b. Using the answer from (a), write an expression for present value of the stock of
external wealth in period N (WN).
Answer: In present value terms, divide both sides of the previous expression by
c. The “no Ponzi game” conditions force the present value of WN to tend to zero as N
gets large. Explain why this implies that the economy’s initial external wealth is
equal to the present value of future trade deficits.
Answer: The “no Ponzi game” condition means that the county cannot have
negative or positive external wealth as N gets large (in the limit, N → ∞):
d. How would the expressions in (a) and (b) change if the economy had net labor
income (positive or negative) to or from abroad or net unilateral transfers?
Explain briefly.
Answer: Net labor income to or from abroad would affect the stock of external
wealth each period through changing the NFIA from NFIA = r*W0 (with only
4. In this question assume all dollar units are real dollars in billion; for example, $150
means $150 billion. It is year 0. Argentina thinks it can find $150 of domestic
investment projects with a marginal product of capital (MPK) equal to 10% (each $1
invested in year 0 pays off $0.10 in every later year). Argentina now invests $105 in
year 0 by borrowing $105 from the rest of the world at a world real interest rate r* of
5%. There is no further borrowing or investment after this.
Use the standard assumptions: Assume initial external wealth W (W in year −1) is 0.
Assume G = 0 always; and assume I = 0 except in year 0. Also, assume NUT = KA =
0 and that there is no net labor income so NFIA = r*W.
The projects start to pay off in year 1 and continue to pay off all years thereafter.
Interest is paid in perpetuity, in year 1 and every year thereafter. In addition, assume
that if the projects are not done, then GDP = Q = C = $200 in all years, so that PV(Q)
= PV(C) = 200 + 200/0.05 = 4,200.
a. Should Argentina fund the $105 worth of projects? Explain your answer.
Answer: Yes. The criterion for undertaking an investment project is:
b. Why might Argentina be able to borrow only $105 and not $150?
Answer: Argentina may face borrowing limits. Because 150 units of output
c. From this point forward, assume the projects totaling $105 are funded and
completed in year 0. If the MPK is 10%, what is the total payoff from the projects
in future years?
d. Assume this payoff is added to the $200 of GDP in all years starting in year 1. In
dollars, what is Argentina’s Q = GDP in year 0, year 1, and later years?
e. At year 0, what is the new PV(Q) in dollars? Hint: To ease computation, calculate
the value of the increment in PV(Q) due to the extra output in later years.
Answer: The present value of the increment in PV(Q) due to the extra output
f. At year 0, what is the new PV(I) in dollars? Therefore, what does the LRBC say is
the new PV(C) in dollars?
Answer: The present value of investment is:
g. Assume that Argentina is consumption smoothing. What is the percent change in
PV(C)? What is the new level of C in all years? Is Argentina better off?
Answer: The percent change in the present value of consumption (compared with
the case with no investment project) is 2.5% (= 4,305 − 4,200)/4,200). The new
level of consumption in all years is:
h. For the year the projects go ahead, year 0, explain Argentina’s balance of
payments as follows: State the levels of CA, TB, NFIA, and FA.
Answer: In year 0, the values are as follows:
i. What happens in later years? State the levels of CA, TB, NFIA, and FA in year 1
and every later year.
Answer: In subsequent years, the values are as follows:
5. Continuing from the previous question, we now consider Argentina’s external wealth
position.
a. What is Argentina’s external wealth W in year 0 and later? Suppose Argentina has
a one-year debt (i.e., not a perpetual loan) that must be rolled over every year.
After a few years, in year N, the world interest rate rises to 15%. Can Argentina
stick to its original plan? What are the interest payments due on the debt if r* =
15%? If I = G = 0, what must Argentina do to meet those payments?
Answer: Argentina borrows $110 in year 0, so its external wealth is −$110 in
b. Suppose Argentina decides to unilaterally default on its debt. Why might
Argentina do this? State the levels of CA, TB, NFIA, and FA in year N and all
subsequent years. What happens to the Argentine level of C in this case?
Answer: If Argentina defaults on this debt, NFIA = 0 because external wealth
c. When the default occurs, what is the change in Argentina’s external wealth W?
What happens to the rest of the world’s external wealth?
d. External wealth data for Argentina and the rest of the world are recorded in the
account known as the international investment position. Is this change in wealth
recorded as a financial flow, a price effect, or an exchange rate effect?
6. Using production function and MPK diagrams, answer the following questions. For
simplicity, assume there are two countries: a poor country (with low living standards)
and a rich country (with high living standards).
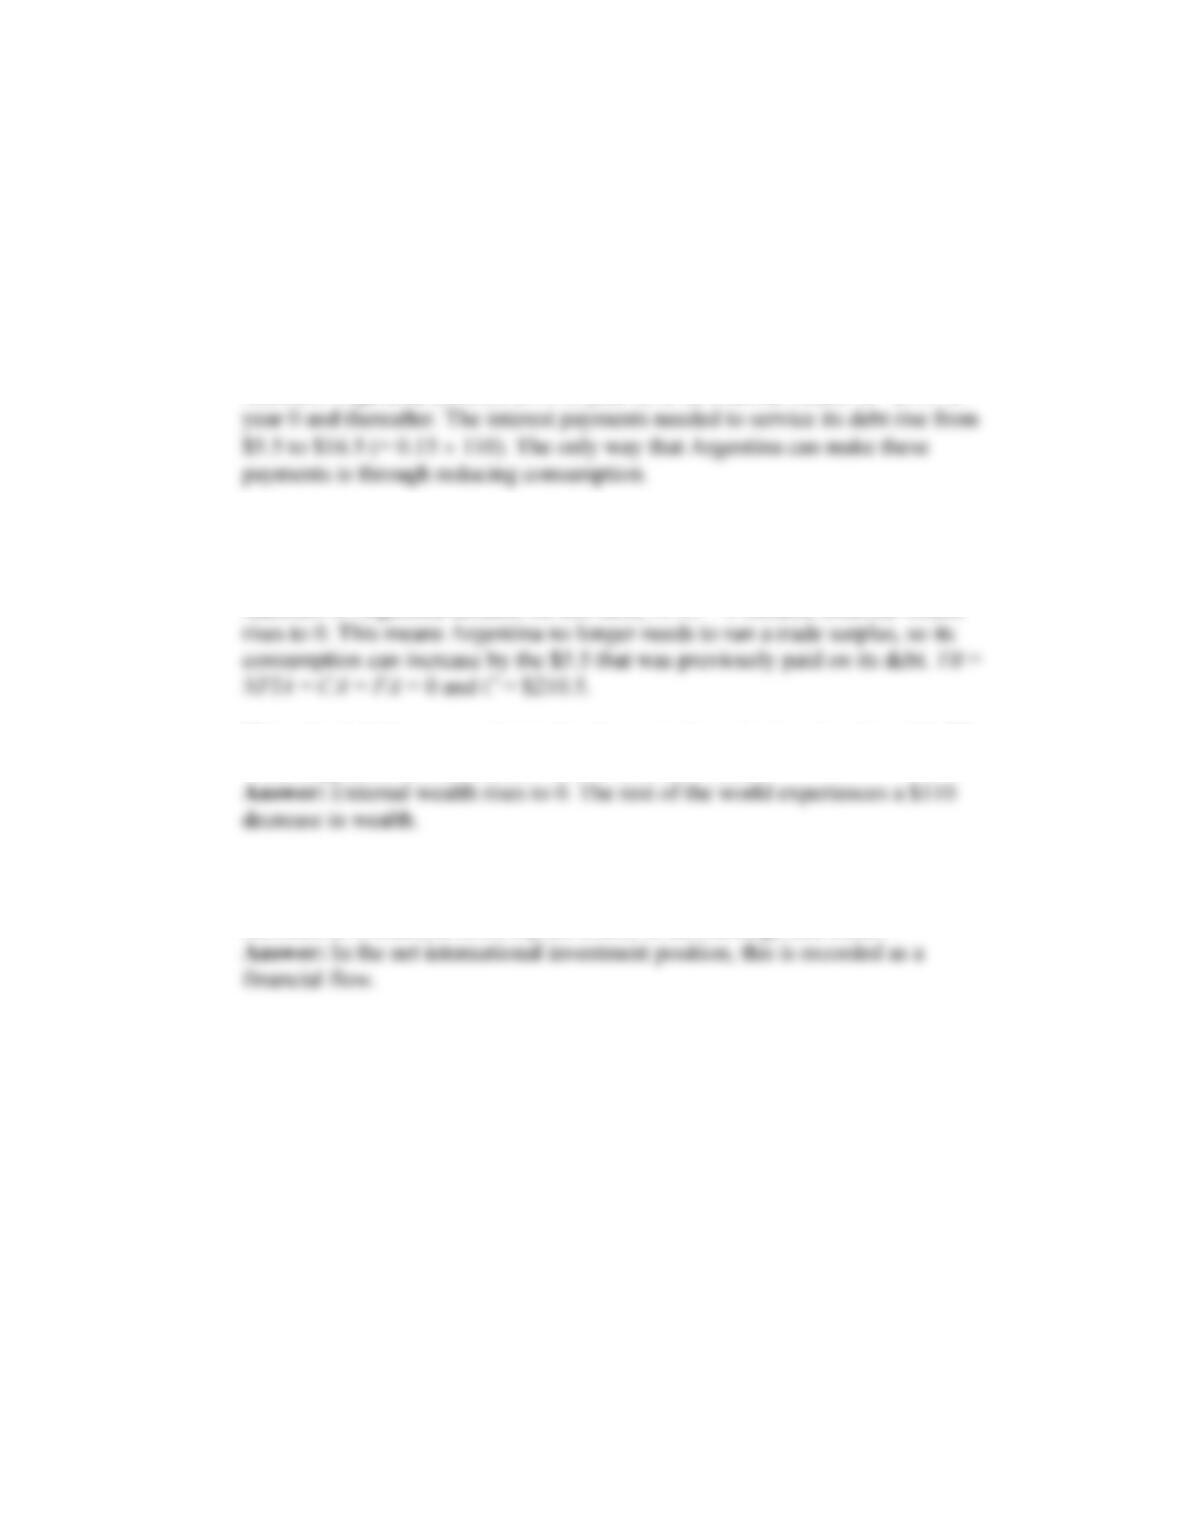
a. Assuming that poor and rich countries have the same production function,
illustrate how the poor country will converge with the rich country. Describe how
this mechanism works.
Answer: See the following figure.
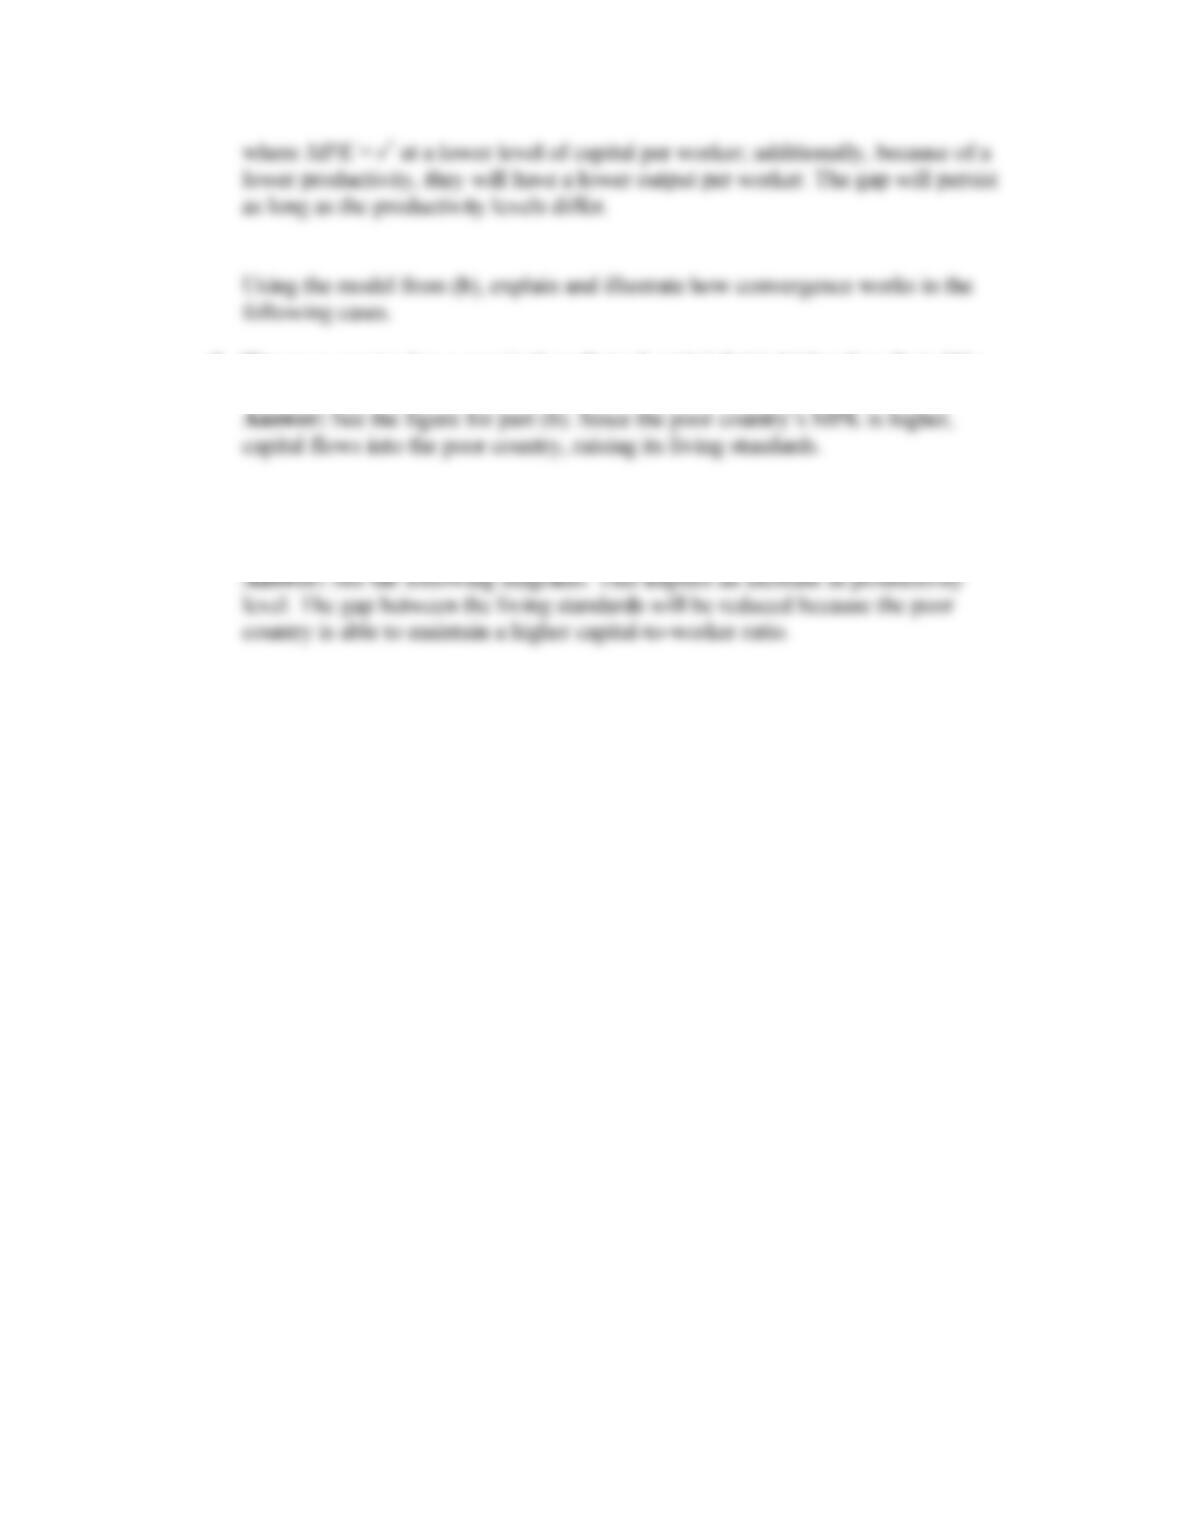
We know that living standards are measured by output per capita—this is directly
correlated with output per worker (denoted q on the diagram) and income per
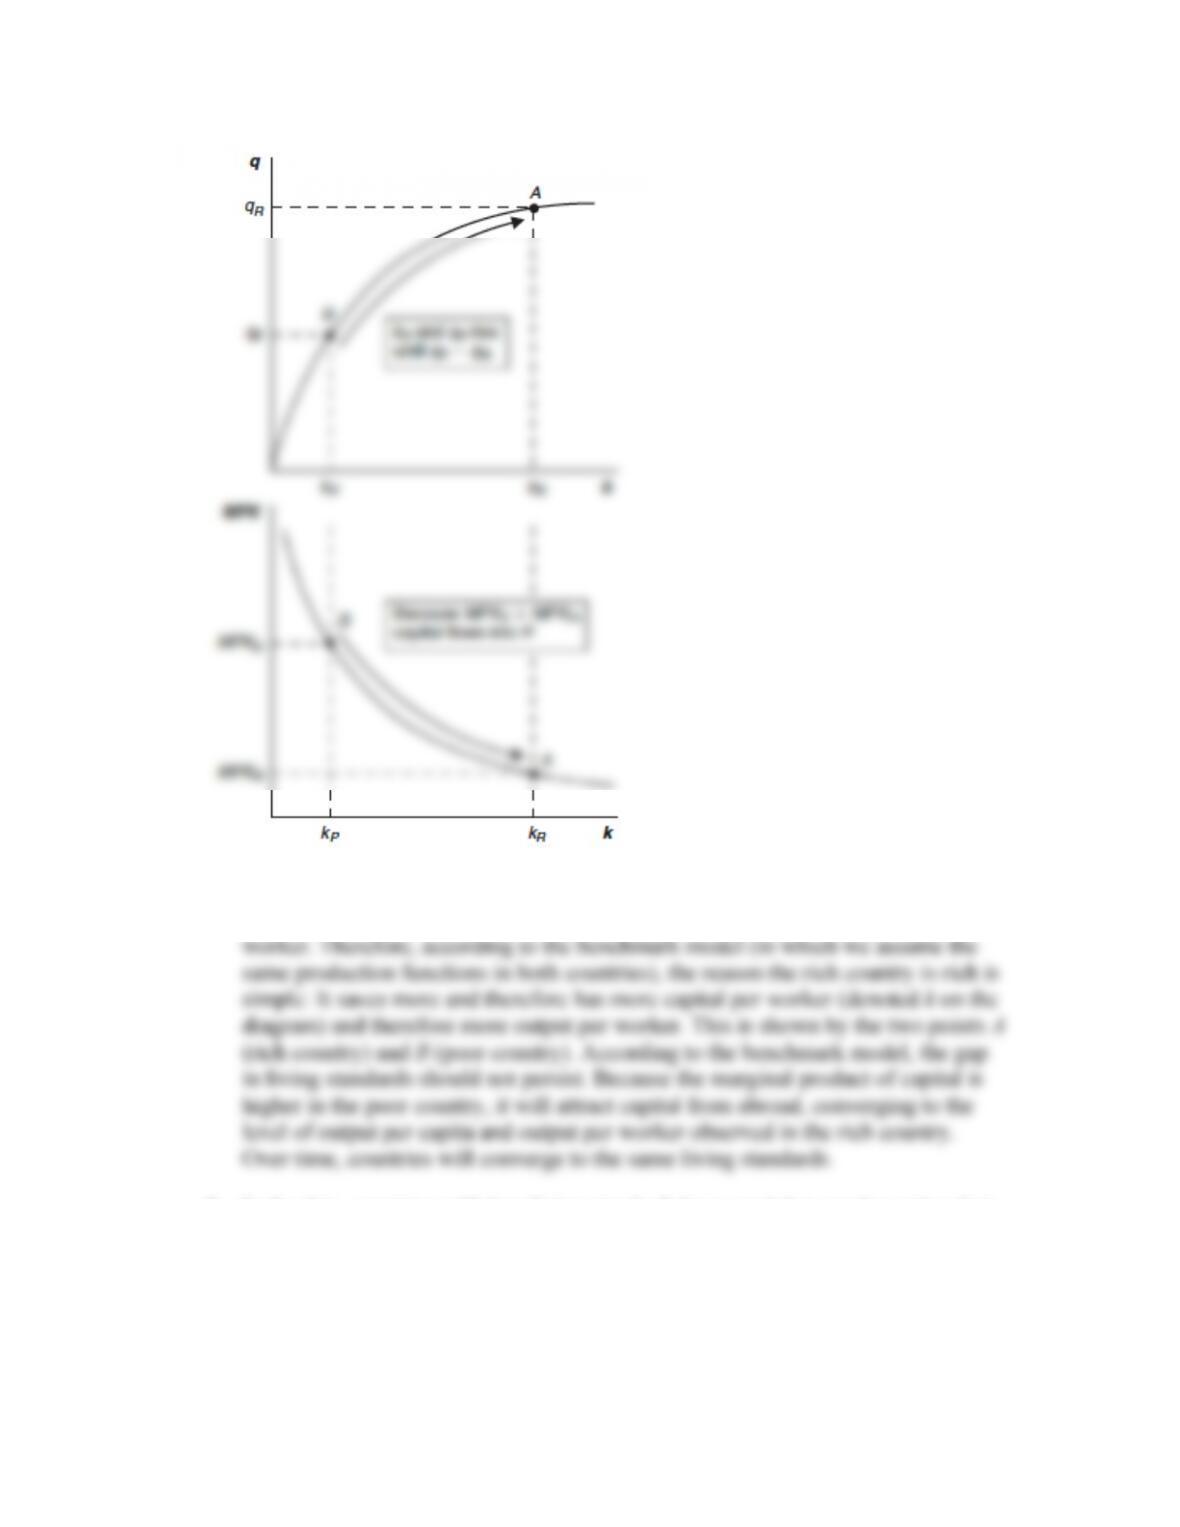
b. In the data, countries with low living standards have capital-to-worker ratios that
are too high to be consistent with the model used in (a). Describe and illustrate
how we can modify the model used in (a) to be consistent with the data.
Answer: See the following figure.
In the two graphs on the previous page, we observe a gap in living standards (qR
versus qP) that is inconsistent with the gap in capital-to-worker ratios (kR versus
kP). Specifically, the poor countries are saving a lot more than that implied by the
c. Given your assumptions from (b), what does this suggest about the ability of poor
countries to converge with rich countries? What do we expect to happen to the
gap between rich and poor countries over time? Explain.
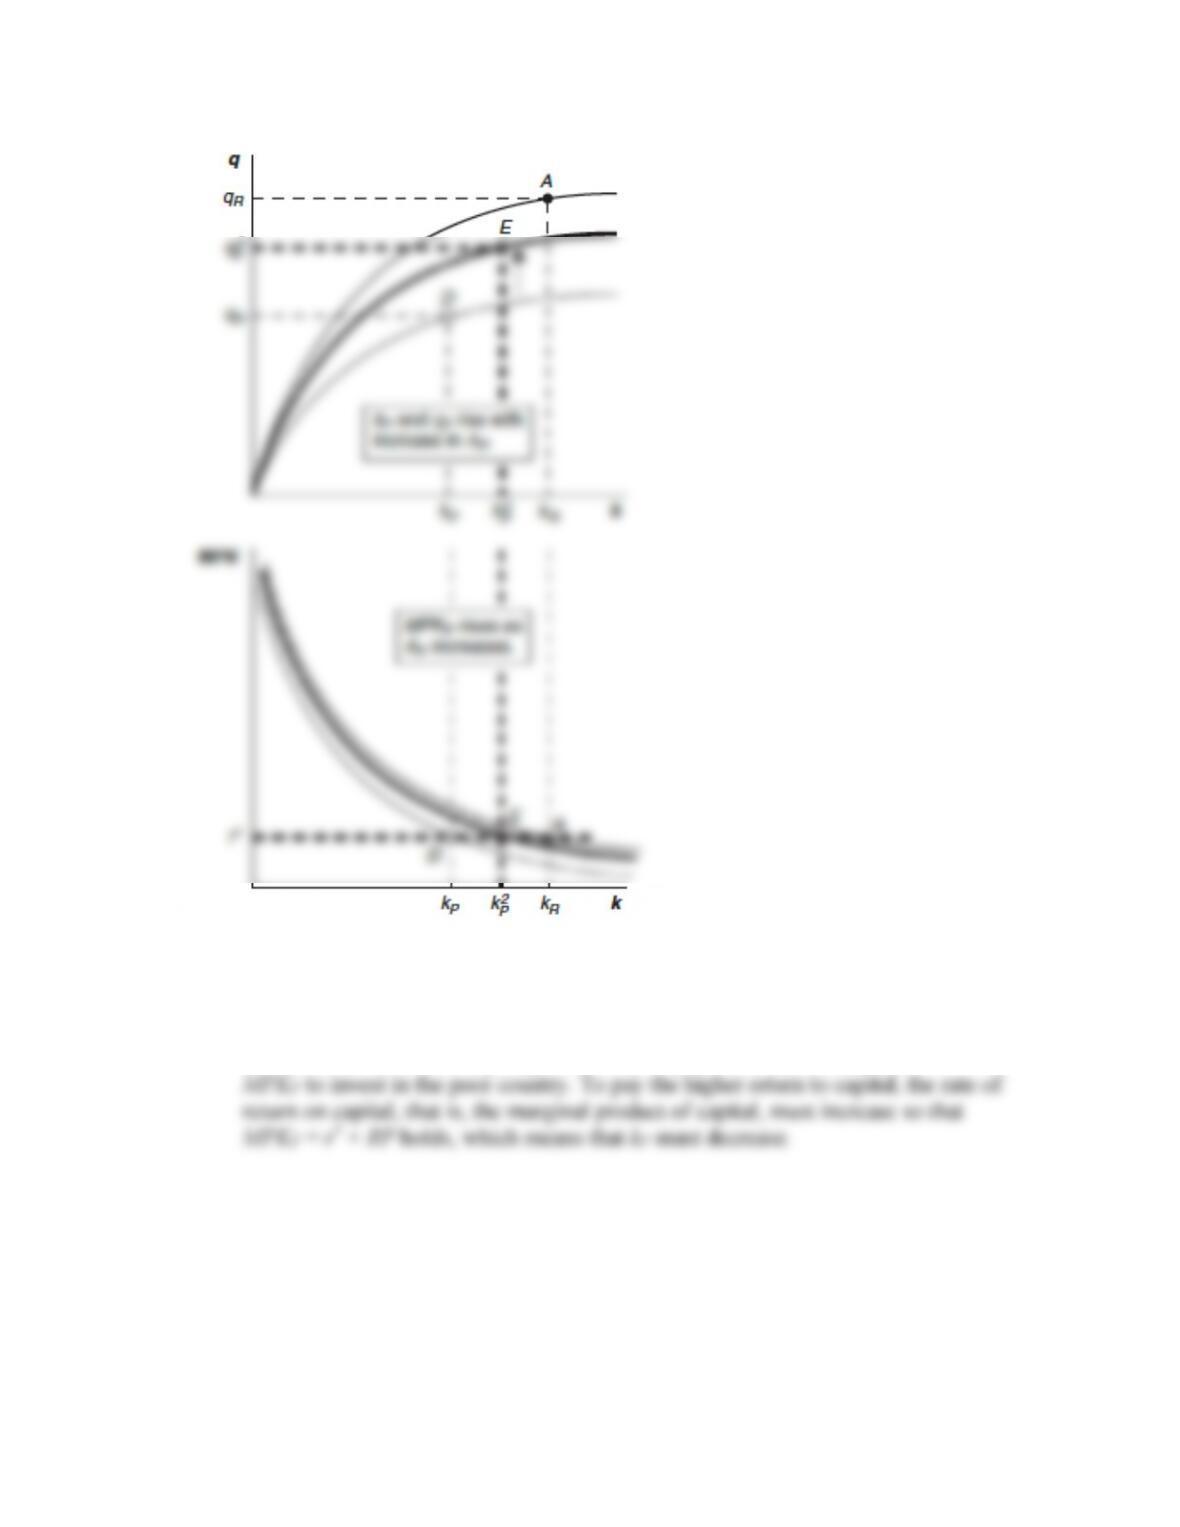
Answer: With lower productivity levels, these countries will achieve a point
d. The poor country has a marginal product of capital that is higher than that of the
rich country.
e. The marginal products in each country are equal. Then, the poor country
experiences an increase in human capital through government funding of
education.
f. The marginal products in each country are equal. Then, the poor country
experiences political instability such that investors require a risk premium to
invest in the poor country.
Answer: See the following diagrams. They imply that investors require r* + RP >
Work It Out
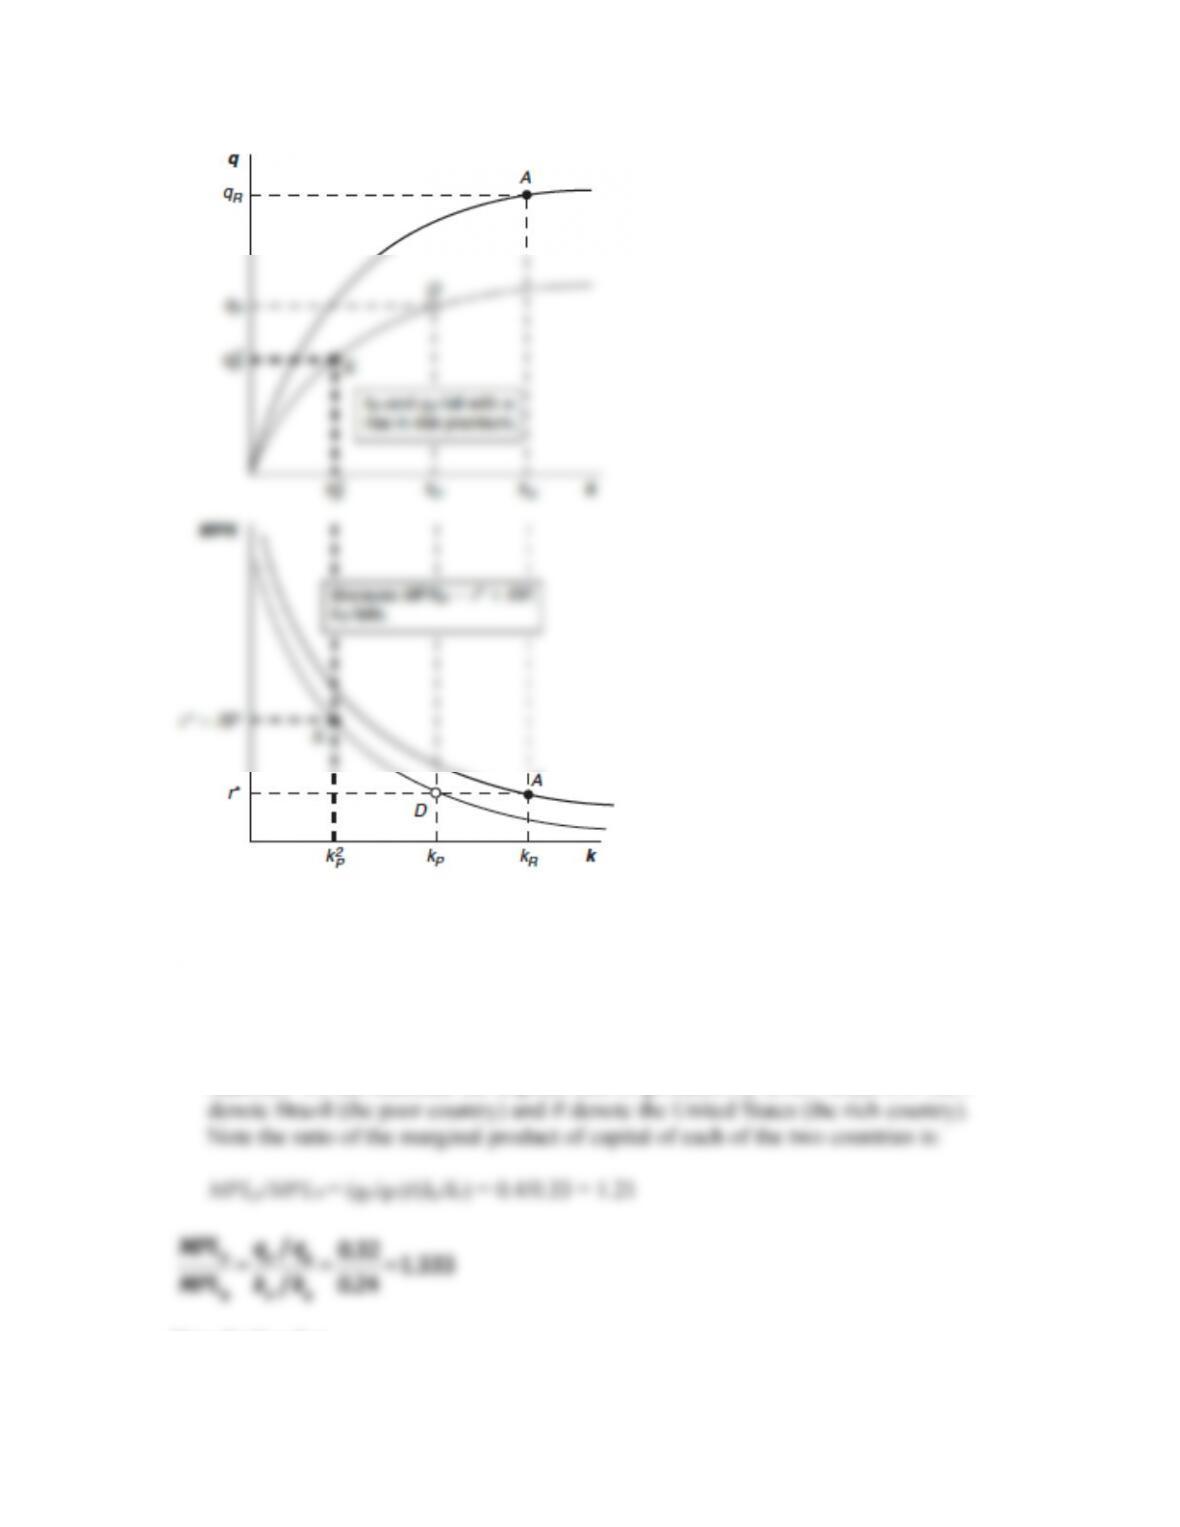
Assume that Brazil and the United States have different production functions q = f(k),
where q is output per worker and k is capital per worker. Let q = Ak1/3. You are told
that relative to the United States = 1, Brazil has an output per worker of 0.40 and
capital per worker of 0.33. Can A be the same in Brazil as in the United States? If not,
compute the level of A for Brazil. What is Brazil’s MPK relative to the United States?
Answer: We can calculate the implied ratio of productivity levels ABrazil/AUS. Let P
Note further that
1/3/
1/3
7. Use production function and MPK diagrams to examine Turkey and the European
Union (EU). Assume that Turkey and the EU have different production functions q =
f(k), where q is output per worker and k is capital per worker. Let q = Ak1/3. Assume
that the productivity level A in Turkey is lower than that in the EU.
a. Draw a production function diagram (with output per worker y as a function of
capital per worker k) and MPK diagram (MPK versus k) for the EU. (Hint: Be
sure to draw the two diagrams with the production function directly above the
MPK diagram so that the level of capital per worker k is consistent on your two
diagrams.)
Answer: See the following diagram.
b. For now, assume capital cannot flow freely in and out of Turkey. On the same
diagrams, plot Turkish production function and MPK curves, assuming that the
productivity level A in Turkey is half the EU level and that Turkish MPK exceeds
EU MPK. Label the EU position in each chart EU and the label the Turkish
position T1.
Answer: See the following diagram.
c. Assume capital can now flow freely between Turkey and the EU and the rest of
the world, and that the EU is already at the point where MPK = r*. Label r* on the
vertical axis of the MPK diagram. Assume no risk premium. What will Turkey’s
capital per worker level k be? Label this outcome point T2 in each diagram. Will
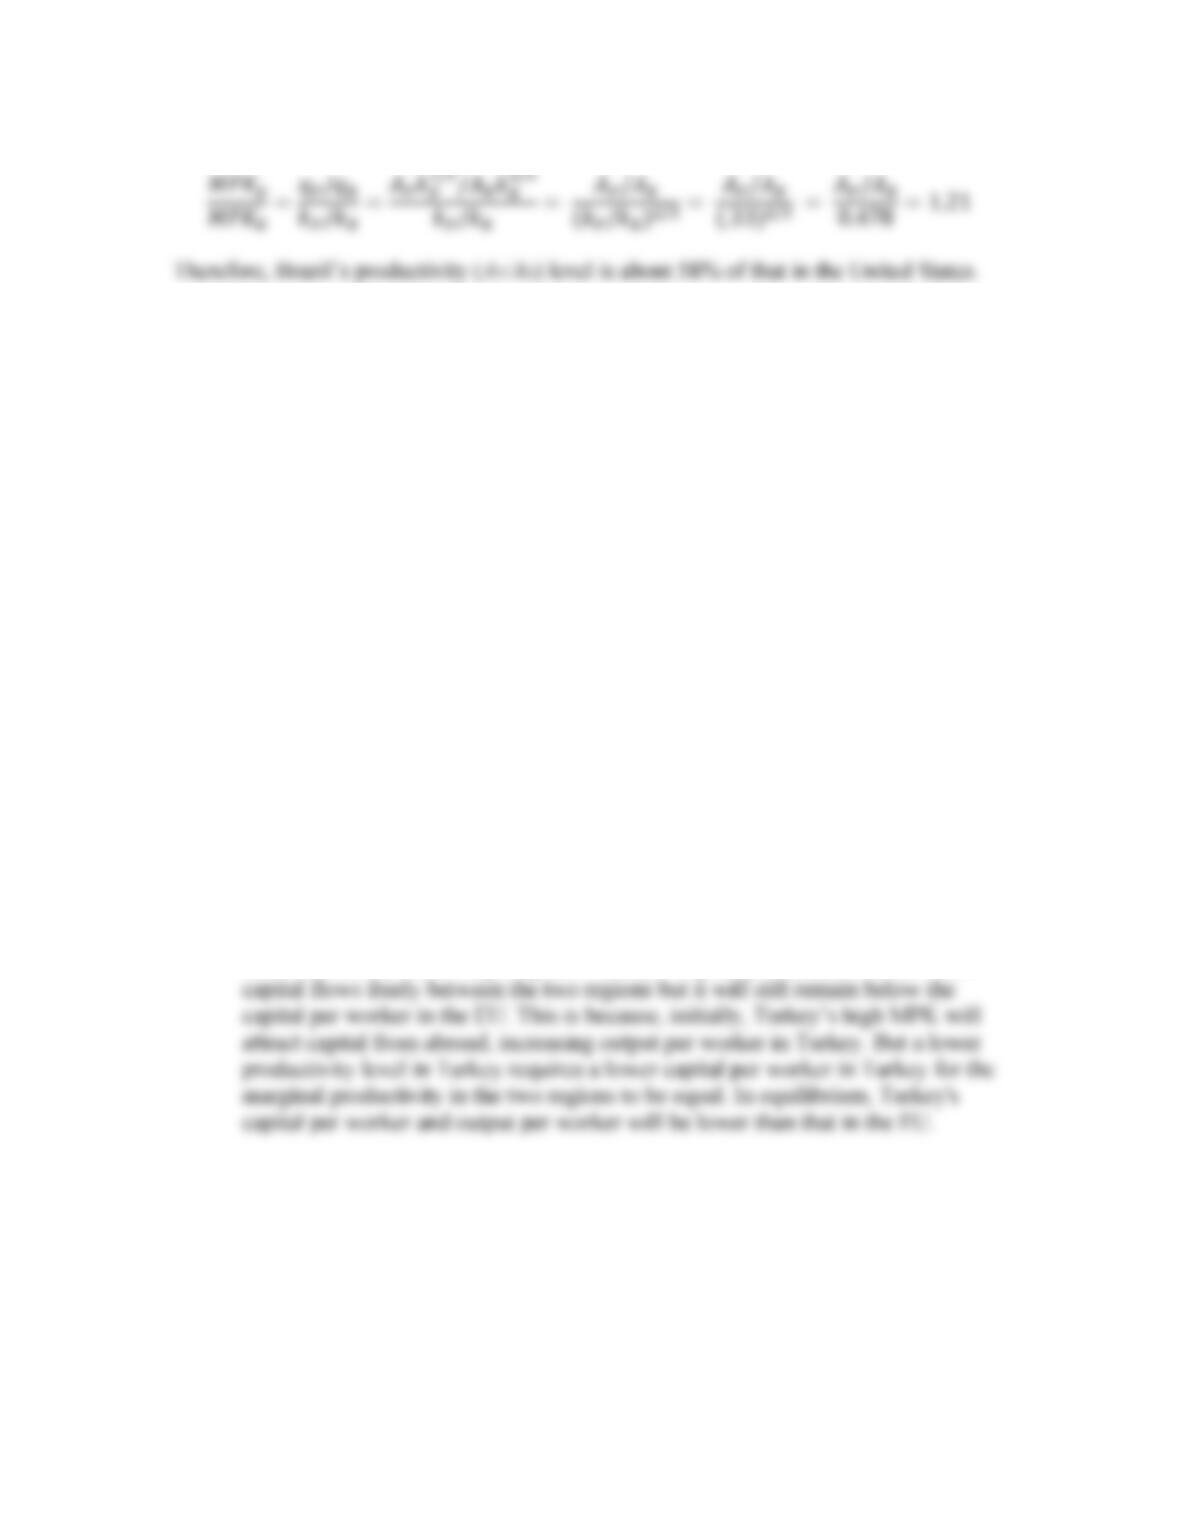
Turkey converge to the EU level of q? Explain.
Answer: See the following diagram. Turkey’s capital per worker will rise once
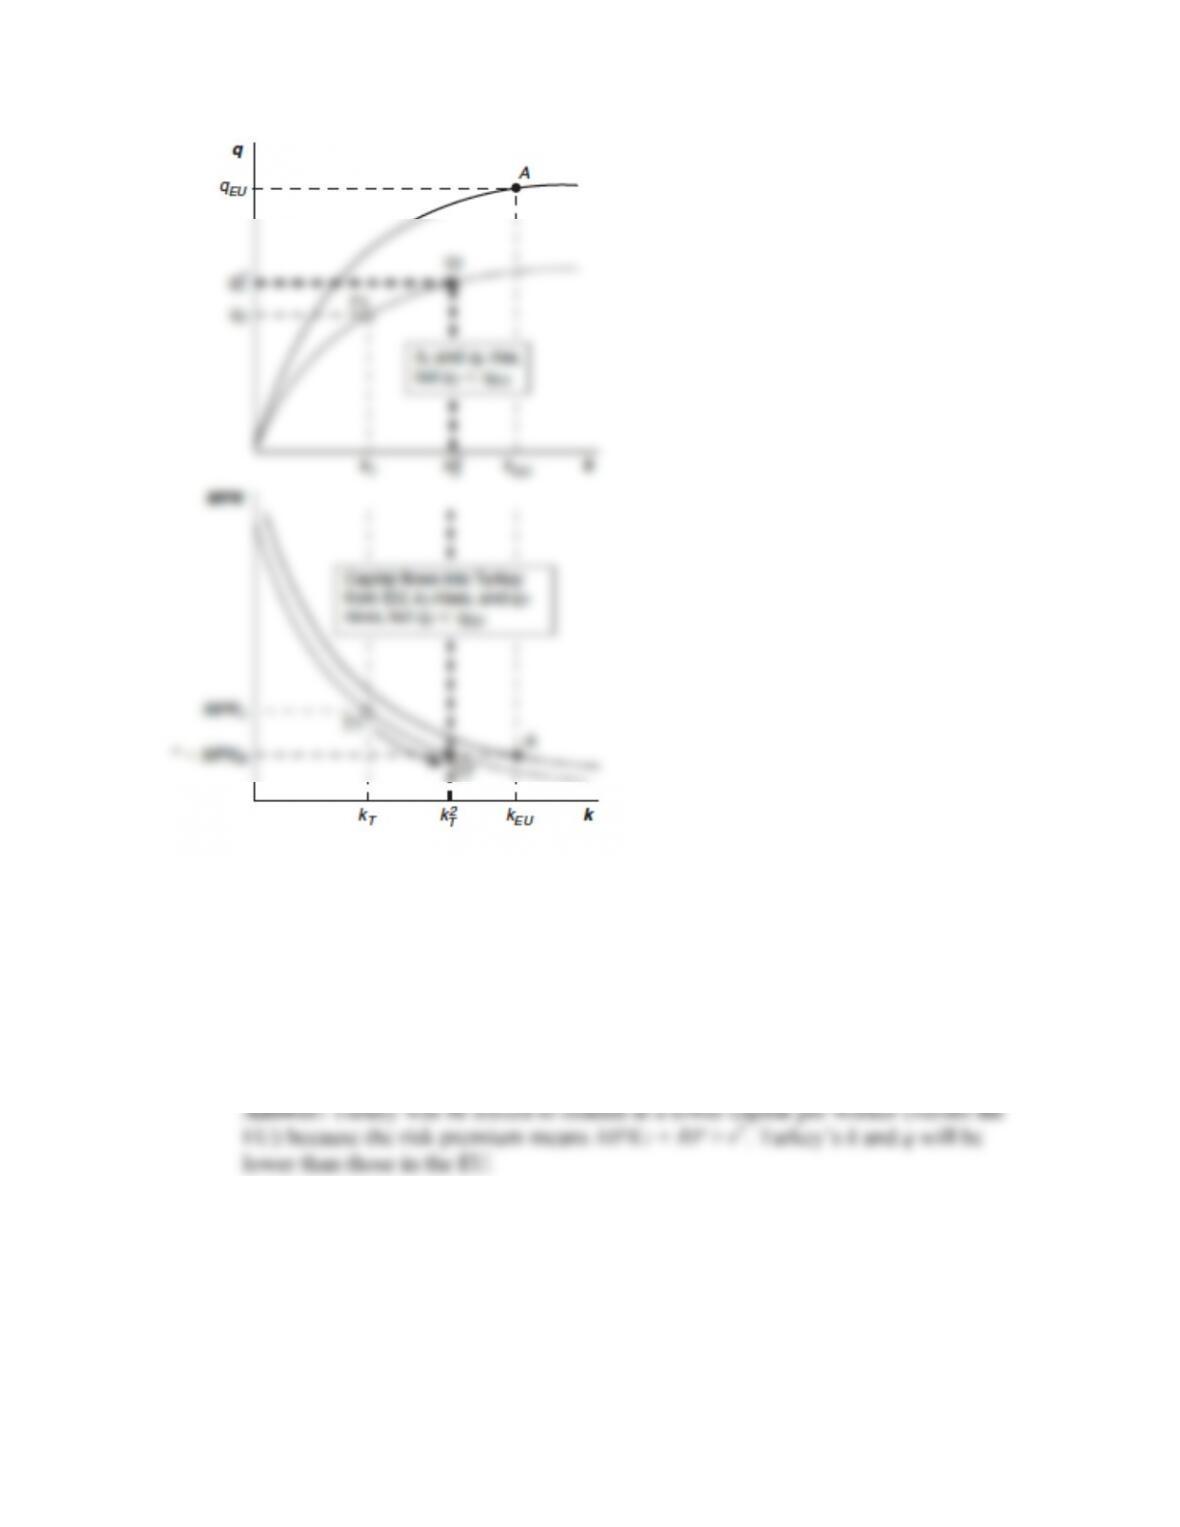
8. This question continues from the previous problem, focusing on how risk premiums
explain the gaps in living standards across countries.
a. Investors worry about the rule of law in Turkey and also about the potential for
hyperinflation and other bad macroeconomic policies. Because of these worries,
the initial gap between MPK in Turkey and r* is a risk premium (RP). Label RP
on the vertical axis of the MPK diagram. Now where does Turkey end up in terms
of k and q?
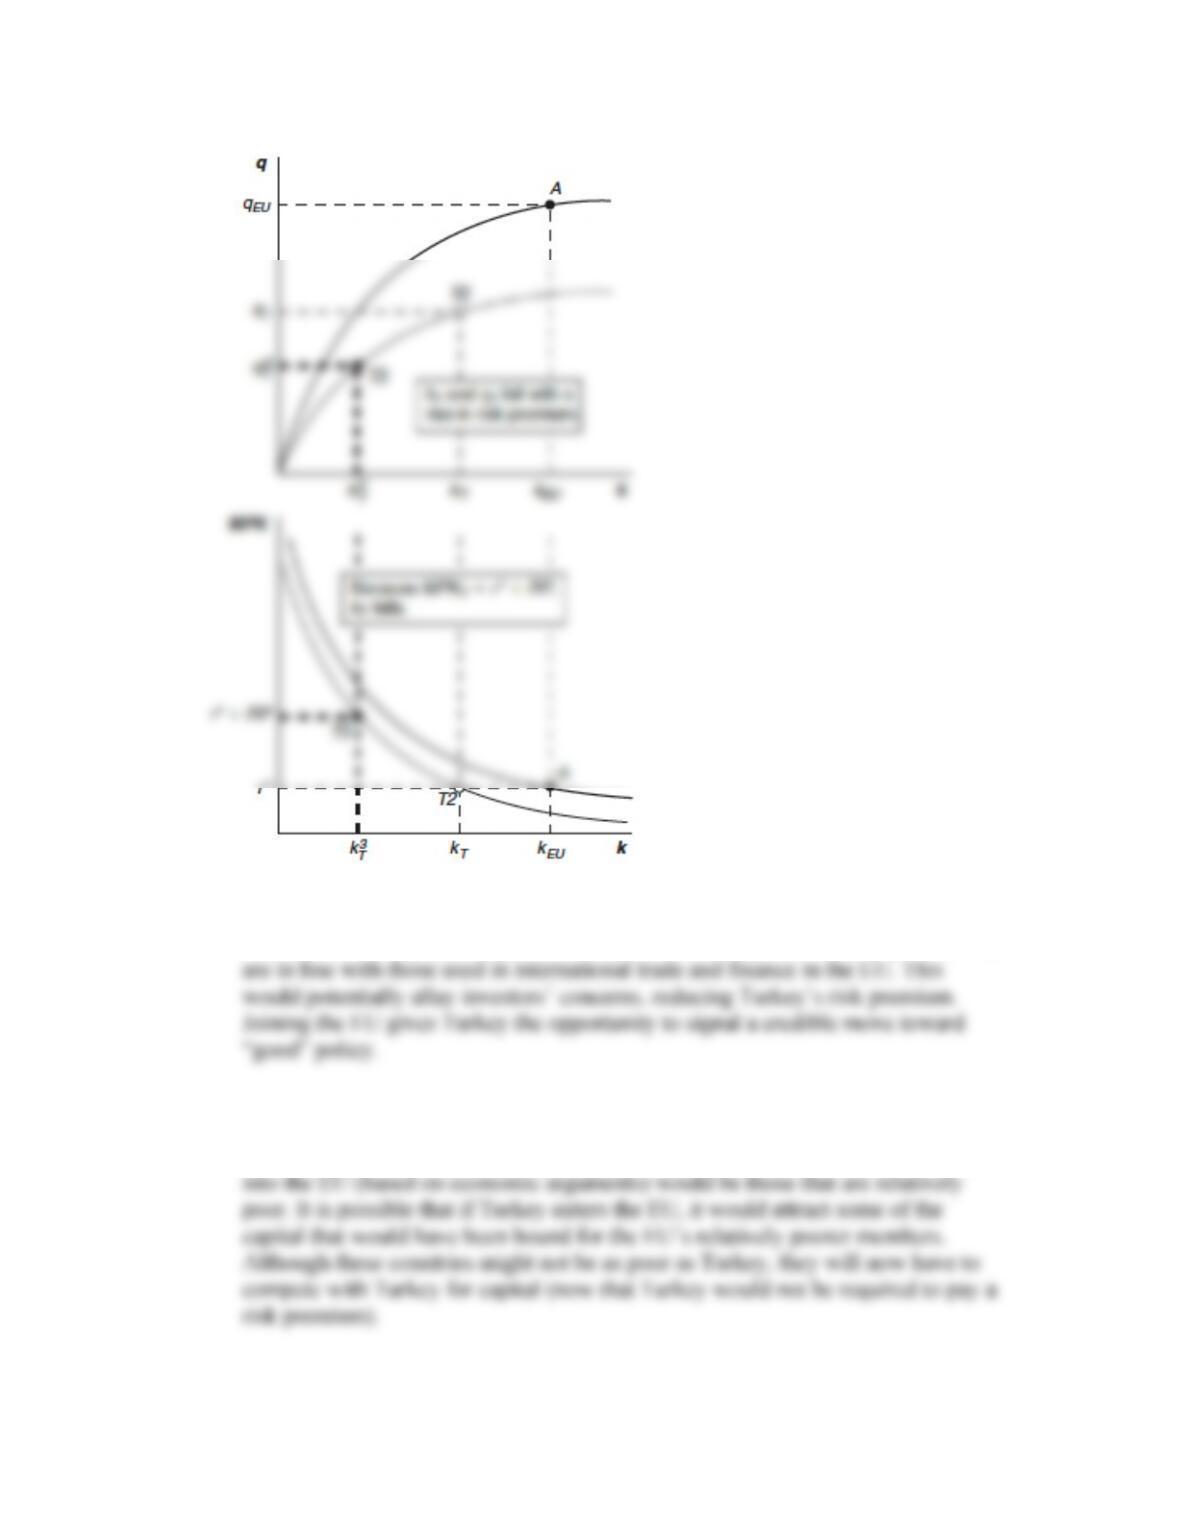
b. In light of (a), why might Turkey be keen to join the EU?
Answer: If Turkey were to join the EU, it would be required to adopt policies that
c. Some EU countries are keen to exclude Turkey from the EU. What might be the
economic arguments for that position?
Answer: The countries in the EU most likely to be opposed to Turkey’s entrance
9. In this chapter, we saw that financial market integration is necessary for countries to
smooth consumption through borrowing and lending. Consider two economies: those
of the Czech Republic and France. For each of the following shocks, explain how and
to what extent each country can trade capital to better smooth consumption.
a. The Czech Republic and France each experience an EU–wide recession.
b. A strike in France leads to a reduction in French income.
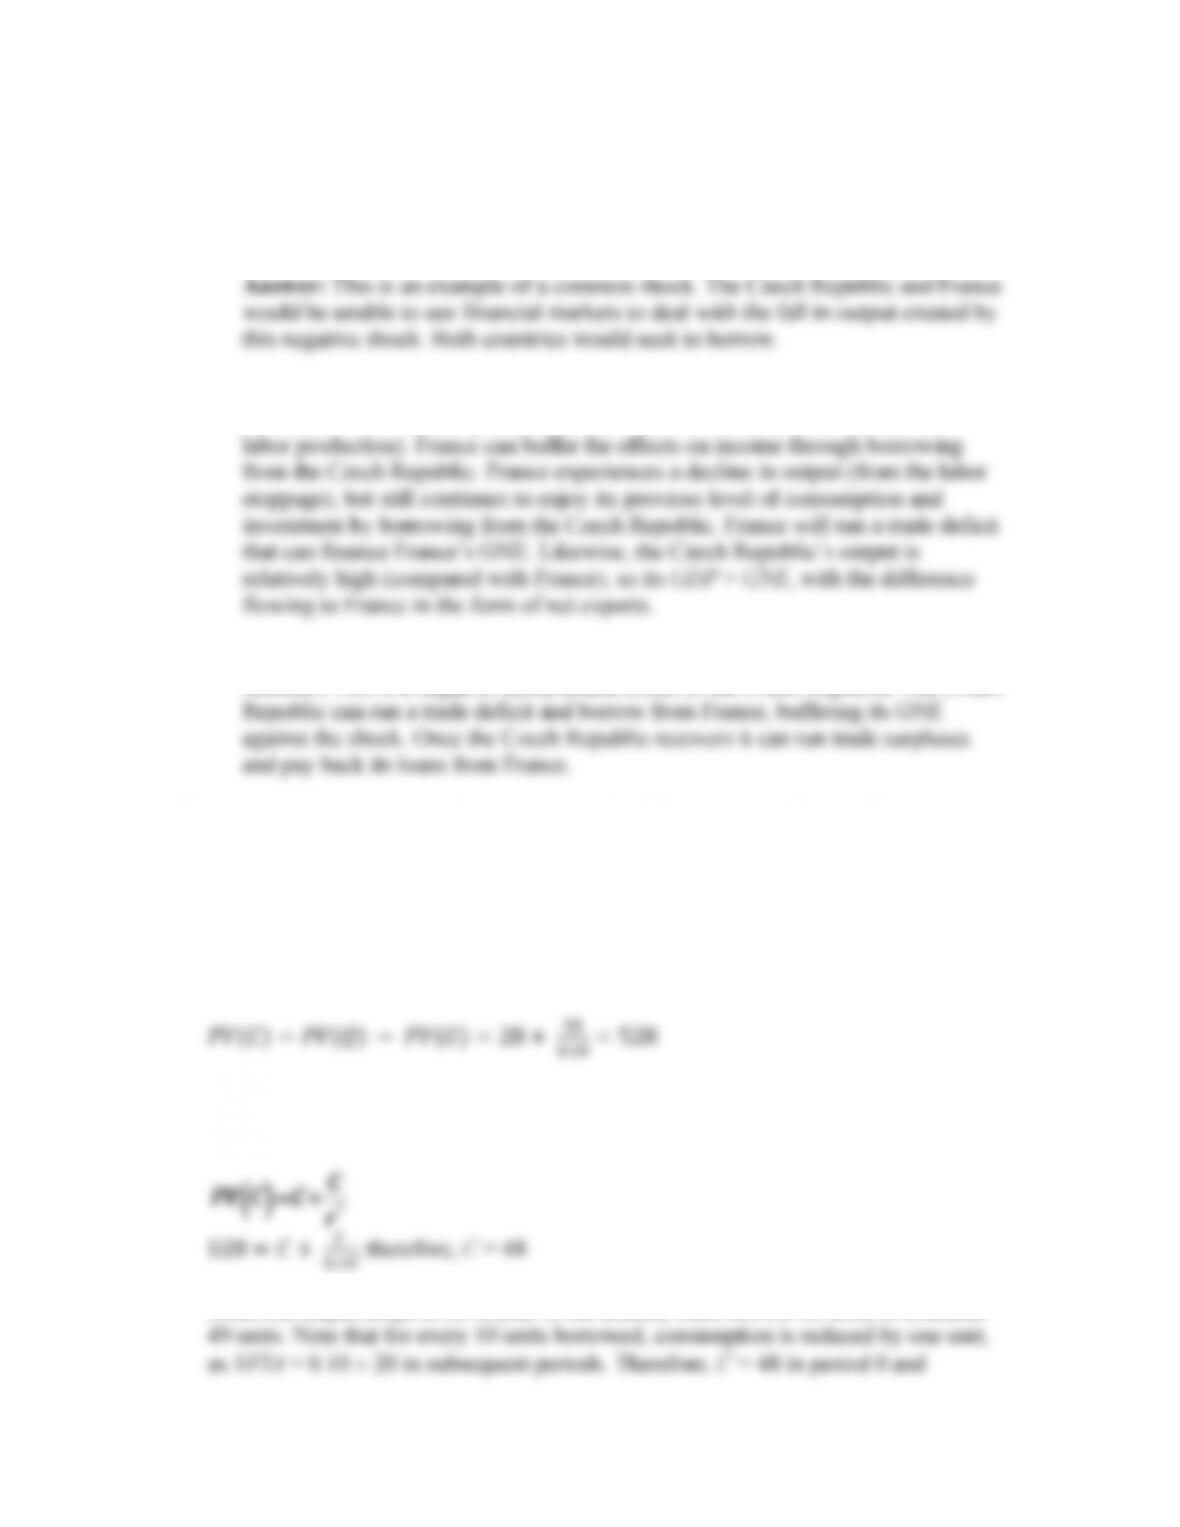
Answer: This is an idiosyncratic shock to France’s output (from a reduction in
c. Floods destroy a portion of the Czech capital stock, lowering Czech income.
Answer: This is a negative idiosyncratic shock to the Czech Republic. The Czech
10. Assume that a country produces an output Q of 50 every year. The world interest rate
is 10%. Consumption C is 50 every year, and I = G = 0. There is an unexpected drop
in output in year 0, so output falls to 28 and is then expected to return to 50 in every
future year. If the country desires to smooth consumption, how much should it
borrow in period 0? What will the new level of consumption be from then on?
Answer: There is a one–time decrease in output of 22 units. Therefore, the present
value of consumption is:
To determine the level of consumption each period, we know that the country wants
to maintain a given level of consumption:
Since the output drops to 28 in year 0, the country must borrow 20 units to consume
thereafter. Alternatively, the change in consumption can be calculated using the
following:
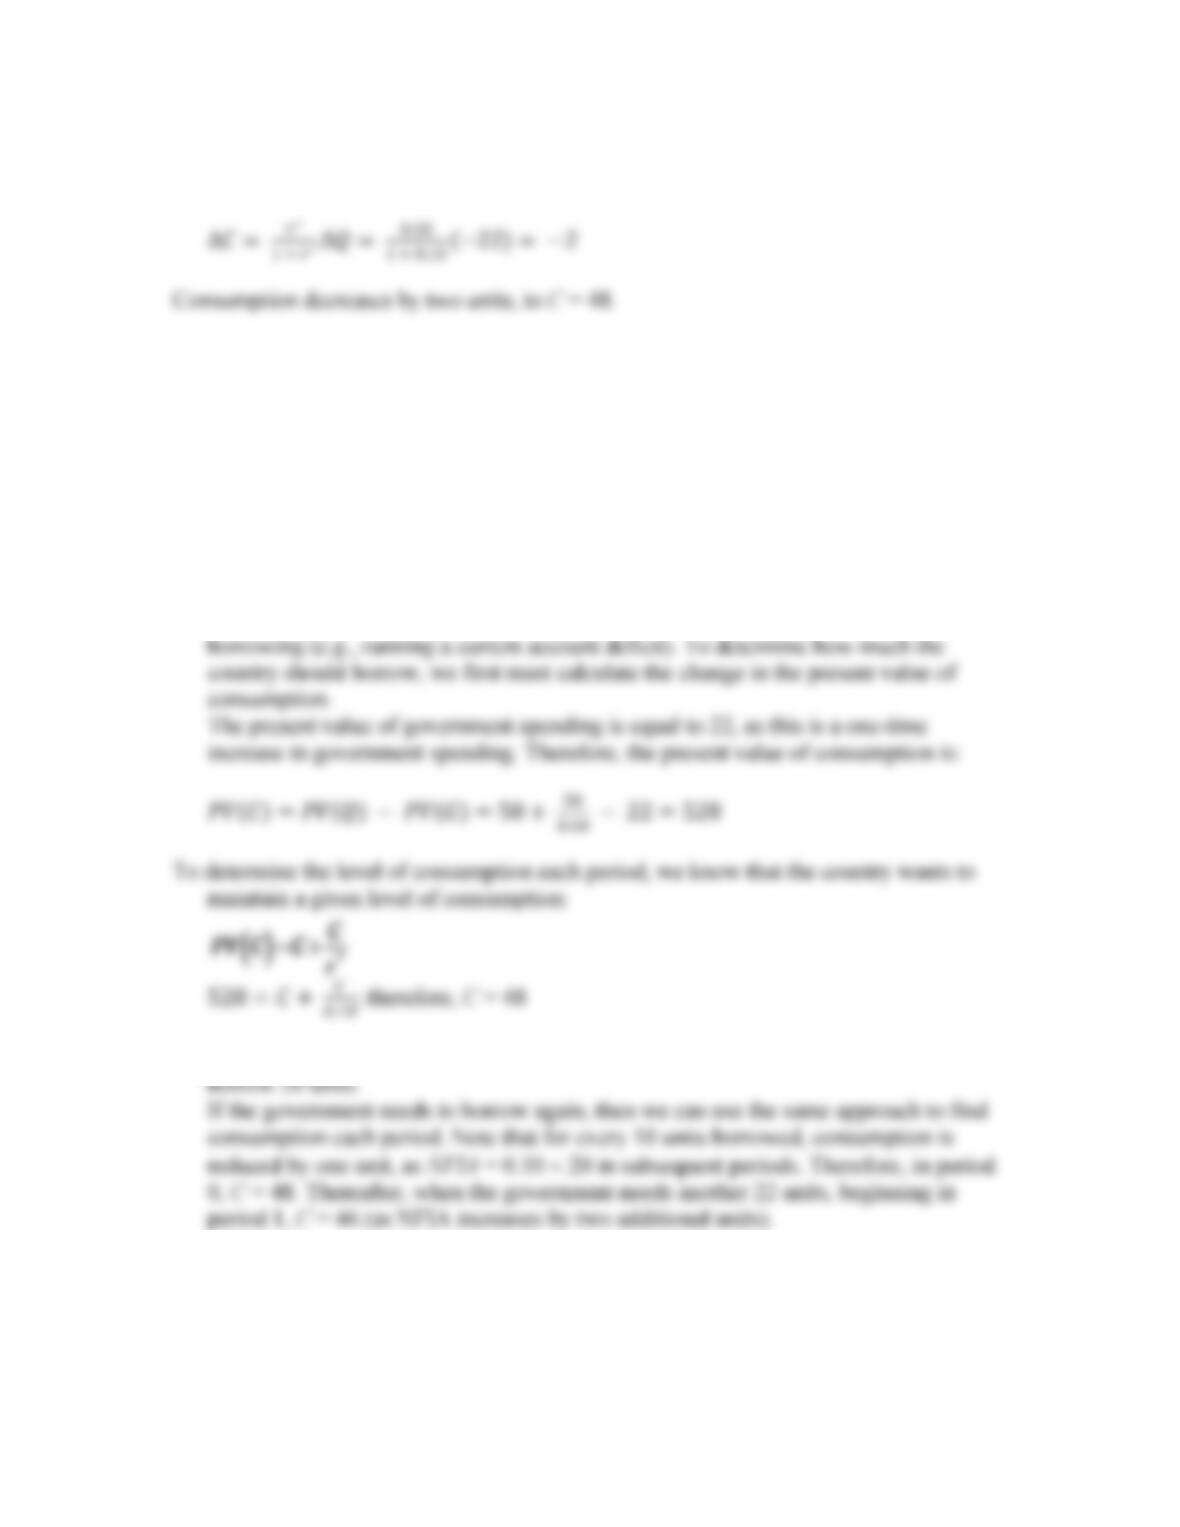
11. Assume that a country produces an output Q of 50 every year. The world interest rate
is 10%. The country currently plans a consumption level C equal to 50 every year,
and I = G = 0. There is an unexpected war in year 0, which costs 22 units and is
predicted to last one year. If the country desires to smooth consumption, how much
should it borrow in period 0? What will the new level of consumption be from then
on?
The country wakes up in year 1 and discovers that the war is still going on and will
eat up another 22 units of expenditure in year 1. If the country still desires to smooth
consumption looking forward from year 1, how much should it borrow in period 1?
What will the new level of consumption be from then on?
Answer: If the war is temporary, the increase in G should be financed through
To consume 48 units, along with the war expenditure of 22 units, the country needs to
12. To learn more about the aid debate, download some of the conflicting arguments
made by two prominent figures: Jeffrey Sachs and William Easterly (Hint: Search
online for “sachs easterly”). See, for example, their “Foreign aid face-off” in the Los
Angeles Times (latimes.com, May 8, 2006). See also Nicholas Kristof, “Aid: Can It
Work?” New York Review of Books, October 5, 2006. After weighing all these
arguments, do you feel more or less optimistic about what aid can achieve?
Answer: Jeffrey Sachs argues that the costs of failures in many developing
countries to the rest of the world is enormous (through wars, terrorism, etc.) and
that direct aid from developed countries to help promote food production, health
13. Consider a world of two countries: Highland (H) and Lowland (L). Each country has
an average output of 9 and desires to smooth consumption. All income takes the form
of capital income and is fully consumed each period.
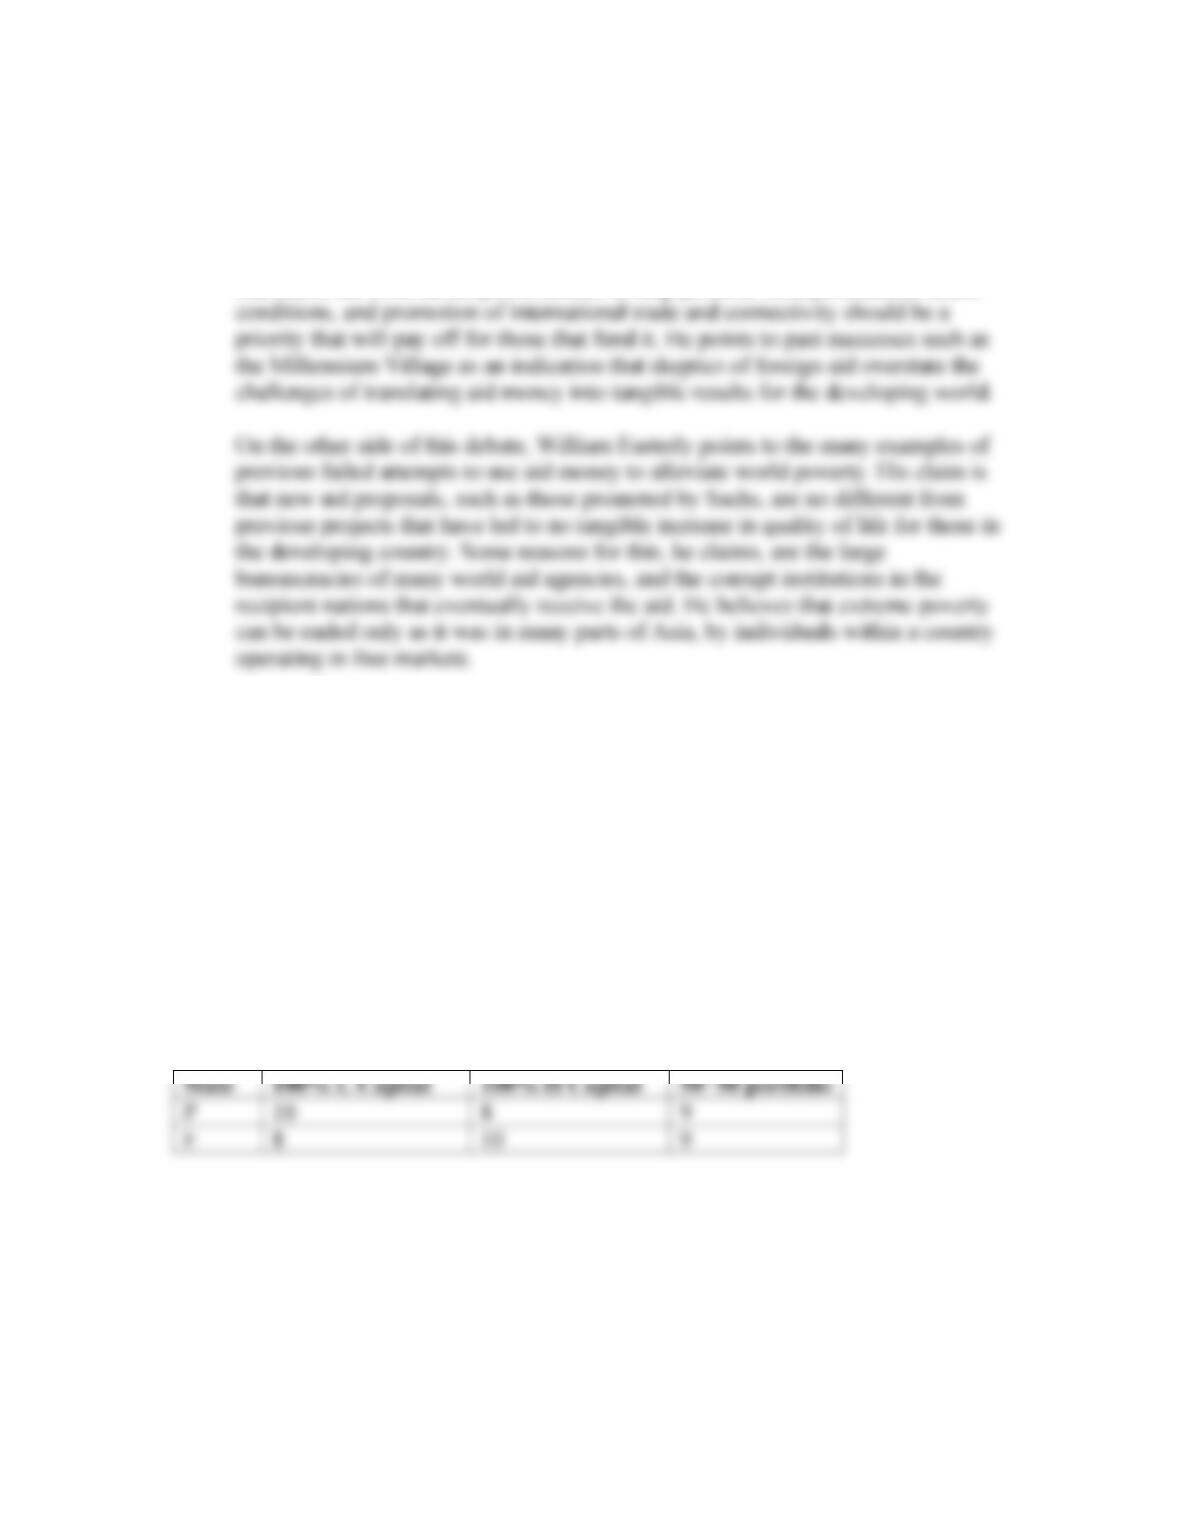
a. Initially, there are two states of the world: Pestilence (P) and Flood (F). Each
happens with 50% probability. Pestilence affects Highland and lowers the output
there to 8, leaving Lowland unaffected with an output of 10. Flood affects
Lowland and lowers the output there to 8, leaving Highland unaffected with an
output of 10. Devise a table with two rows corresponding to each state (rows
marked P and F). In three columns, show income to three portfolios: the portfolio
of 100% H capital, the portfolio of 100% L capital, and the portfolio of 50% H +
50% L capital.
Answer: See the following table.
State
100% L Capital
100% H Capital
50−50 portfolio
P
10
8
9
F
8
10
9
b. Two more states of world appear: Armageddon (A) and Utopia (U). Each happens
with 50% probability but is uncorrelated with the P−F state. Armageddon affects
both countries equally and lowers income in each country by a further four units,
whatever the P−F state. Utopia leaves each country unaffected. Devise a table
with four rows corresponding to each state (rows marked PA, PU, FA, and FU).
In three columns, show income to three portfolios: the portfolio of 100% H
capital, the portfolio of 100% L capital, and the portfolio of 50% H + 50% L
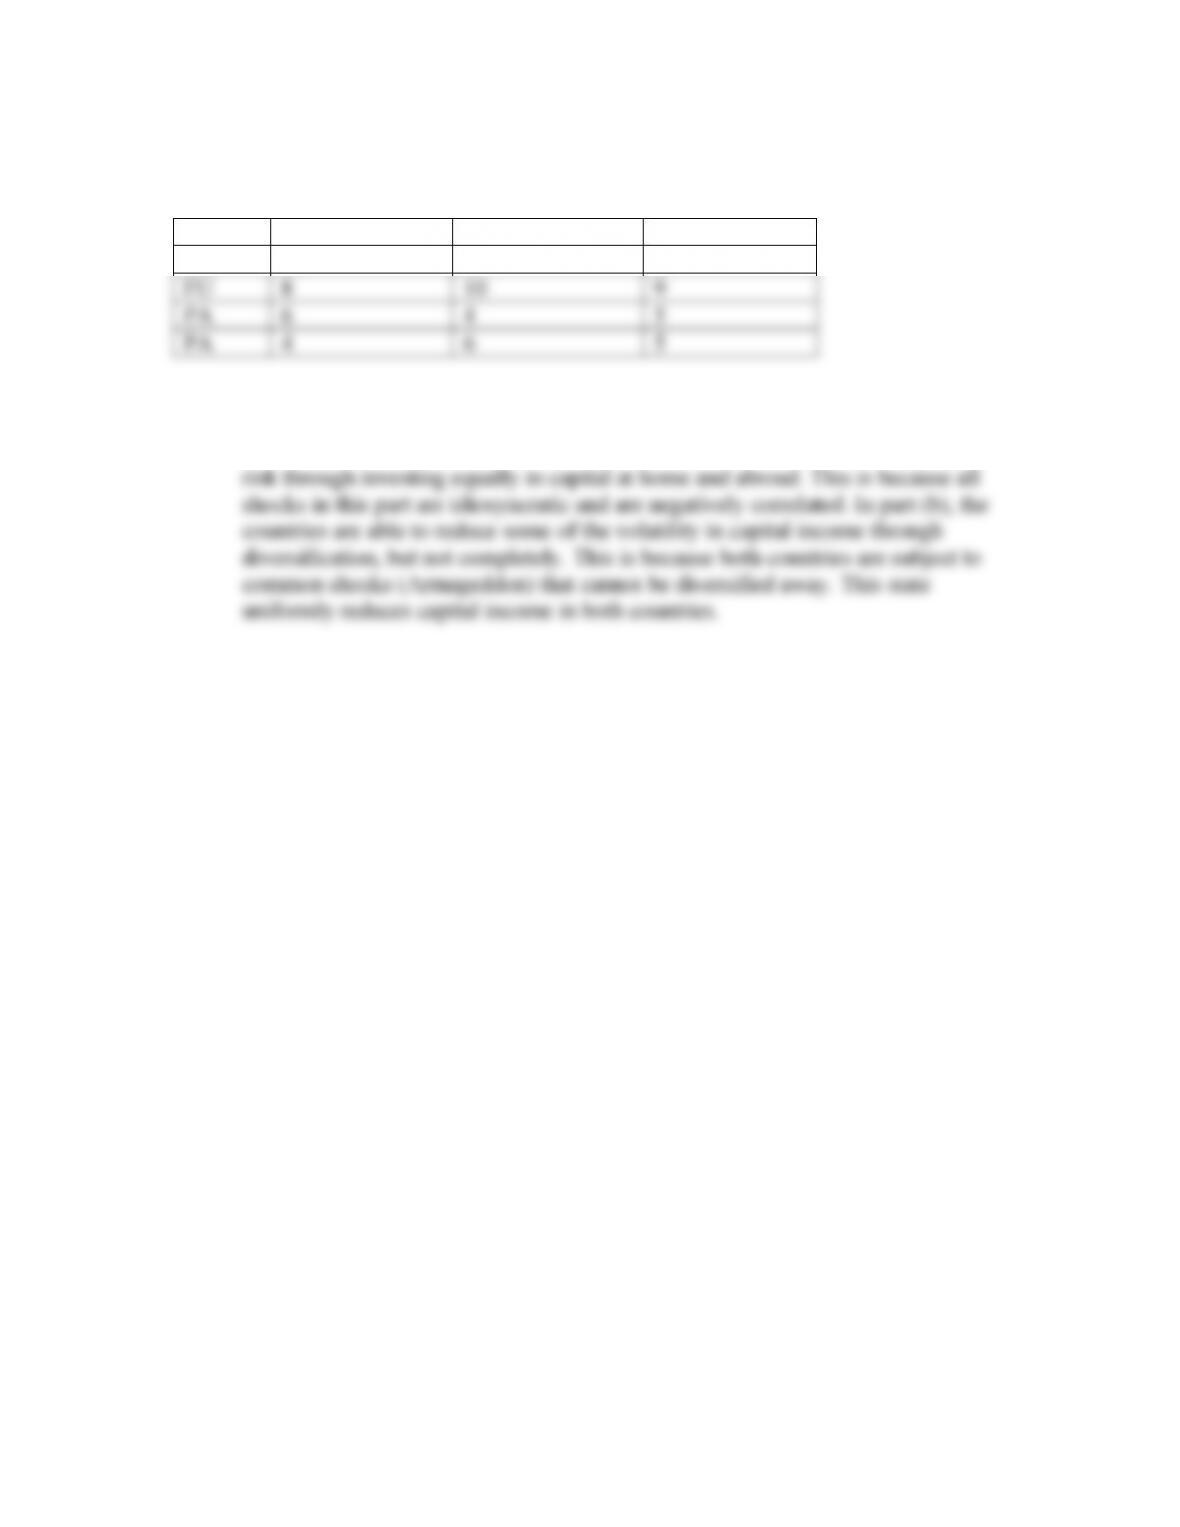
capital.
Answer: See the following table.
State
100% L Capital
100% H Capital
50−50 portfolio
PU
10
8
9
FU
8
10
9
PA
6
4
5
PA
4
6
5
Compare your answers to (a) and (b) and consider the optimal portfolio choices.
Does diversification eliminate consumption risk in each case? Explain.
Answer: In part (a), Lowland and Highland are each able to eliminate exposure to