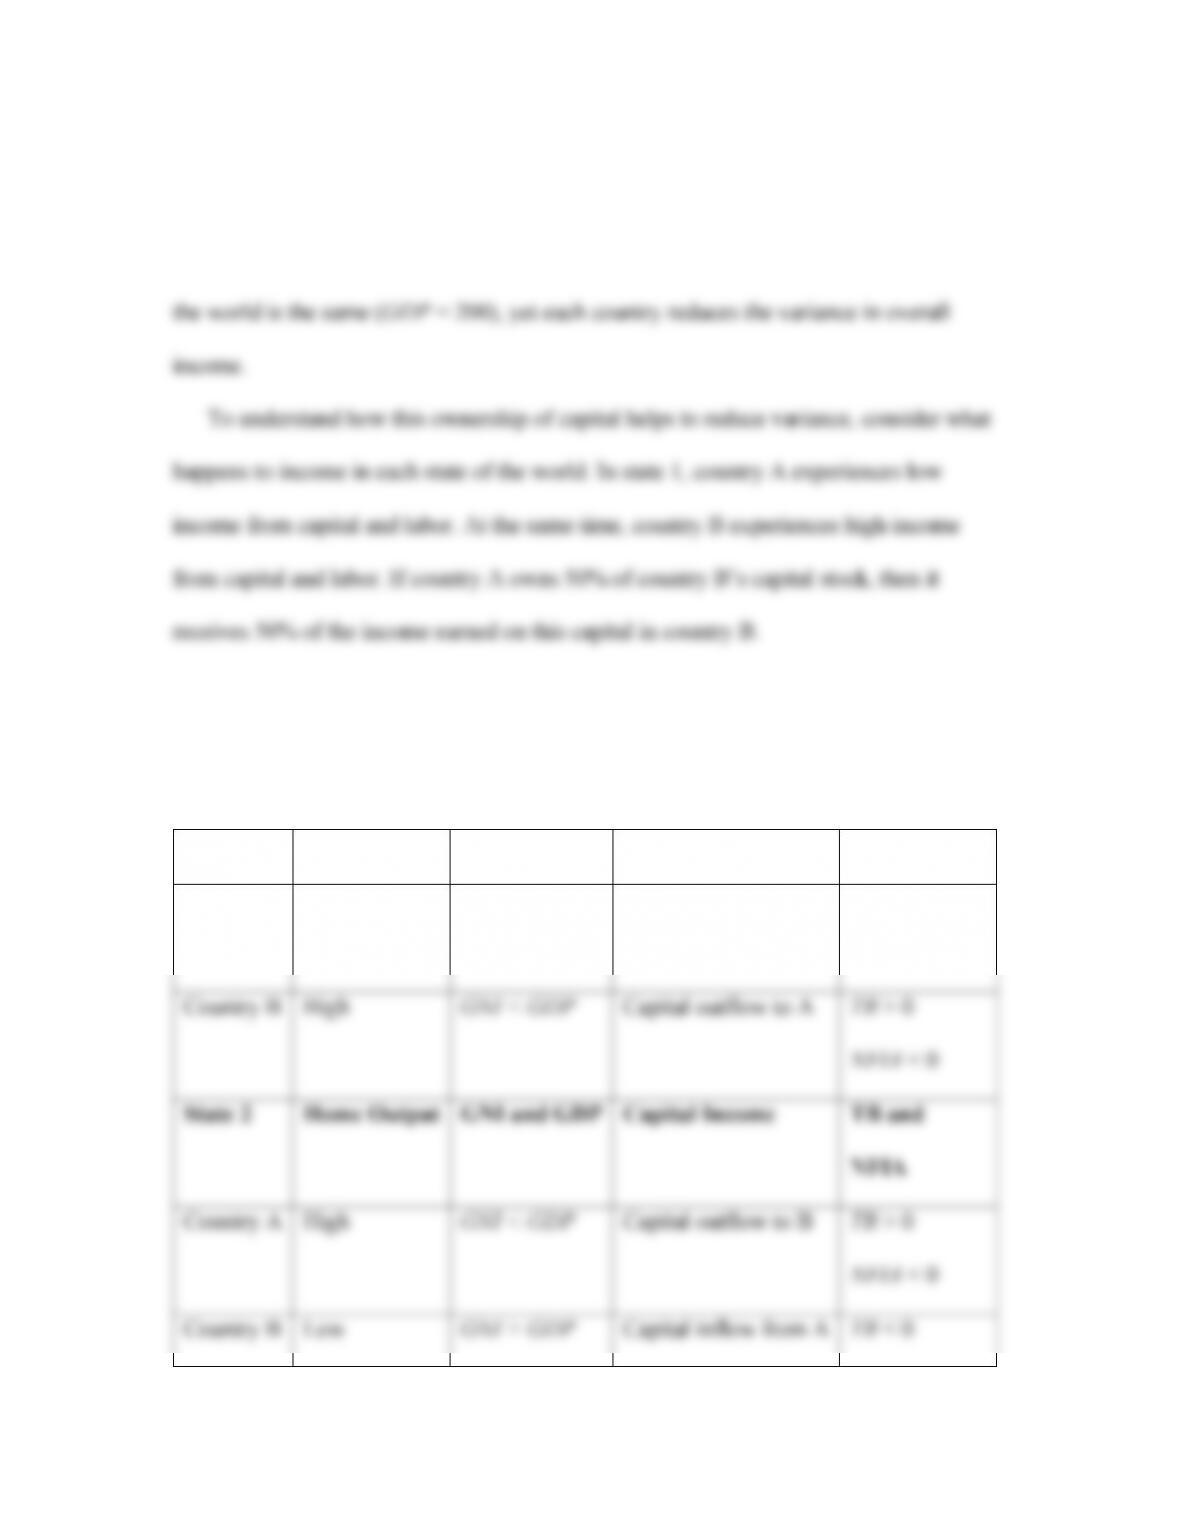
own each other’s labor, so labor income is the same as in the home portfolio case. From
panel (b), we observe that the countries are able to reduce the variation in income through
owning a portion of the other country’s capital stock. Note that the total level of output in
Therefore, we can summarize the flow of capital income and production in each
country:
State 1
Home Output
GNI and GDP
Capital Income
TB and NFIA
Country A
Low
GNI > GDP
Capital inflow from B
TB < 0
NFIA > 0
Country B
High
GNI < GDP
Capital outflow to A
TB > 0
Country A
High
GNI < GDP
Capital outflow to B
TB > 0
NFIA > 0
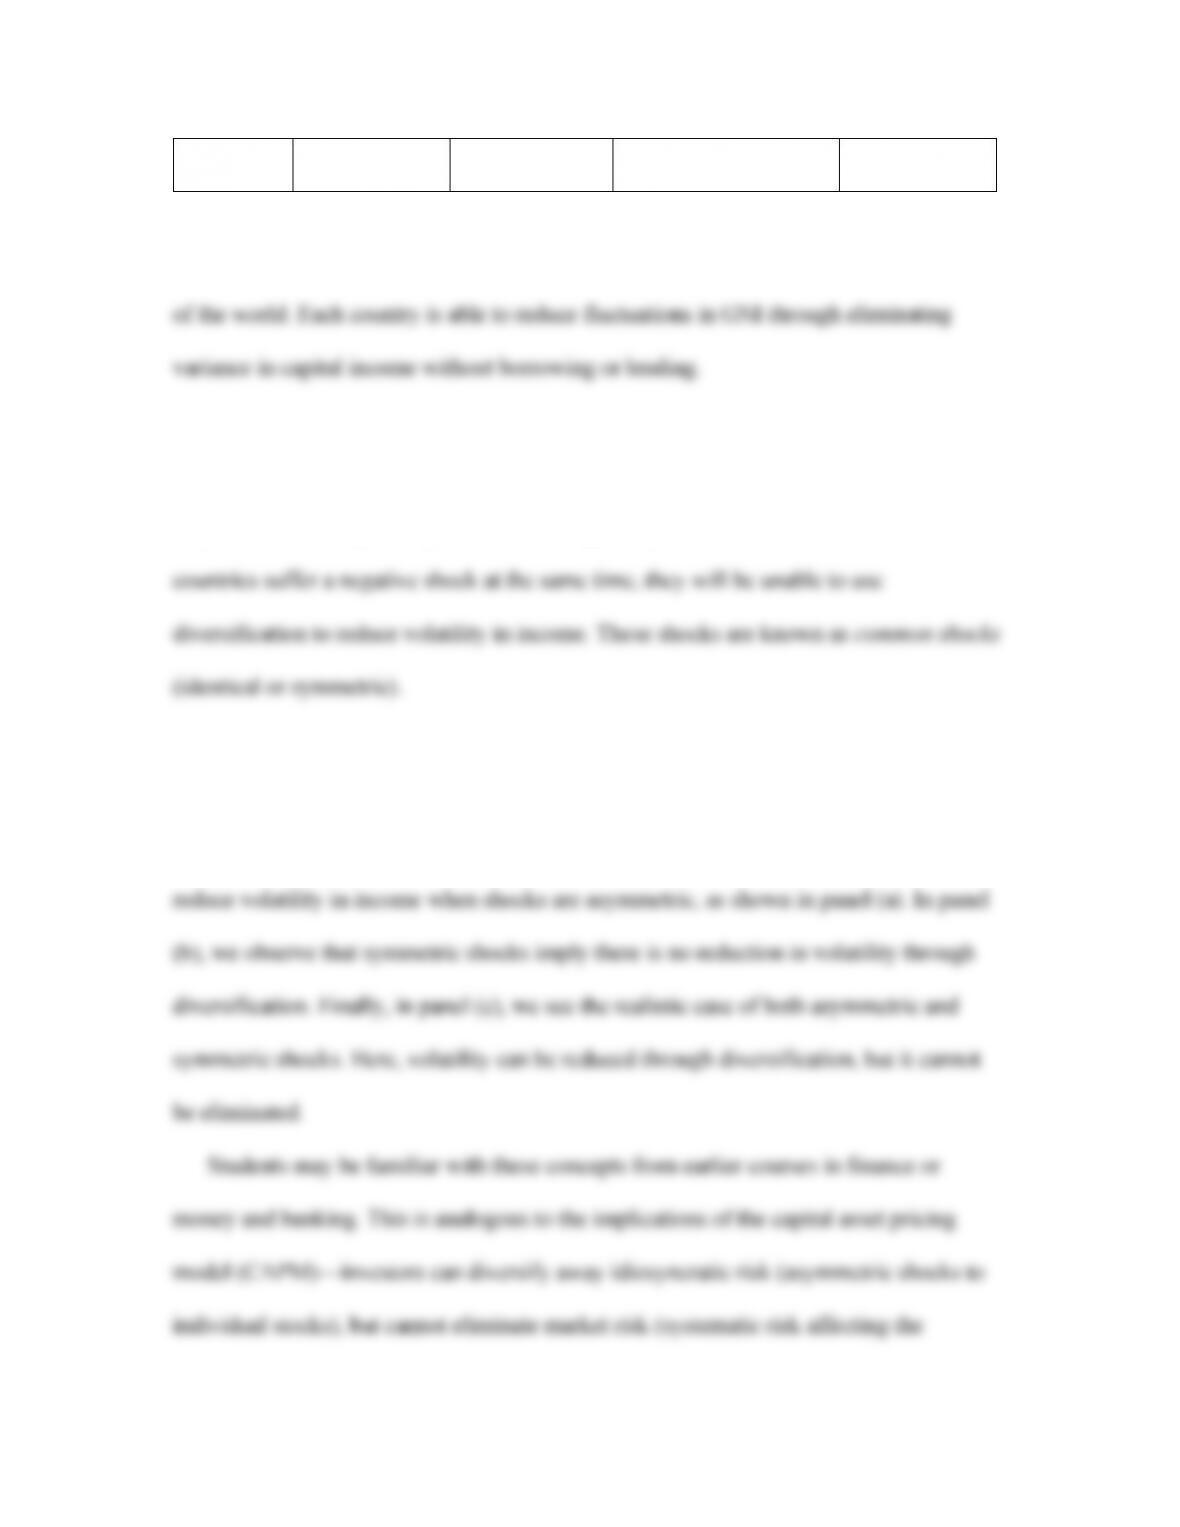
Figure 17-9 shows how each country’s income fluctuates between the two different states
Generalizing In reality, not all shocks to the economy are asymmetric. Countries can
only reduce volatility if output shocks are negatively correlated across countries. If both
Figure 17-10 shows how the volatility of income (the capital income portfolio) is
related to the fraction of the portfolio invested abroad in three cases: asymmetric shocks,
symmetric shocks, and a combination of the two. As stated previously, countries can
market).
Limits to Diversification: Capital Versus Labor Income In the previous model, the
country is unable to eliminate volatility associated with shocks to labor income. It is not
possible to trade ownership of labor across countries. (That is called “slavery” and is
illegal in nearly all countries.) However, it is worth noting that often shocks affect capital
APPLICATION
The Home Bias Puzzle
In the data, we observe a home bias: the tendency for investors to own a disproportionate
share of their wealth in home assets rather than foreign assets. This home bias can be
increased the return on their portfolios while reducing risk. Figure 17-11 illustrates the
possible scenarios—plotting the volatility in the return (risk) and the average return on
the portfolio. This figure looks similar to the one in Figure 17-10, panel (c).
What are the explanations for this home bias puzzle?
■ Revisit the assumptions used in the model: cost of acquiring foreign assets,
Summary: Don’t Put All Your Eggs in One Basket
The previous analysis highlights how diversification allows a country to reduce volatility
in income without borrowing or lending. This can be of great potential use to countries
that face high risk premiums, borrowing limits, and limited access to world capital
markets. If countries can pool their capital income streams, this allows them to buffer
against idiosyncratic shocks. The key lesson for countries, like households, is: don’t put
all your eggs in one basket. Through ownership of capital income streams from several
different sources, the likelihood of suffering dramatic shocks to income is reduced.
The ability to risk share in this way may be limited in practice because:
■ The number of assets is limited.
5 Conclusion
In the open economy, countries are able to reduce volatility in consumption and income
through borrowing or lending in world capital markets and through diversification.
Countries can take advantage of productive investment opportunities without sacrificing
consumption today.
The model’s implications are not observed in reality. Many countries are unable to
make use of the global capital market to take advantage of consumption smoothing and
efficiency gains from investment. Why? In some cases, countries have underdeveloped
Appendix: Common Versus Idiosyncratic Shocks
The appendix considers the general case in which countries experience both idiosyncratic
and common shocks.

A More General Case Suppose there are two levels of capital income: a and b for
countries A and B. These take a random value each period, during which time the
average shock in the two countries is . Using an algebraic manipulation that
differs from the textbook somewhat, we can add and subtract 1⁄2b to County A’s specific
shock to obtain
Similarly, for Country B,
In this way, we attribute shocks to each country to two parts: the average shock affecting
both countries and the country-specific shock. From the previous expressions, we see the
country-specific portions of each shock are exactly opposite of each other. Therefore, the
country-specific (idiosyncratic) shocks can be diversified away. However, there will still
be volatility in income attributed to the common shock, , in each country.
Numerical Example Figure 17-A1 is an extension of Figure 17-9 showing the partial
reduction in volatility achieved through diversification. Note that world capital income is
not constant because both countries are subject to common (world) shocks.
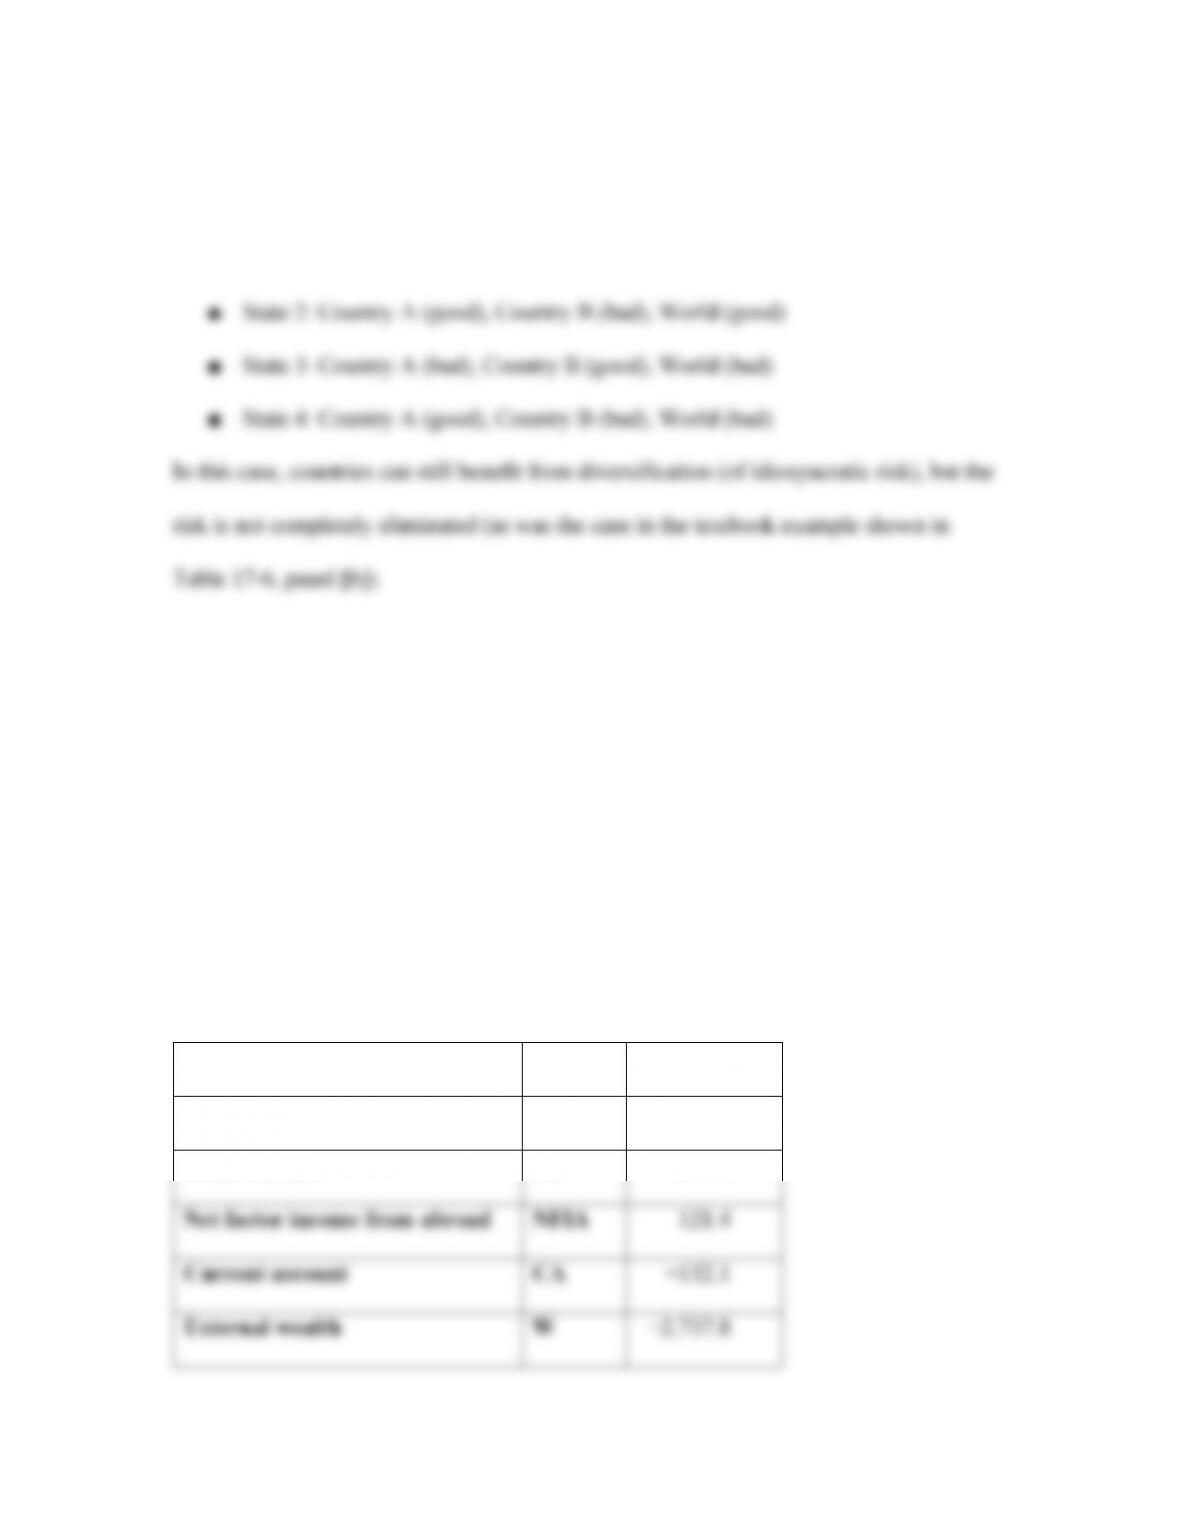
With the incorporation of common shocks, there are now four states of the world:
■ State 1: Country A (bad), Country B (good), World (good)
TEACHING TIPS
Teaching Tip 1 The table below shows values for the U.S. economy for the year 2009
(all values are real, not nominal). Assume the GDP, GNE, and NFIA grow 2% per year.
Construct a table similar to Table 17-3. Calculate the present value of GDP, GNE, and
the trade balance assuming that the period 5 value remains constant. Assume a discount
rate of 5%.
Output GDP
Y
12,880.6
Expenditure GNE
GNE
13,134.1
Trade balance
TB
−253.5
Net factor income from abroad
NFIA
121.4
Current account
CA
−132.1
External wealth
W
−2,737.8
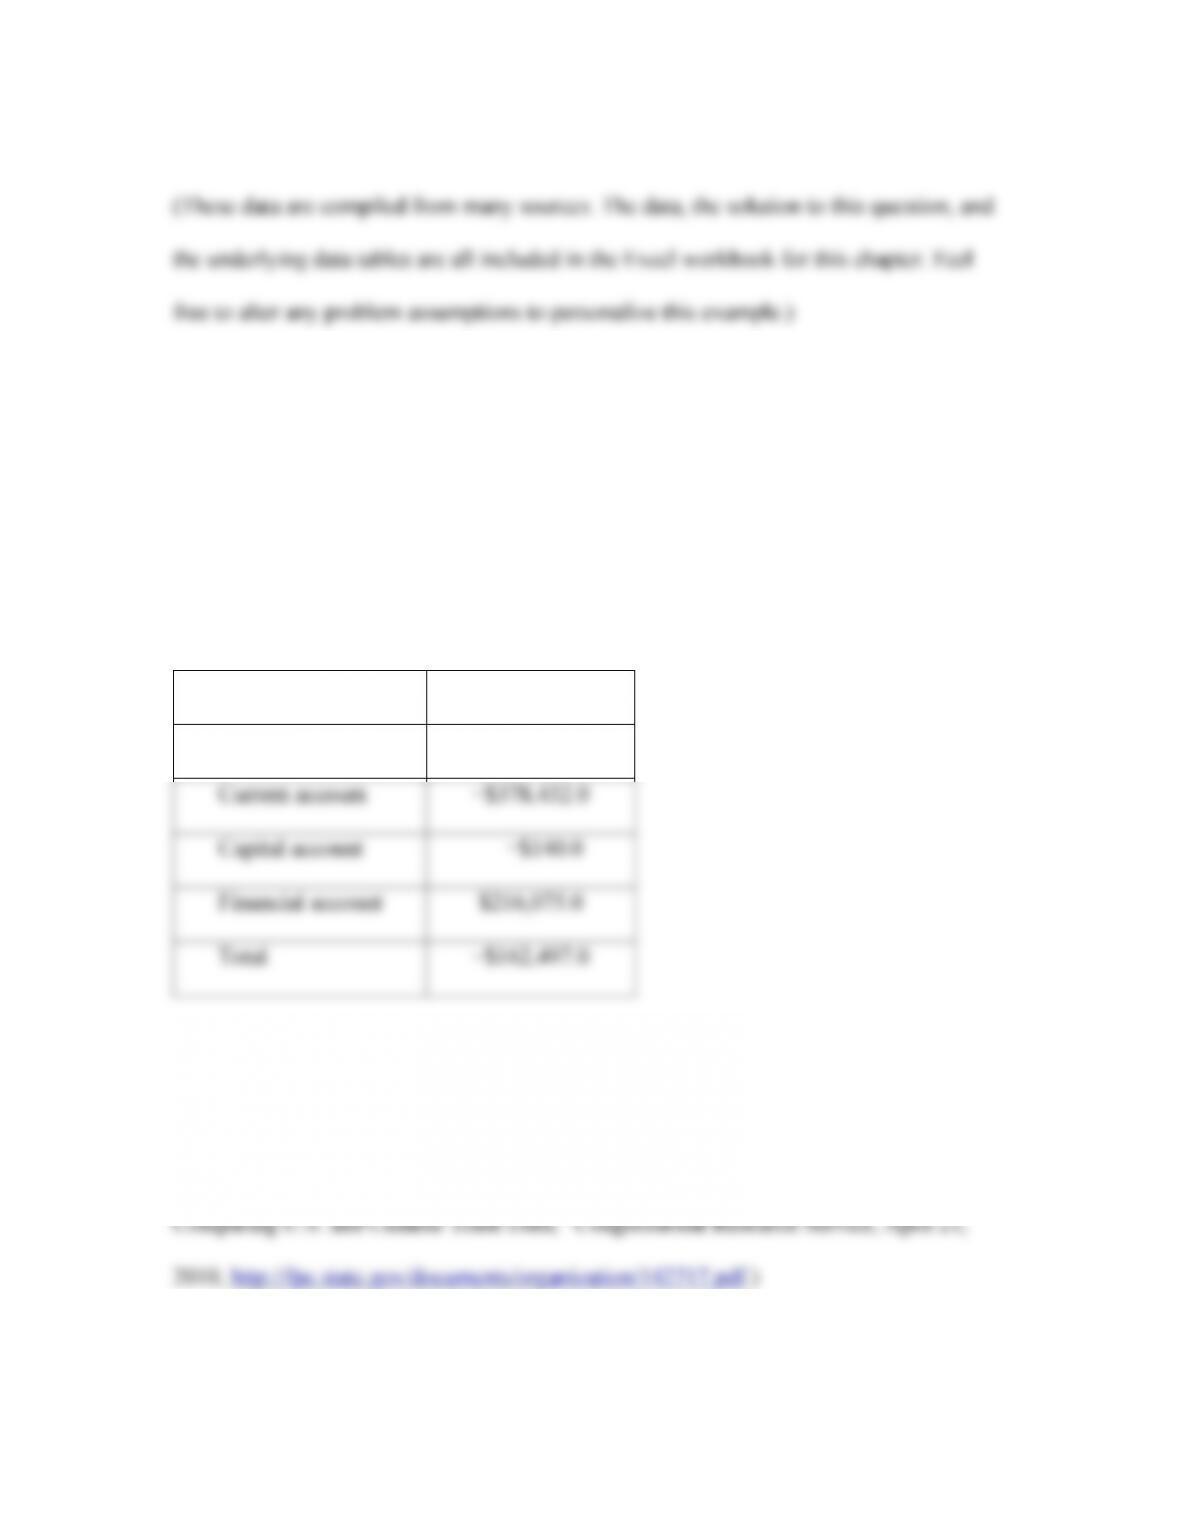
Teaching Tip 2 The table below summarizes U.S. international transactions for 2009.
Note that the balance of payments does not balance. In fact, the statistical discrepancy is
the same order of magnitude as the current and financial account balances. Why might
the statistical discrepancy have been so high in 2009? Discuss.
(Millions of dollars)
2009
Trade balance
−$374,908.0
Current account
−$378,432.0
Capital account
−$140.0
Financial account
$216,075.0
Total
−$162,497.0
(These data are compiled from many sources. The data, the solution to this question, and
the underlying data tables are all included in the Excel workbook for this chapter. Before
assigning this question you may want to read Michael F. Martin, “What’s the Difference?
IN–CLASS PROBLEMS
1. In each of the following situations, describe briefly how one can make use of
financial markets and transfers to help offset the negative consequences of an
economic shock.
a. A college student needs to repeat a class, leading to a one-time increase in his
tuition expenses.
Answer: The student can borrow to finance the increase in tuition and repay the
b. A small business owner in Los Angeles faces a reduction in sales and damage to
her property as the result of an earthquake.
Answer: To rebuild lost and damaged capital, the owner can borrow from a bank
c. Bangladesh experiences widespread physical damage and job loss resulting from
a monsoon.
Answer: This is analogous to the case of a hurricane given at the beginning of the
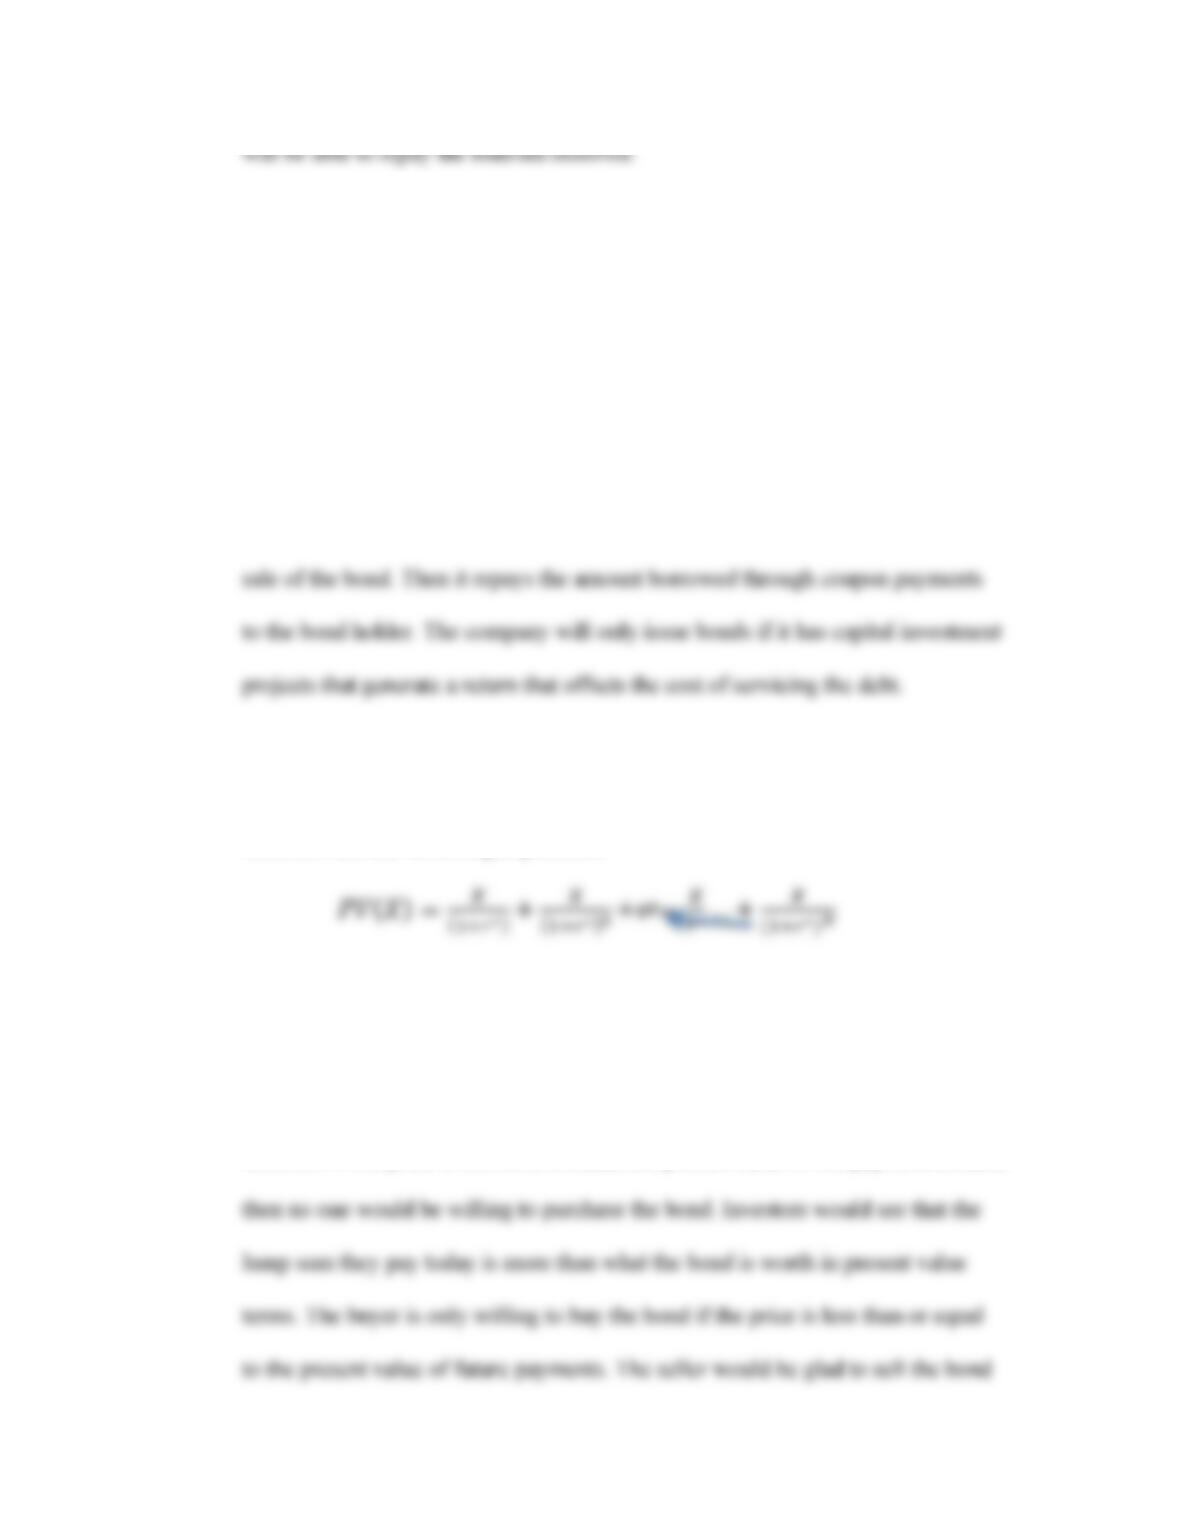
2. Suppose that an investor considers purchasing a bond that makes regular fixed annual
payments (coupons, X) in each period. The initial coupon payment is made one
period after the bond is issued. Assume the interest rate for this bond is denoted i, and
that the bond makes these payments forever.
a. Why might a company issue a bond?
Answer: The company can raise a lump sum of money today through the initial
b. Write out an expression for the present value of this bond, given the previous
information.
Answer: See the following expression:
c. Suppose that the price of this bond exceeds the present value from (b). Would the
investor purchase the bond in this case? Would the seller be willing to sell it at
this price? Explain briefly.
Answer: If the price of the bond exceeds the present value of the payment stream,
d. How would your answer to (c) differ if the price of the bond is less than the
present value from (b)? What does this reveal about the relationship between the
price of the bond and its present value?
Answer: In this case, the bond is sold at a bargain price. The buyers would be
e. How do your previous answers relate to the concept of a long-run budget
constraint and external wealth?
Answer: The LRBC says that a country’s initial wealth must be equal to the
3. In 1899, William Miller established the Franklin Syndicate in New York. When
investors joined the syndicate, they were promised a return of 10% each week. Miller
encouraged members to reinvest their return to take advantage of the high interest.
Why would Miller discourage investors to cash out their profits? How is this scenario
related to the idea of serviced and non-serviced debt?
Answer: This was a Ponzi scheme. Miller borrowed funds up front, promising a 10%
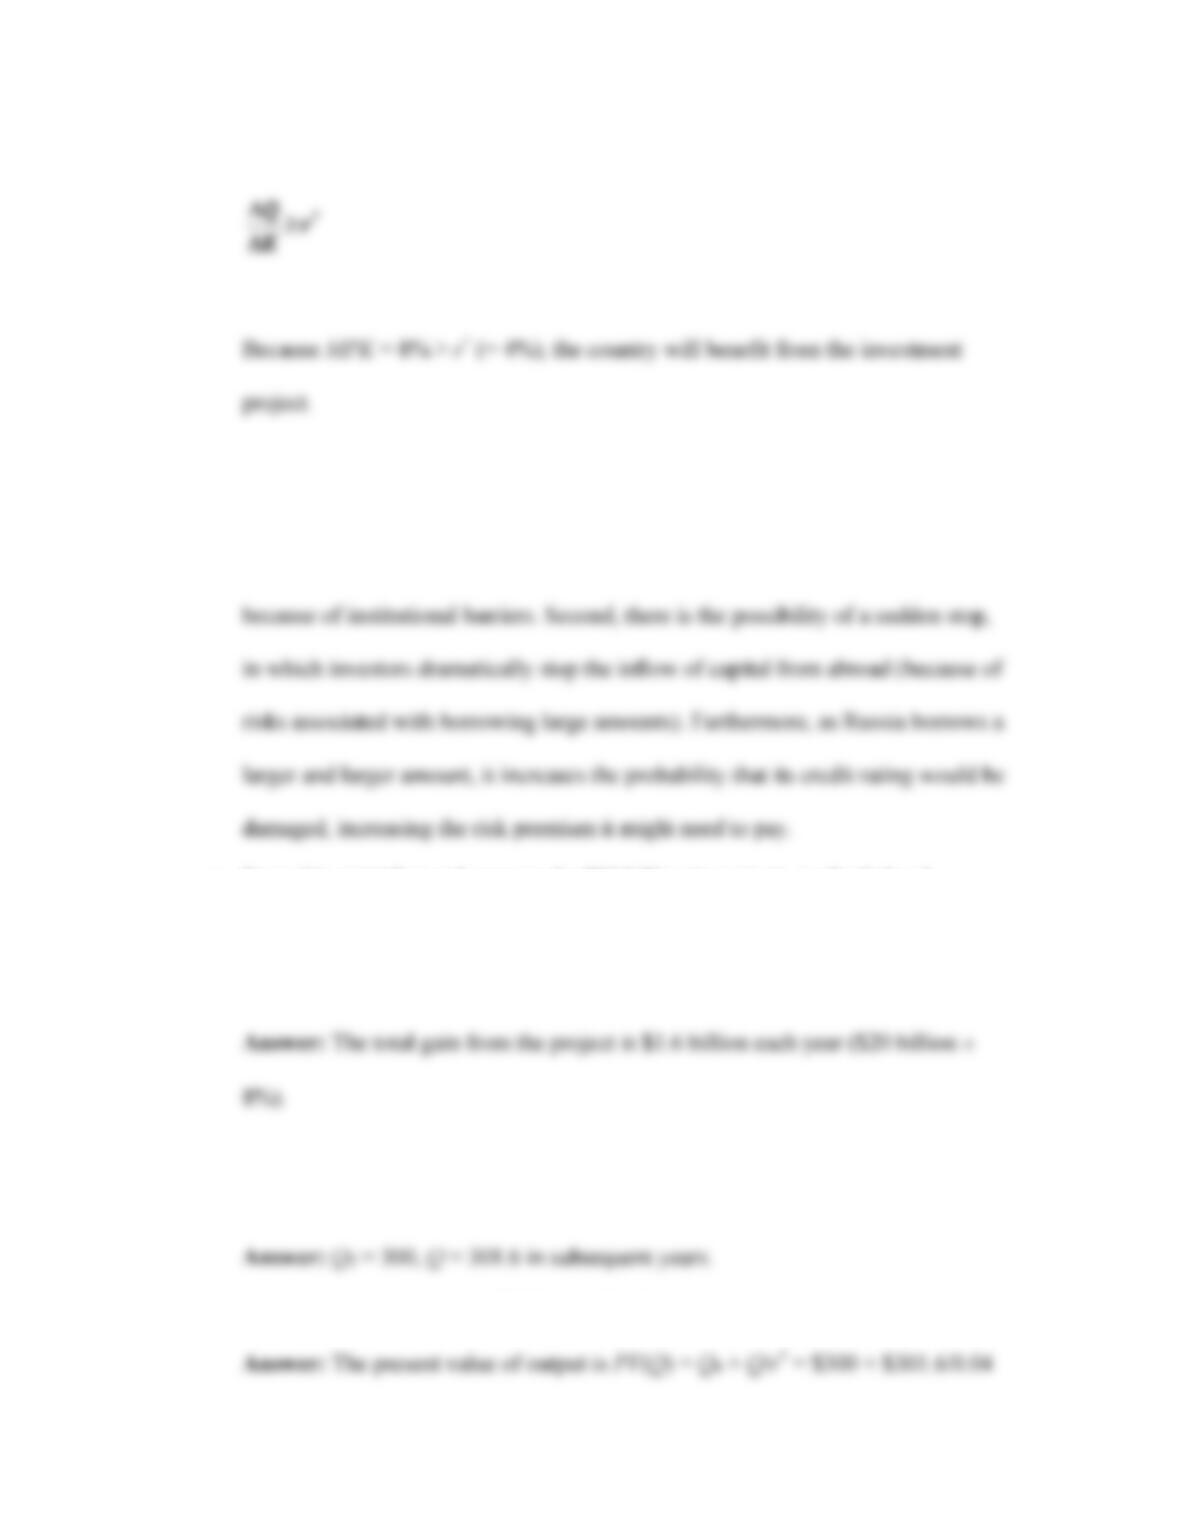
4. Assume all dollar units are real dollars in billions. It is year 0. Russia plans to raise
$24 billion to finance domestic investment projects with a marginal product of capital
(MPK) equal to 8%. Russia has the option to borrow $20 billion from the rest of the
world at the world real interest rate, r* = 4%. After year 0, Russia neither borrows nor
invests (I = 0 in all years except year 0). Use the standard assumptions: no initial
external wealth W (W−1 = 0), no government spending (G = 0); and assume I = 0
except in year 0, and no unilateral transfers or capital gains (NUT = KA = 0) so that
there is no net labor income and NFIA = r*W. The projects start to pay off in year 1
and all years thereafter. Interest is paid in perpetuity in year 1 and every year
thereafter. In addition, assume that if the projects are not done, then Q = $300 billion
in all years and PV(Q) = 7,800.
a. Should Russia fund these projects?
Answer: Yes. The criterion for undertaking an investment project is
b. State two reasons why Russia may be unable to obtain the full $24 billion needed
to finance all of its efficient investment opportunities.
Answer: First, Russia may have limited access to the global capital market
c. From this point forward, assume the $20 billion in projects are funded and
completed in year 0. If the MPK is 8%, what is the total payoff from projects in
future years?
d. What is Russia’s Q = GDP in year 0 in dollars? In year 1 and later years in
dollars?
e. At year 0, what is the new PV(Q) in dollars?
f. At year 0, what is the new PV(I) in dollars? What is the new PV(C) in dollars?
Answer: The present value of investment is PV(I) = ∆K = 20.
g. Assume that Russia is consumption smoothing. What is the percent change in
PV(C)? What is the new level of consumption (C) in all years? Is Russia better
off?
Answer: The percent change in the present value of consumption (compared with
h. For the year the projects go ahead, year 0, calculate Russia’s CA, TB, NFIA, and
FA.
Answer: In year 0, the values are as follows: