5 (16) National and International Accounts: Income, Wealth, and the Balance of
Payments
1. Discovering Data In this question you will study the official macroeconomic statistics
reported in your country. These can be found by searching the web for “National
Accounts” and your country’s name. In the United States, these can be found at
http://www.bea.gov and by accessing the National Income and Product Account (NIPA)
tables 1.1.5 and 4.1.
Answers will vary depending on the country and year used. Here I have 2016 annual
data from the United States.
a. Using annual data, compute GDP, GNE, and GNDI in the most recent year.
Answer:
b. Was your country’s GDP higher or lower than its GNE in the past year? Interpret
this finding.
c. Was your country’s GNI higher or lower than its GDP? Interpret this finding.
d. Was your country a net giver or receiver of unilateral transfers?
2. To the right is a partial table of OECD member countries using data from the World
Bank, with the countries ranked according to their GDP per capita in 2014 (these
numbers are reported in current U.S. dollars). Compute the ratio of GNI to GDP in
each case. What does this imply about net factor income from abroad in each
country? Compute the GNI rankings of these countries. Are there any major
differences between the GDP and the GNI rankings? What do these differences
imply?
GDP per Person
GNI per Person
1
Luxembourg
$116,613
$75,960
2
Norway
$97,300
$103,620
3
Switzerland
$85,617
$84,720
4
Australia
$61,980
$64,600
5
Denmark
$60,718
$61,330
6
Sweden
$58,899
$61,570
7
United States
$54,630
$55,230
8
Ireland
$54,339
$46,520
9
Netherlands
$52,138
$51,630
10
Austria
$51,122
$49,600
11
Canada
$50,231
$51,630
12
Finland
$49,842
$48,440
13
Germany
$47,774
$47,590
14
Belgium
$47,328
$47,240
15
United Kingdom
$46,297
$43,390
16
New Zealand
$44,342
$41,070
17
France
$42,726
$42,950
18
Israel
$37,206
$35,320
19
Japan
$36,194
$42,000
20
Italy
$35,223
$29,390
21
Spain
$29,721
$29,390
22
South Korea
$27,971
$27,090
23
Slovenia
$24,002
$23,580
24
Portugal
$22,124
$21,360
25
Greece
$21,673
$22,810
26
Czech Republic
$19,502
$18,350
27
Estonia
$20,147
$19,010
28
Poland
$14,082
$13,680
29
Hungary
$14,027
$13,340
30
Turkey
$10,515
$10,830
31
Mexico
$10,325
$9,870
Answer: See the following tables. To see the implications for net factor income, note
NFIA = GNI − GDP. Therefore, if GNI/GDP > 1, then GNI > GDP, and NFIA = 0.
GDP per Person
GNI per
Person
GNI/GDP
Ratio
GNI per
Ranking
1
Luxembourg
$116,613
$75,960
0.6514
30
2
Norway
$97,300
$103,620
1.0650
2
3
Switzerland
$85,617
$84,720
0.9895
14
4
Australia
$61,980
$64,600
1.0423
5
5
Denmark
$60,718
$61,330
1.0101
9
6
Sweden
$58,899
$61,570
1.0453
4
7
United
States
$54,630
$55,230
1.0110
8
8
Ireland
$54,339
$46,520
0.8561
28
9
Netherlands
$52,138
$51,630
0.9903
13
10
Austria
$51,122
$49,600
0.9702
19
11
Canada
$50,231
$51,630
1.0279
7
12
Finland
$49,842
$48,440
0.9719
17
13
Germany
$47,774
$47,590
0.9961
12
14
Belgium
$47,328
$47,240
0.9981
11
15
United
Kingdom
$46,297
$43,390
0.9372
26
16
New
Zealand
$44,342
$41,070
0.9262
27
17
France
$42,726
$42,950
1.0052
10
18
Israel
$37,206
$35,320
0.9493
23
19
Japan
$36,194
$42,000
1.1604
1
20
Italy
$35,223
$29,390
0.8344
29
21
Spain
$29,721
$29,390
0.9889
15
22
South Korea
$27,971
$27,090
0.9685
20
23
Slovenia
$24,002
$23,580
0.9824
16
24
Portugal
$22,124
$21,360
0.9655
21
25
Greece
$21,673
$22,810
1.0525
3
Czech
Republic
0.9409
25
27
Estonia
$20,147
$19,010
0.9436
24
28
Poland
$14,082
$13,680
0.9715
18
29
Hungary
$14,027
$13,340
0.9510
22
30
Turkey
$10,515
$10,830
1.0300
6
The following table is sorted by the ranking of GNI/GDP for convenience.
GDP per
Person
GNI per
Person
GNI/GDP
Ratio
GNI/GDP
Ranking
19
Japan
$36,194
$42,000
1.1604
1
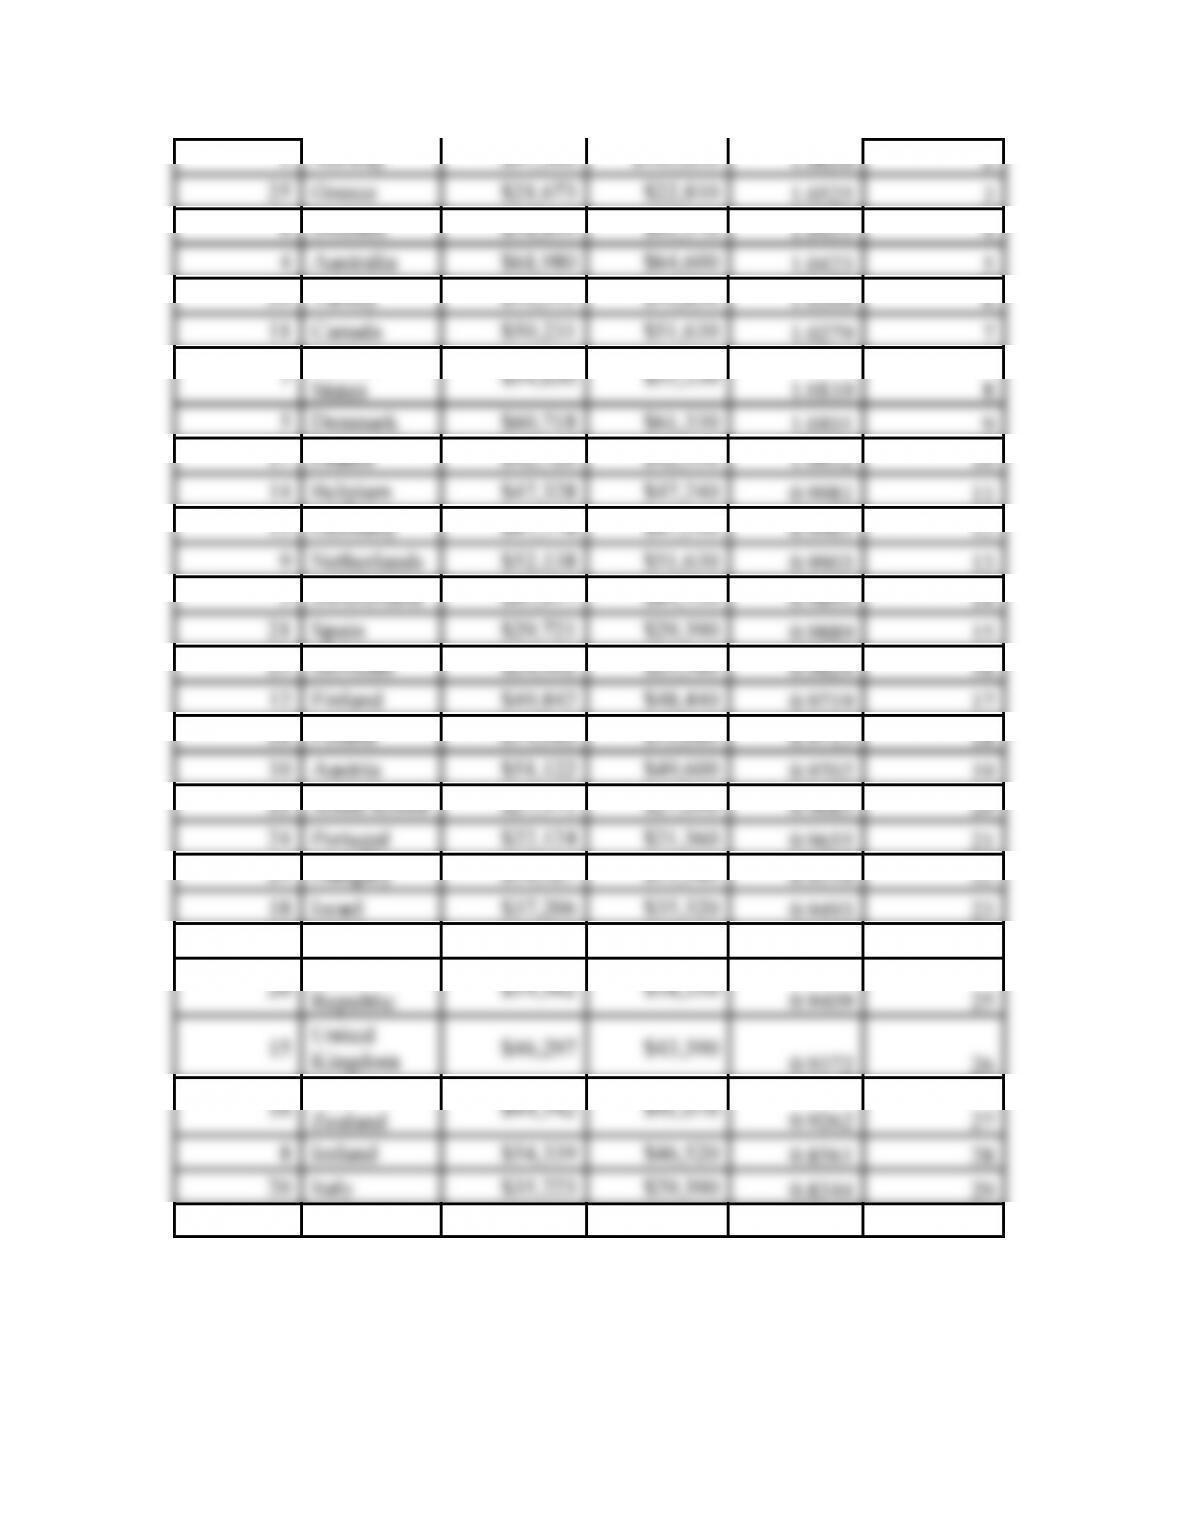
2
Norway
$97,300
$103,620
1.0650
2
25
Greece
$21,673
$22,810
1.0525
3
6
Sweden
$58,899
$61,570
1.0453
4
4
Australia
$61,980
$64,600
1.0423
5
30
Turkey
$10,515
$10,830
1.0300
6
11
Canada
$50,231
$51,630
1.0279
7
7
United
States
$54,630
$55,230
1.0110
8
1.0052
10
0.9981
11
0.9961
12
0.9903
13
0.9895
14
0.9889
15
0.9824
16
0.9719
17
0.9715
18
0.9702
19
0.9685
20
0.9655
21
0.9510
22
0.9493
23
27 Estonia $20,147
$19,010
0.9436
24
Czech
Republic
0.9409
25
0.9372
26
Zealand
0.9262
27
8
Ireland
$54,339
$46,520
0.8561
28
20
Italy
$35,223
$29,390
0.8344
29
0.6514
30
1.0101
9
Using this expression, show that in a closed economy, gross domestic product (GDP),
gross national income (GNI), and gross national expenditures (GNE) are the same.
Show that domestic investment is equal to domestic savings.
Answer: Starting from the expression
Work It Out
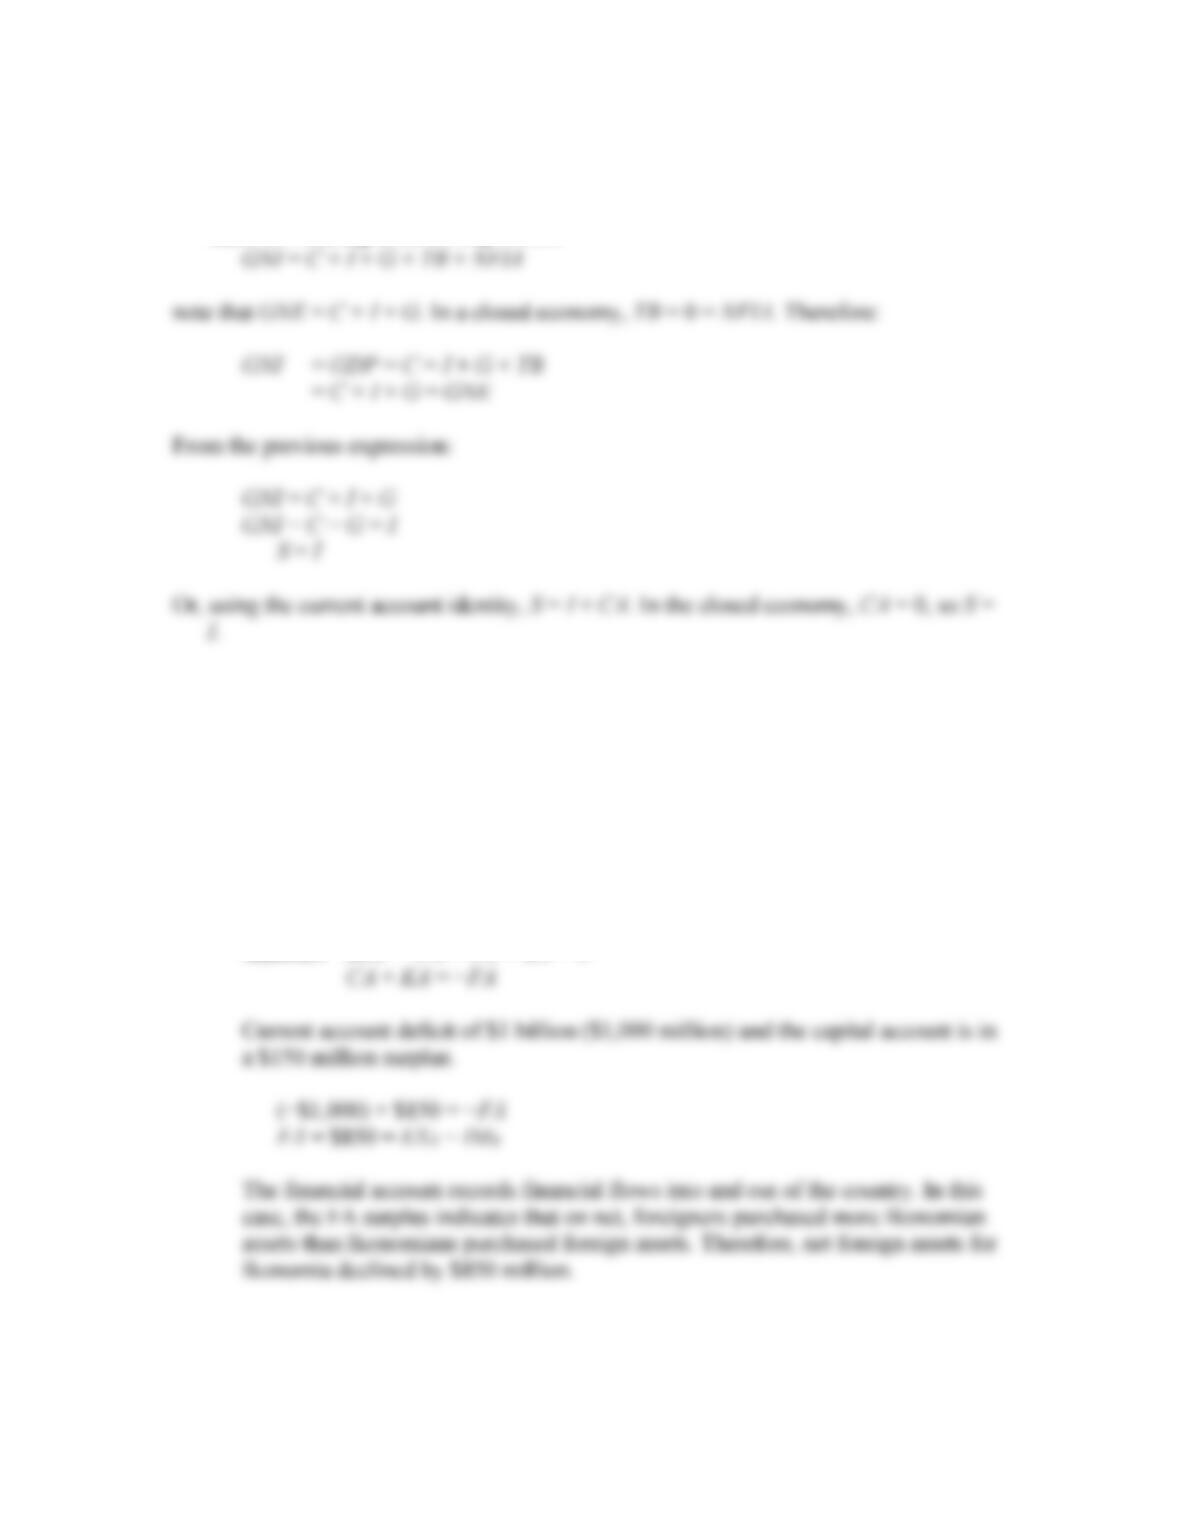
5. In 2016 the country of Ikonomia has a current account deficit of $1 billion and a
nonreserve financial account surplus of $700 million. Ikonomia’s capital account is in
a $150 million surplus. In addition, Ikonomian factors located in foreign countries
earn $700 million. Ikonomia has a trade deficit of $600 million. Assume Ikonomia
neither gives nor receives unilateral transfers. Ikonomia’s GDP is $9.4 billion.
a. What happened to Ikonomia’s net foreign assets during 2016? Did it acquire or
lose foreign assets during the year?
Answer: BOP = CA + FA + KA = 0
b. Compute the official settlements balance (OSB). Based on this number, what
happened to the central bank’s (foreign) reserves?
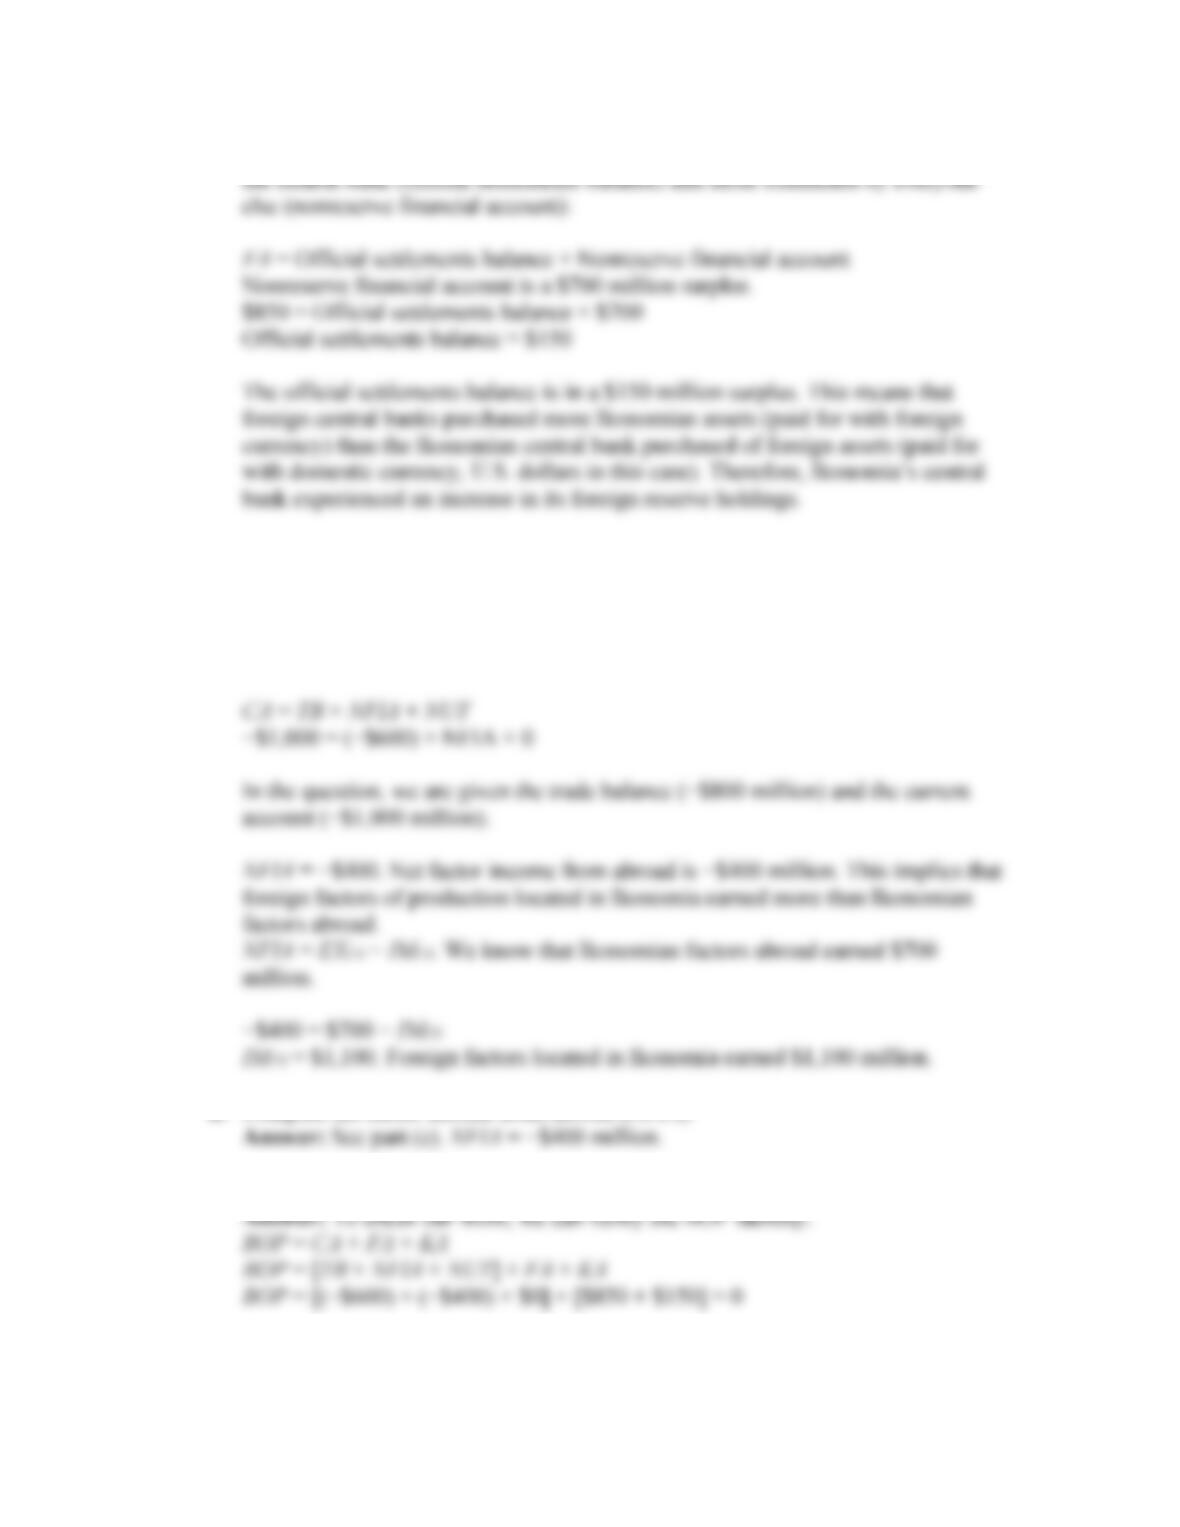
Answer: The financial account can be split into those transactions conducted by
c. How much income did foreign factors of production earn in Ikonomia during
2016?
Answer: The current account can be split into three components: the trade
balance (final goods and services), the net factor income from abroad (payments
to/from factor services), and the net unilateral transfers.
d. Compute net factor income from abroad (NFIA).
e. Using the identity BOP = CA + FA + KA, show that BOP = 0.
f. Compute Ikonomia’s gross national expenditure (GNE), gross national income
(GNI), and gross national disposable income (GNDI).
Answer: We know that GDP = C + I + G + (EX − IM) = GNE + TB.
4. Show how each of the following would affect the U.S. balance of payments. Include a
description of the debit and credit items, and in each case identify which specific
account is affected (e.g., imports of goods and services, IM; exports of assets, EXA;
and so on). (For this question, you may find it helpful to refer to Appendix 1.)
a. A California computer manufacturer purchases a $50 hard disk from a Malaysian
company, paying the funds from a bank account in Malaysia.
Answer:
Description
BOP Account
Account (detail)
Credit/Debit
Hard disk imported from
Malaysia
CA (↓)
−IM (↑), TB (↓)
−$50
Decrease in Malaysian deposits
owned by U.S. firm
FA (↑)
−IMF
A
(↓)
+$50
b. A U.S. tourist to Japan sells his iPod to a local resident for yen worth $100.
Answer:
Description
BOP Account
Account (detail)
Credit/Debit
iPod exported to Japan
CA (↑)
+EX (↑), TB (↑)
+$100
Increase in Japanese currency
owned by U.S. tourist
FA (↓)
−IMF
A
(↑)
−$100
c. The U.S. central bank purchases $500 million worth of U.S. Treasury bonds from
a British financial firm and sells pound sterling foreign reserves.
Answer:
Description
BOP Account
Account (detail)
Credit/Debit
U.S. bonds sold to British firm
FA (↓)
+EXHA (↓)
+$500 million
Pound sterling reserves
imported from Britain
FA (↑)
−IMF
A
(↓)
−$500 million
d. A U.S. owner of Sony shares receives $10,000 in dividend payments, which are
paid into a Tokyo bank.
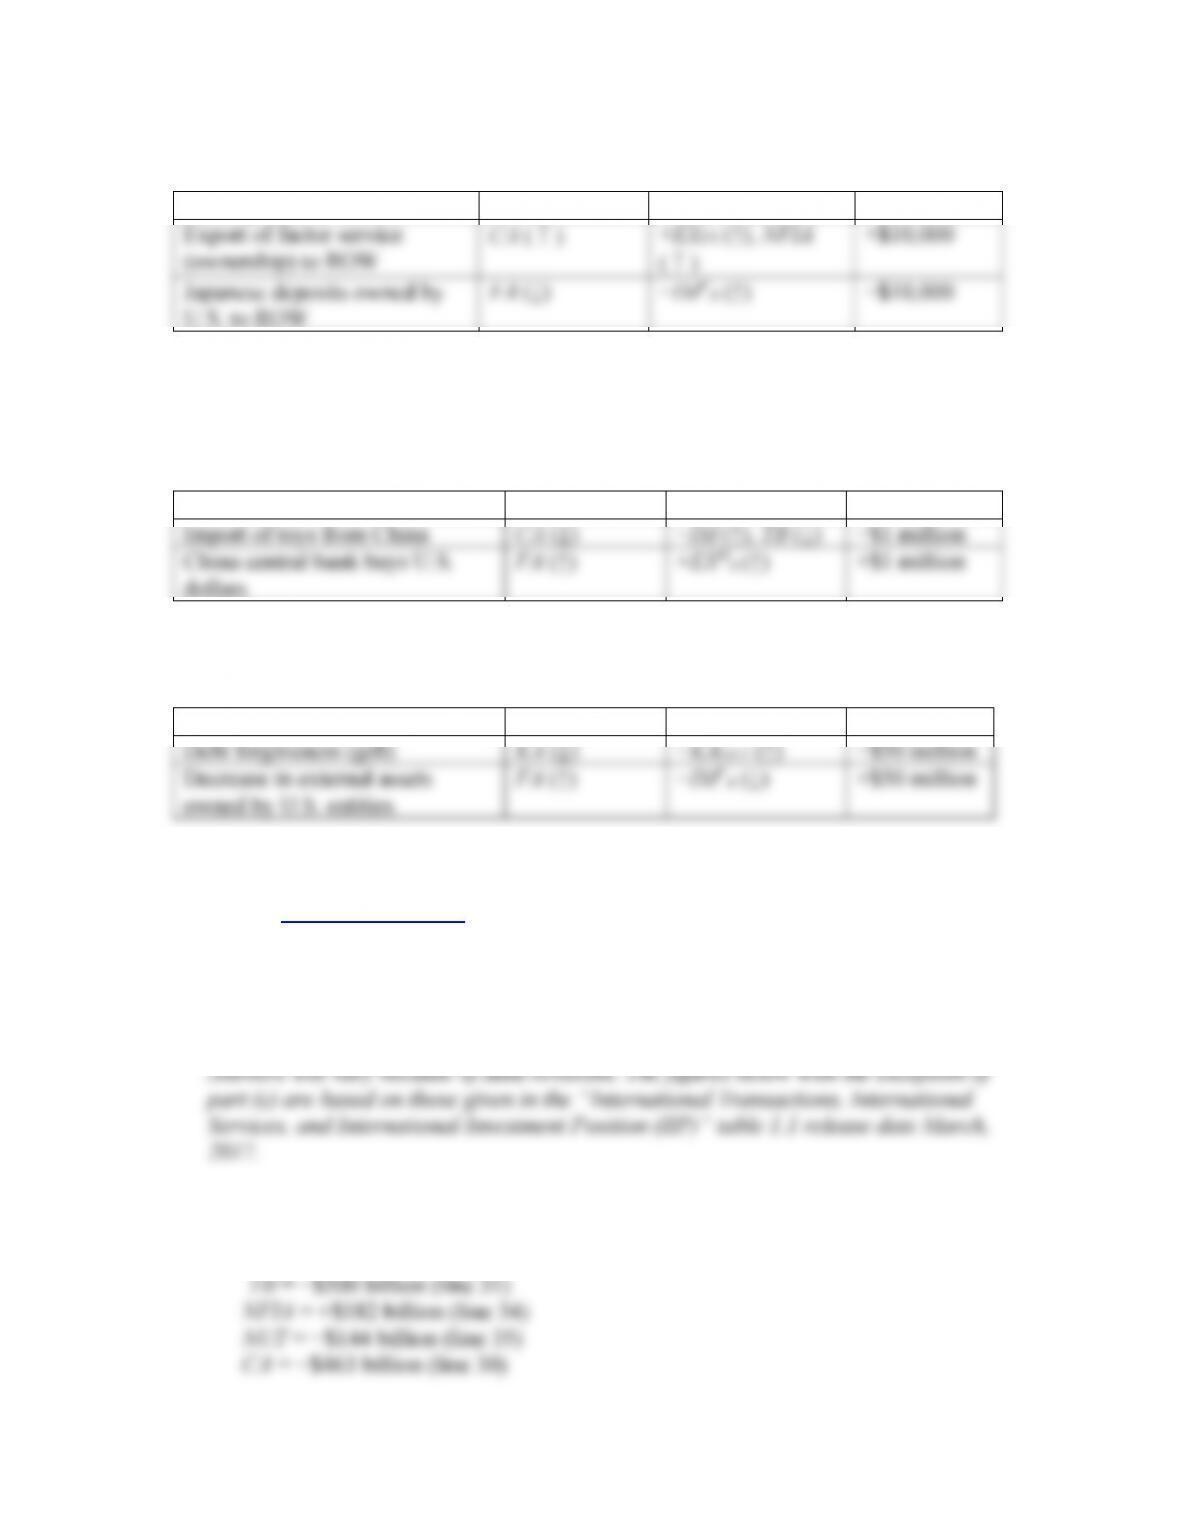
Answer:
Description
BOP Account
Account (detail)
Credit/Debit
Export of factor service
(ownership) to ROW
CA (
↑
)
+EX
FS
(↑), NFIA
(
↑
)
+$10,000
Japanese deposits owned by
U.S. to ROW
FA (↓)
−IMF
A
(↑)
−$10,000
e. The central bank of China purchases $1 million of export earnings from a firm
that has sold $1 million of toys to the United States, and the central bank holds
these dollars as reserves.
Answer:
Description
BOP Account
Account (detail)
Credit/Debit
Import of toys from China
CA (↓)
−IM (↑), TB (↓)
−$1 million
China central bank buys U.S.
dollars
FA (↑)
+EXH
A
(↑)
+$1 million
f. The U.S. government forgives a $50 million debt owed by a developing country.
Answer:
Description
BOP Account
Account (detail)
Credit/Debit
Debt forgiveness (gift)
KA (↓)
−KAOUT (↑)
−$50 million
Decrease in external assets
owned by U.S. entities
FA (↑)
−IMF
A
(↓)
+$50 million
5. To answer this question, you must obtain data from the Bureau of Economic Analysis
(BEA), http://www.bea.gov, on the U.S. balance of payment (BOP) tables. Go to
interactive tables to obtain annual data for 2015 (the default setting is for quarterly
data). It may take you some time to become familiar with how to navigate the
website. You need only refer to Table 1 on the BOP accounts. Using the BOP data,
compute the following for the United States:
a. Trade balance (TB), net factor income from abroad (NFIA), net unilateral
transfers (NUT), and current account (CA)
Answer: (Rounding to the nearest billion)
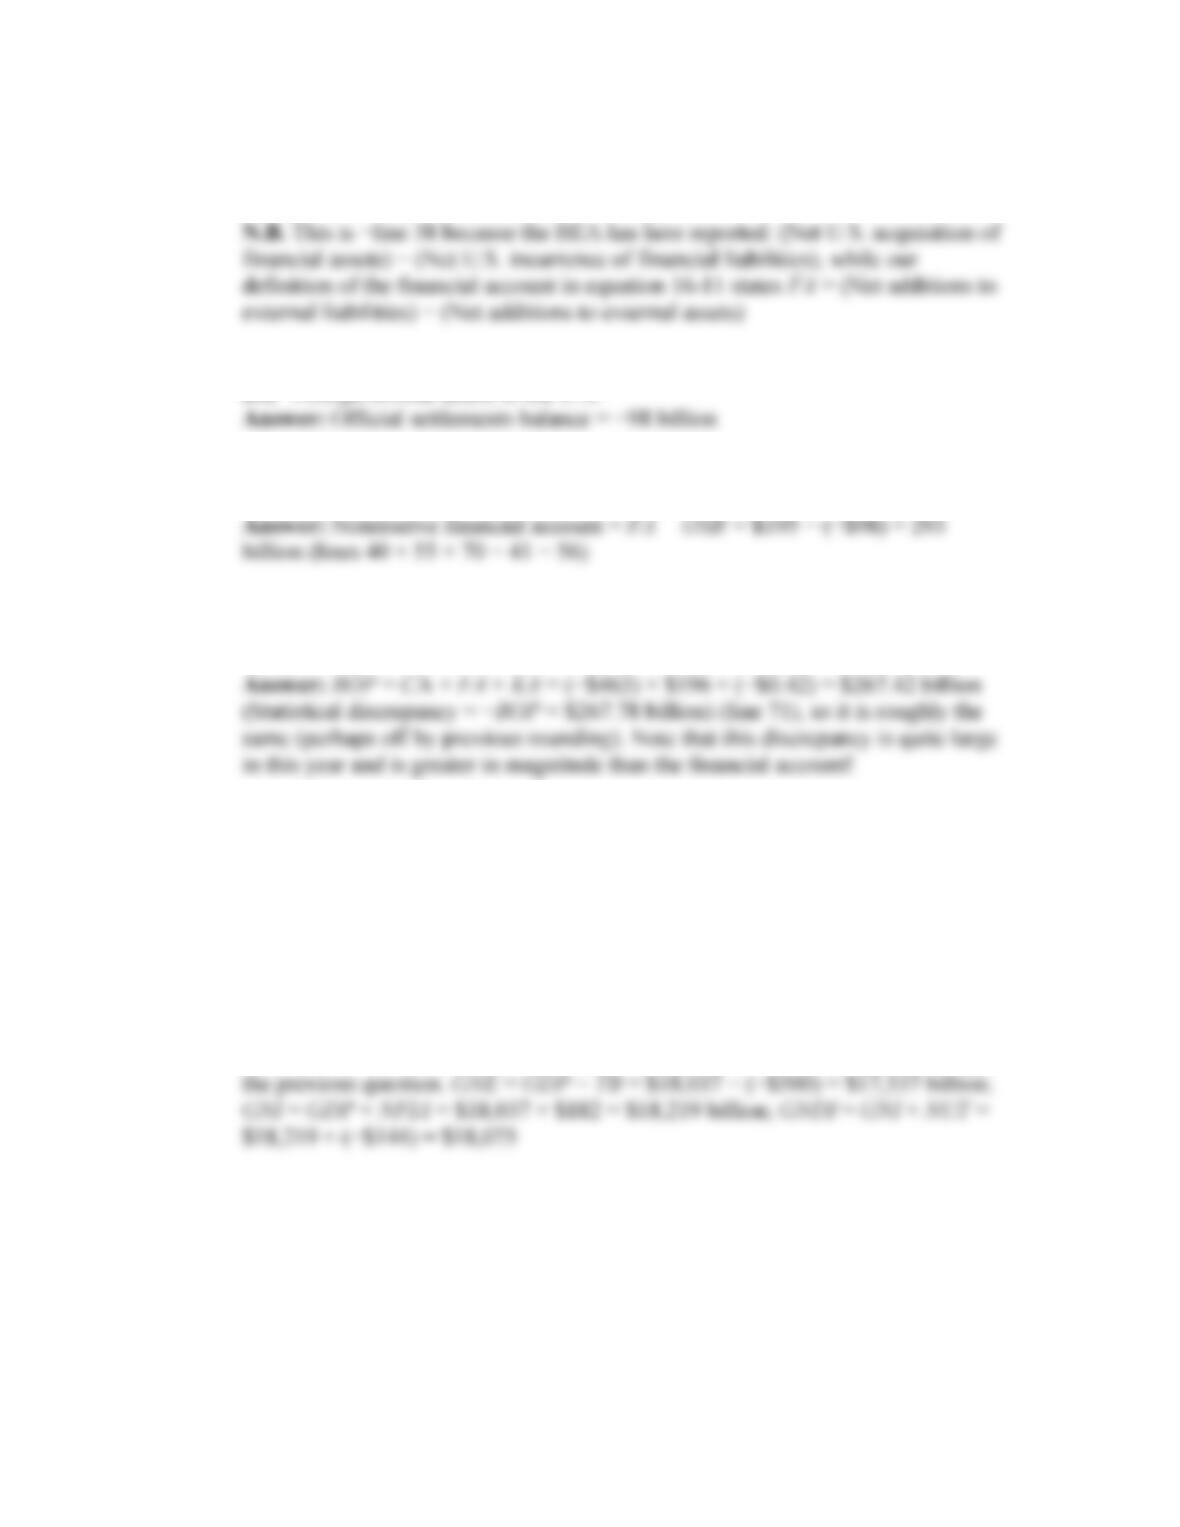
b. Financial account (FA)
Answer: FA = +$195 billion (lines 24-19-28)
c. Official settlements balance (OSB), referred to as “U.S. official reserve assets”
and “Foreign official assets in the U.S.”
d. Nonreserve financial account (NRFA)
e. Balance of payments (BOP). Note that this may not equal zero because of
statistical discrepancy. Verify that the discrepancy is the same as the one reported
by the BEA.
6. Continuing from the previous question, find nominal GDP for the United States in
2015 (you can find it elsewhere on the BEA site). Use this information along with
your previous calculations to compute the following:
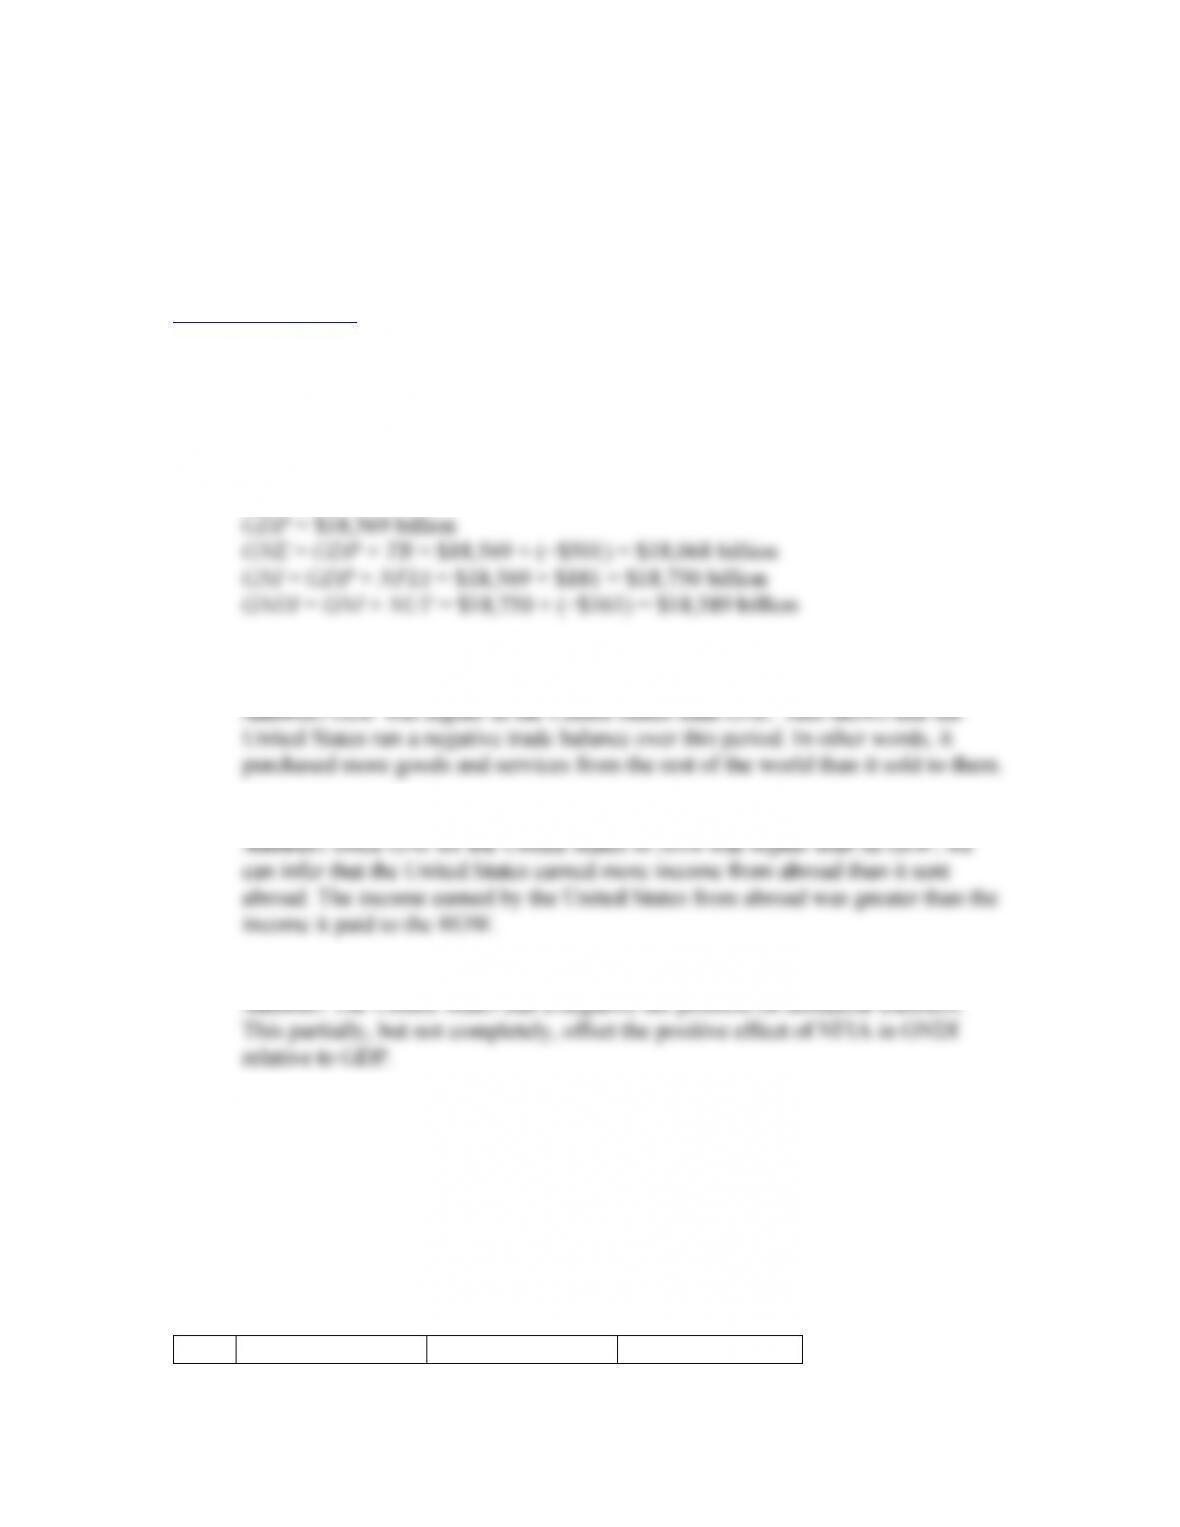
Answers will vary because of data revisions. The figures below use data from NIPA
Table 1.1.5 as revised in March 2017. It reports GDP = $18,037 billion.
a. Gross national expenditure (GNE), gross national income (GNI), and gross
national disposable income (GNDI)
Answer: We use the GDP reported above along with the data used in answering
b. In macroeconomics, we often assume the U.S. economy is a closed economy
when building models that describe how changes in policy and shocks affect the
economy. Based on the previous data (BOP and GDP), do you think this is a
reasonable assumption to make? Do international transactions account for a large
share of total transactions (involving goods and services, or income) involving the
United States?
Answer: Based on calculations above, we see that GDP = $18,037 billion,
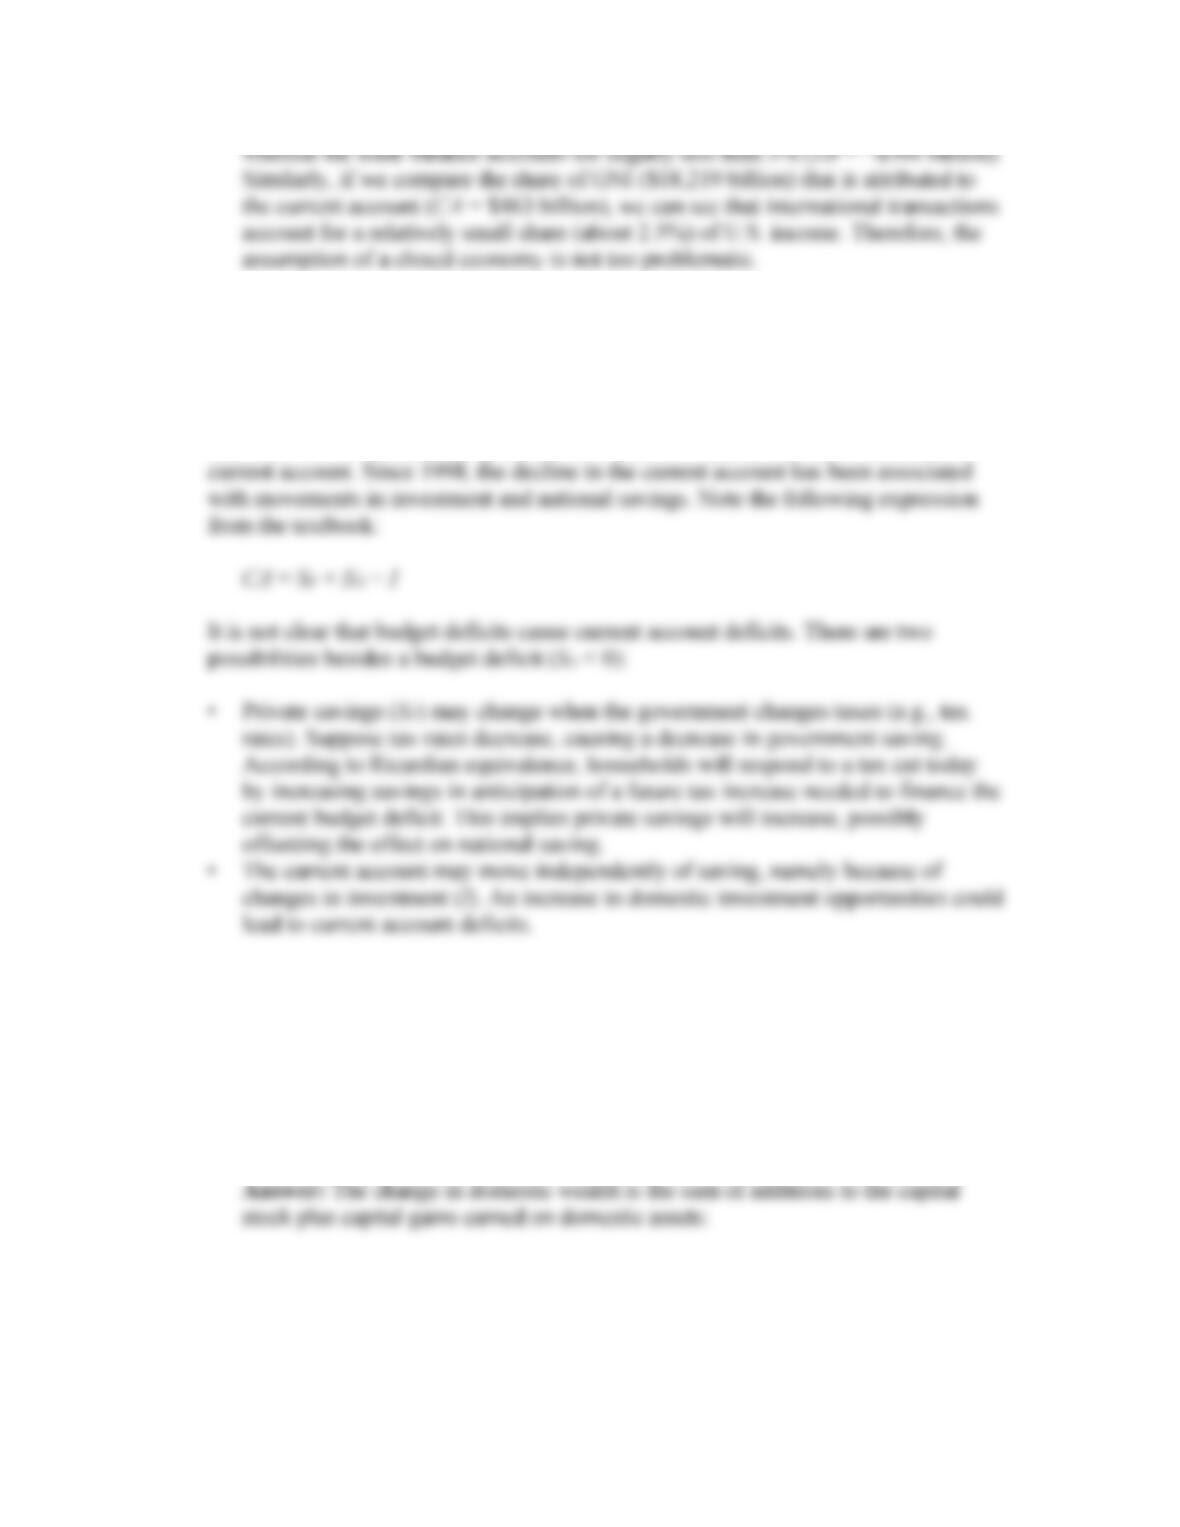
7. During the 1980s, the United States experienced “twin deficits” in the current account
and government budget. Since 1998 the U.S. current account deficit has grown
steadily along with rising government budget deficits. Do government budget deficits
lead to current account deficits? Identify other possible sources of the current account
deficits. Do current account deficits necessarily indicate problems in the economy?
Answer: “Twin deficits” are possible, but there are other factors that influence the
8. Consider the economy of Opulenza. In Opulenza, domestic investment of $400
million earned $15 million in capital gains during 2009. Opulenzans purchased $160
million in new foreign assets during the year; foreigners purchased $120 million in
Opulenzan assets. Assume the valuation effects total $5 million in capital gains.
N.B. We need to assume a value for the capital account. We will assume KA = 0 in
the following transactions.
a. Compute the change in domestic wealth in Opulenza.
Change in domestic wealth = I + Capital gains on K = $400 + $15 = $415 million
b. Compute the change in external wealth for Opulenza.
Answer: The change in external wealth is:
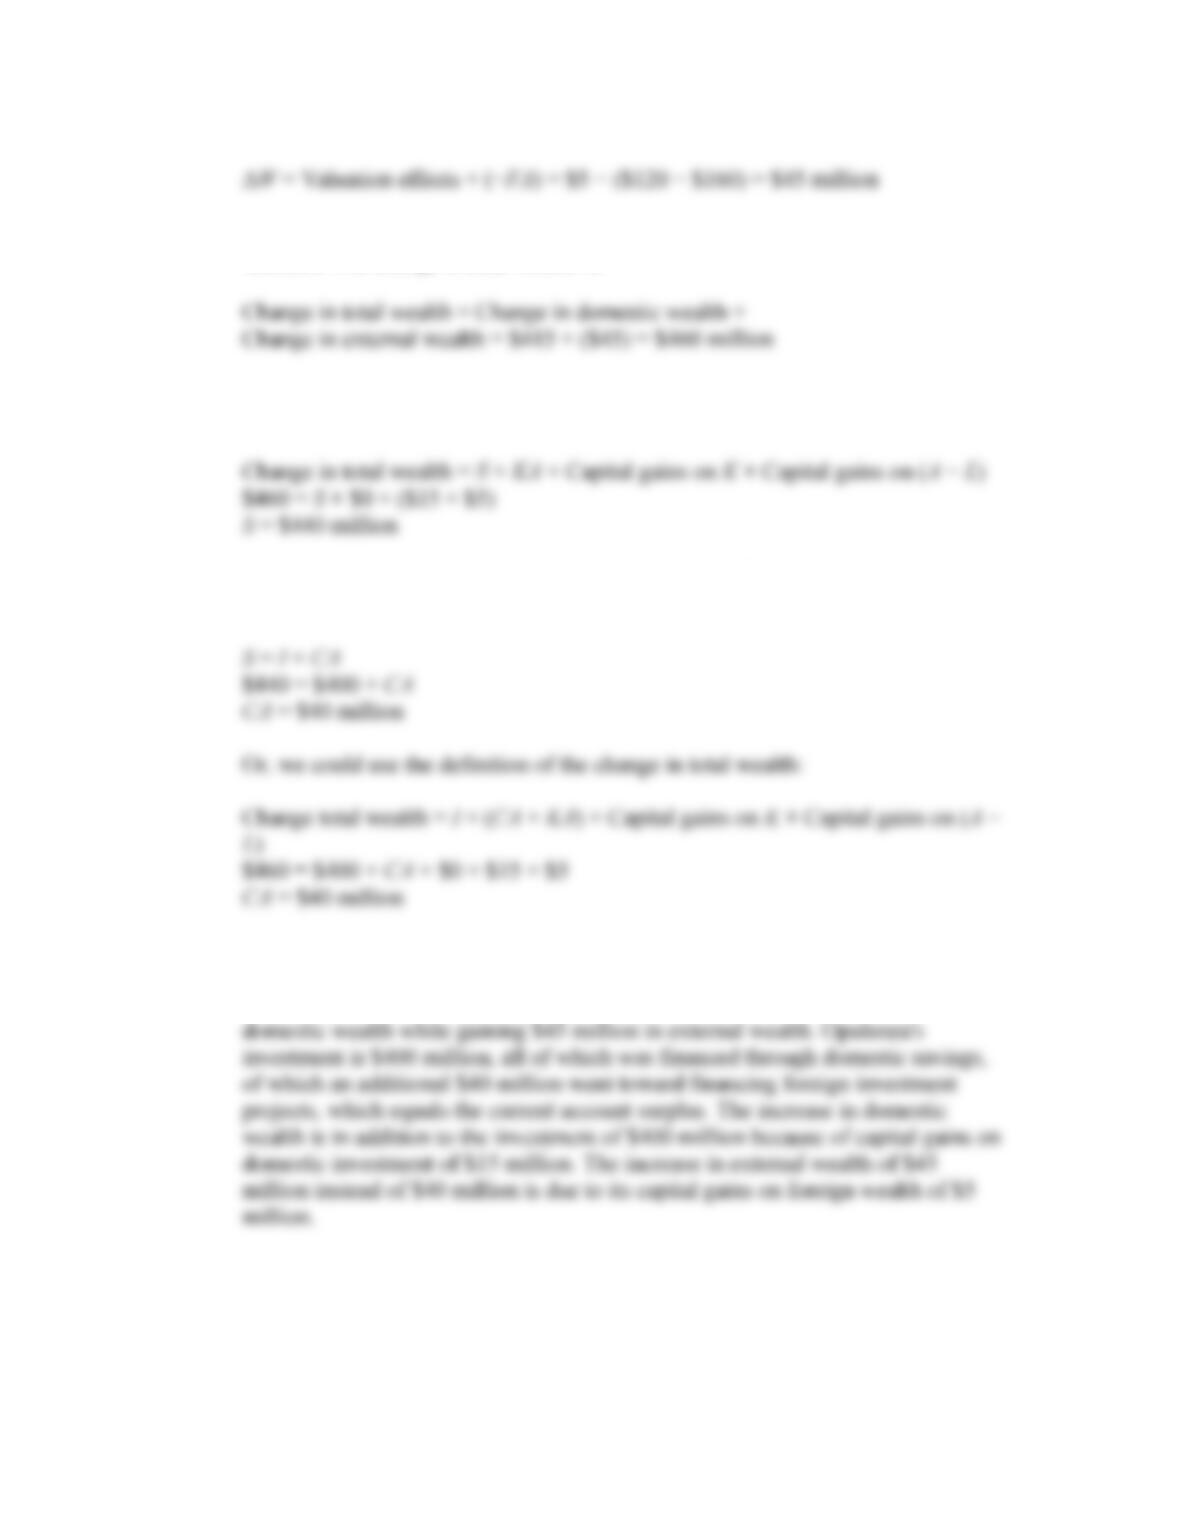
c. Compute the total change in wealth for Opulenza.
Answer: The change in total wealth is:
d. Compute domestic savings for Opulenza.
Answer: To calculate national savings, note that the change in total wealth is:
e. Compute Opulenza’s current account. Is the CA in deficit or surplus?
Answer: Using the current account identity S = I + CA:
f. Explain the intuition for the CA deficit/surplus in terms of savings in Opulenza,
financial flows, and its domestic/external wealth position.
Answer: We see that Opulenza experienced a $415 million increase in its
g. How would an appreciation in Opulenza’s currency affect its domestic, external,
and total wealth? Assume that foreign assets owned by Opulenzans are
denominated in foreign currency.
Answer: The answer to this question depends on how Opulenzan external assets
9. This question asks you to compute valuation effects for the United States in 2015,
using the same methods mentioned in the chapter. Use the bea.gov website to collect
the data needed for this question: look under the “International” heading.
Visit the BEA’s balance of payments data page and obtain the U.S. balance of
payments for 2015 in billions of dollars. Be sure to get the correct year, and annual
data, not quarterly.
Visit the BEA‘s net international investment position data page and obtain the
U.S. net international investment position for end 2014 to end 2015.
Answers may vary based on data revisions. The data below were obtained in March
2017.
a. What was the U.S. current account for 2015?
b. What was the U.S. financial account for 2015?
c. What was the U.S. change in external wealth for 2015?
d. What was the U.S. total valuation effect for 2015?
e. Does the answer to part (d) equal the answer to part (e) minus the answer to part
(c)? Why?
f. What do the BEA data indicate was the U.S. valuation effect due to exchange rate
changes for 2015?
g. What were end-2014 U.S. external liabilities? If 5% of these liabilities were in
foreign currency and were subject to a 10% exchange rate appreciation, what
decrease in U.S. external wealth resulted?
Answer: 2014 year-end U.S. external liabilities = $29,517,429 million
h. What were end-2014 U.S. external assets? If 65% of these assets were subject to a
10% exchange rate appreciation, what increase in U.S. external wealth resulted?
Answer: 2014 year–end U.S. external assets = $24,144,775 million
65% of these liabilities are subject to a change in value from FX-appreciation:
i. Using the answers to parts (g) and (h), what was the 2015 U.S. valuation effect
due to exchange rate changes according to your rough calculation? Is it close to
the BEA figure in part (f)?
Answer: Based on the previous answers, the valuation effects associated with
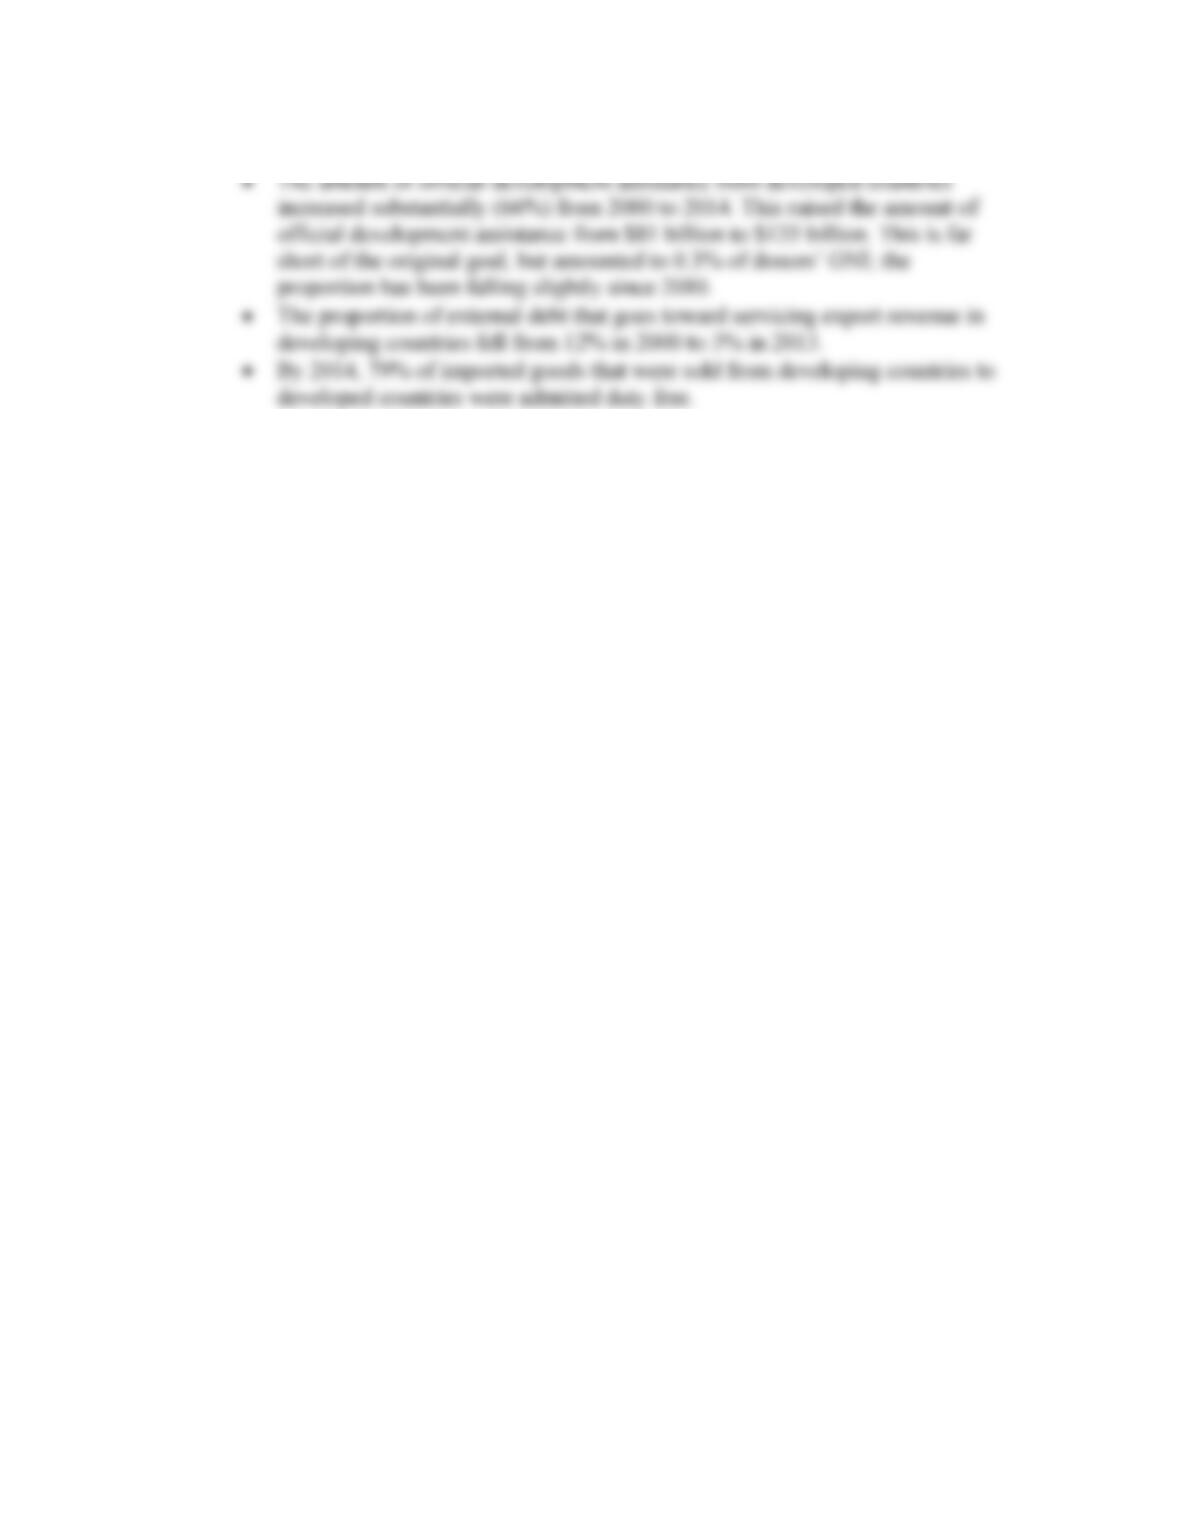
10. Go to the UN website and find out what the Millennium Development Goals are
(http://www.un.org/millenniumgoals). Go to the Gleneagles summit website and examine
the promises made (http://www.g8.gov.uk/). Use the web to check up on how well these
G8 promises are being kept, such as the UN goal of 0.7% of GDP in official development
assistance, the promise to eradicate export subsidies, and the aim to double aid by 2010.
(Hint: Search for Internet sites such as Oxfam or the Jubilee Debt Campaign, or look for
the World Bank Tools for Monitoring the Millennium Development Goals.)
Answer: This question could illicit a number of answers, as the Millennium