
INTERNATIONAL ECONOMICS, 7TH EDITION
Study Resources: Questions for Study & Review
Chapter 13
1. Draw the supply and demand for yen with the dollar/yen exchange rate on the vertical
axis. Americans’ taste changes and they now import European cars instead of
Japanese cars. Assume a fixed exchange rate regime and use your graph to answer
the following questions with clear, in-depth explanations:
a. Does the dollar appreciate, or depreciate, or stay put?
b. How would the Federal Reserve have to intervene to stabilize the exchange rate?
c. How would it sterilize the impact of its intervention?
2. When the Brazilian currency fell 55 percent against the dollar in the first few weeks of
2002, what was the expected impact on the trade balance?
a. Immediately (in the very short run)? (Why? Be specific, use a graph)
b. Six months later? (Why? Be specific, use a graph)
c. How is the Marshall–Lerner condition related to your answers above?
3. The market for foreign exchange. Construct the demand for and the supply of euros
using the U.S. demand for foreign imports and the European demand for U.S. exports.
Assume only two trade partners: the U.S. and Europe. Also, assume only one import
good, cars (VW) and one export good, computers (Macs).
a. The U.S. demand for euros is derived from the demand for VW cars.
Fill in the table below and use it to construct the U.S. demand for imports of VW
cars and the U.S. demand for euros.
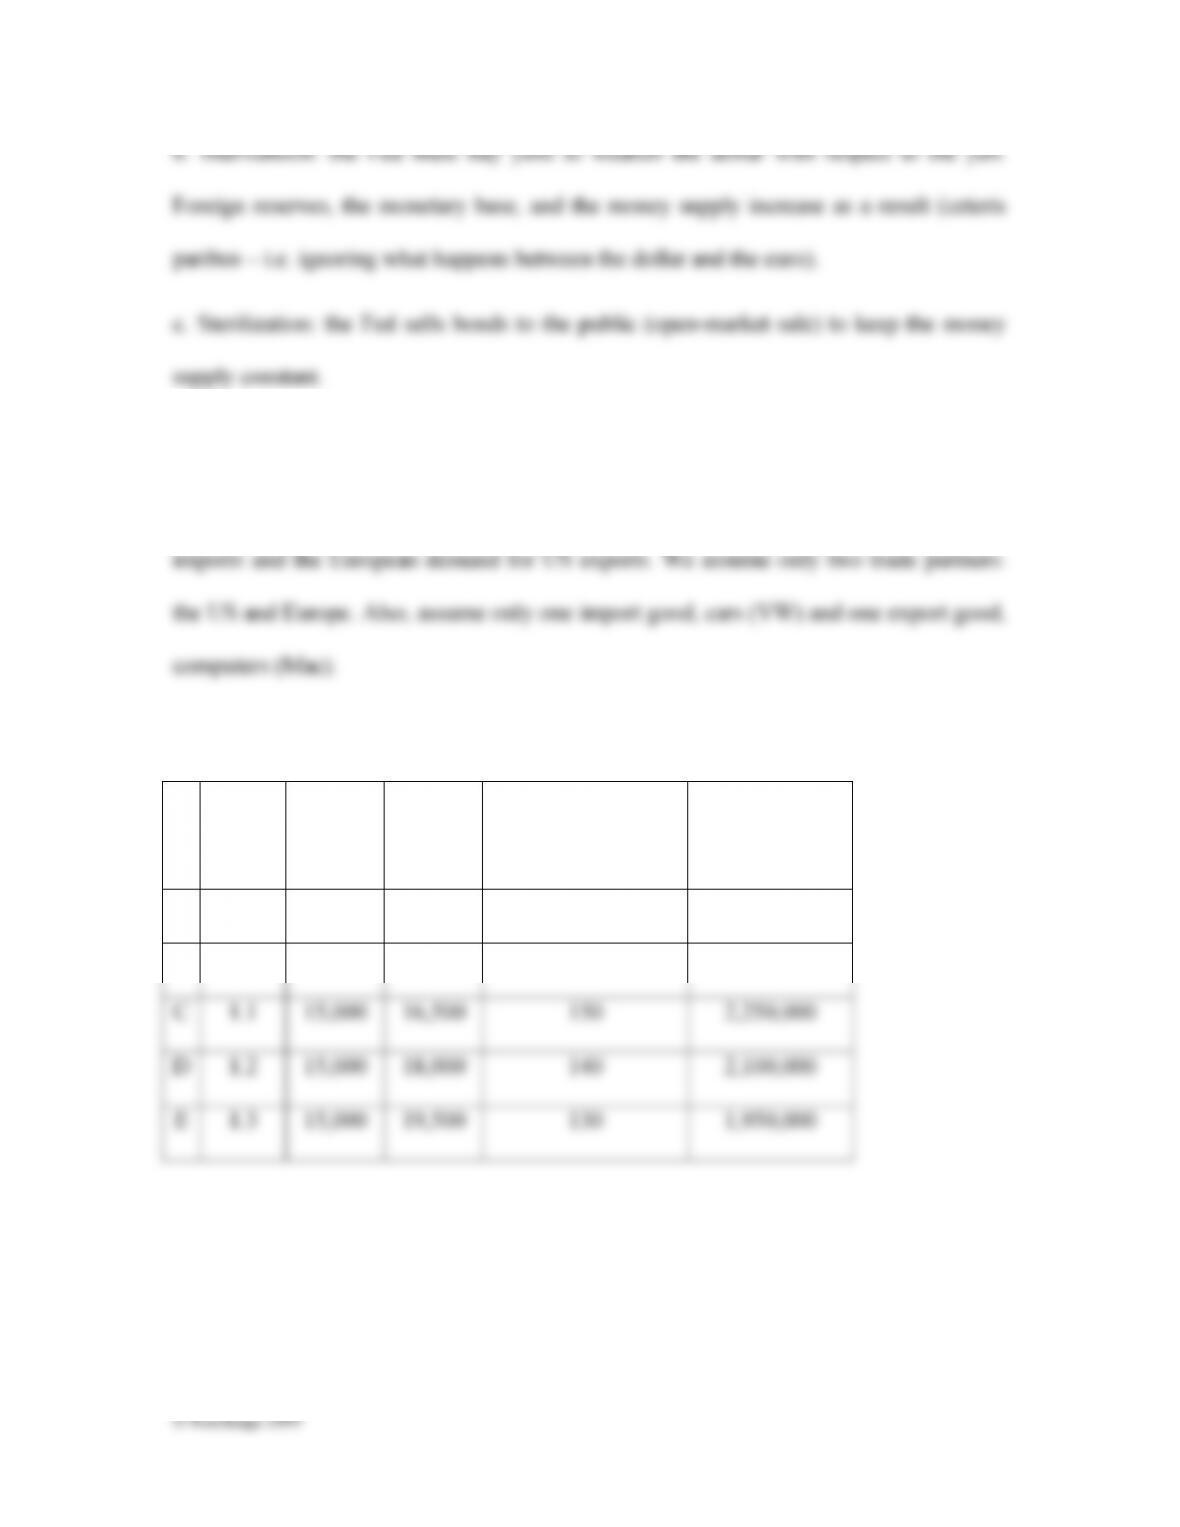
E ($/e) PVW in e€ PVW in $ M of VW (Quantity) Demand for e Value of M in e
A 0.9 15,000 170
B 1 160
C 1.1 150
D 1.2 140
E 1.3 130
Plot the relevant numbers on the following two graphs:
i. The U.S. demand for VW (PVW on the vertical axis and QVW on the horizontal
axis).
ii. The U.S. demand for euros.

b. The supply of euros to the U.S. is derived from the foreign demand for U.S. Macs.
Fill in the table opposite and use it to construct the foreign demand for U.S. Macs
(the U.S. supply of exports) and the U.S. supply of euros.
Plot the relevant numbers on the following two graphs:
i. The foreign demand for Macs (PMac in euros on the vertical axis and QMac on the
horizontal axis).
ii. The supply of euros to the United States.
Is the supply of euros always upward sloping? Why or why not? Calculate the arc
elasticity of foreign demand between I and J.
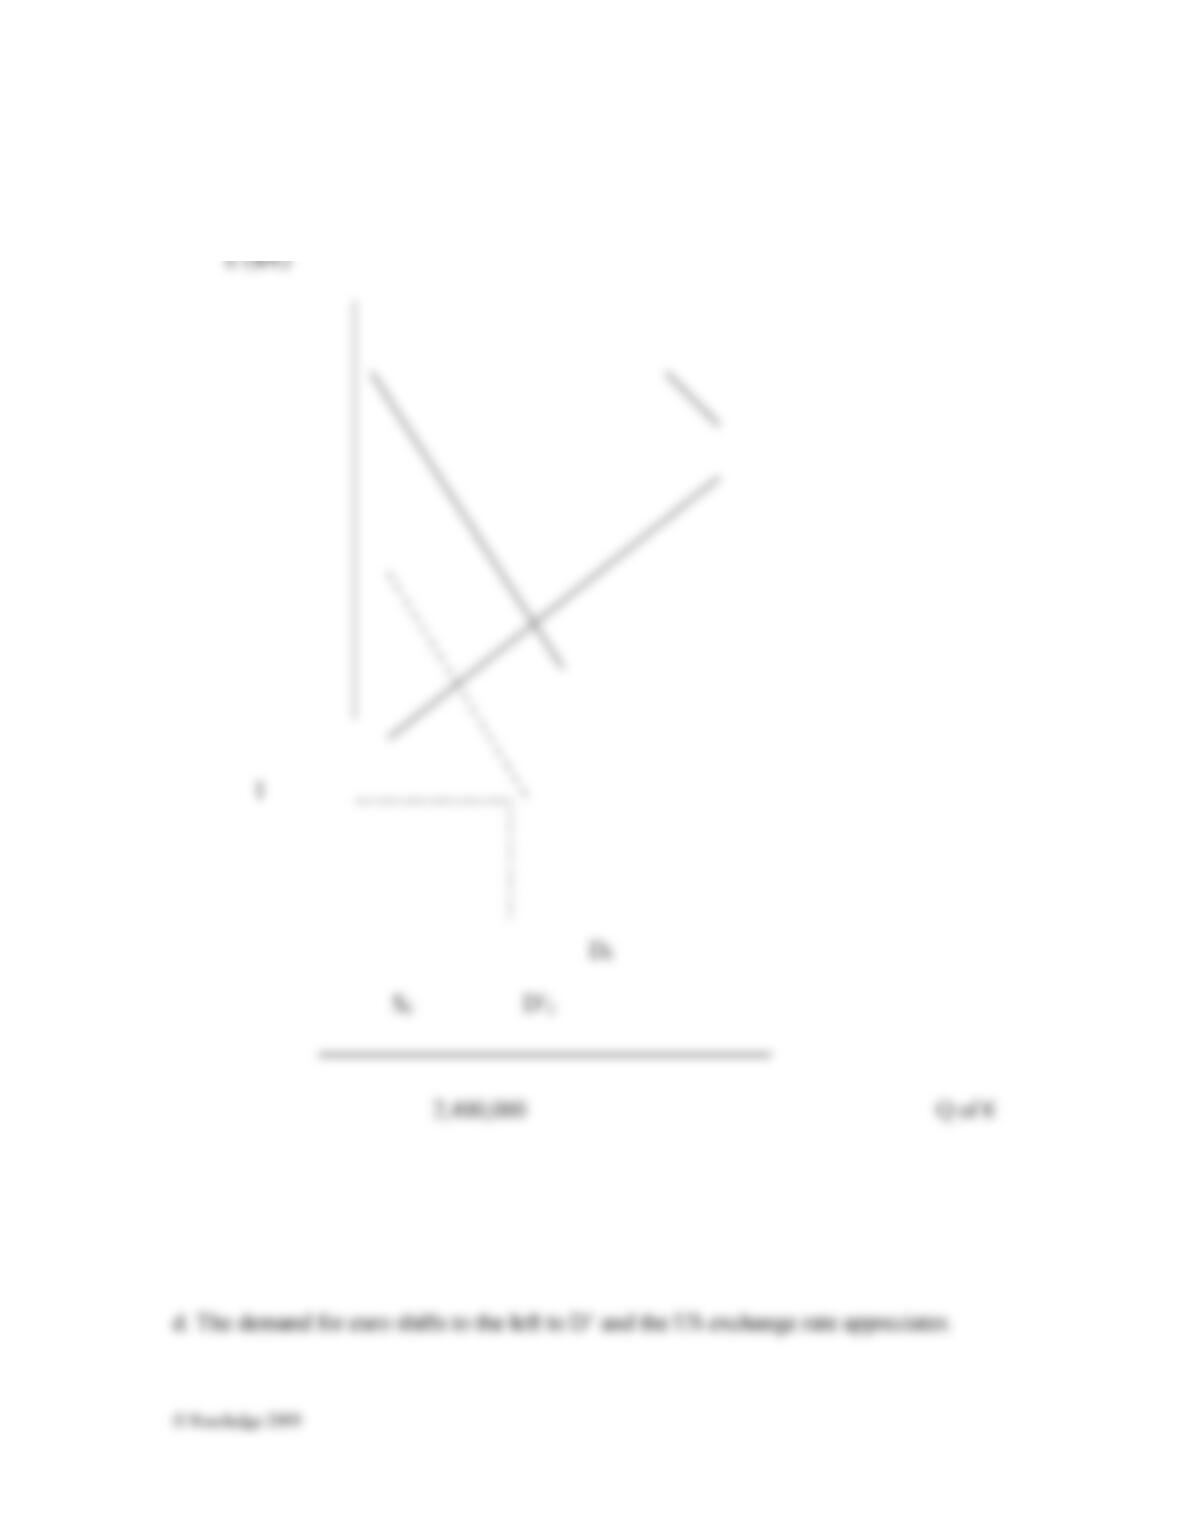
c. Put together the market for foreign exchange (S and D) and show the equilibrium
exchange rate and the equilibrium quantity of e traded. What is the equilibrium
exchange rate?
E ($/e) PMac in $ € PMac in e Supply for e X of Macs (Quantity) Value of X in e
F 0.9 2,000 1000
G 1 1200
H 1.1 1400
I 1.2 1600
J 1.3 1700
d. Now assume that, as a result of a change in taste, the U.S. public shifts some of its
demand for cars from VWs to domestically produced Saturn. Show the impact on
the foreign exchange market above. What happens to the U.S. exchange rate ($/e)?
e. Let us now assume that the U.S. and the Europeans agree together to peg their
exchange rate at the level calculated in (c.). What happens to the exchange rate
when the U.S. demand for cars shifts as in (d.) from European to U.S. cars?
f. Explain carefully the intervention process. What happens to the Federal Reserve
Bank’s foreign reserves? What is the impact on the money supply?
g. Finally, the Federal Reserve could counteract its effect on the money supply by
using monetary policy. Describe the necessary open market operation.
4. Assume that the exchange rate between the euro and the pound is 1.5e/£ originally.
Then the euro depreciates by 25 percent against the pound. The price of exports is e1
while the price of imports is £1. Due to the depreciation, European exports to the U.K.
increase from 10 to 11 and its imports drop from 10 to 9.
a. What happens to the European balance of trade with the U.K.? Calculate the
change in the European balance of trade.
b. Estimate the relevant elasticities (arc elasticities) to test whether the Marshall–
Lerner condition is met.

INTERNATIONAL ECONOMICS, 7TH EDITION
Study Resources: Questions for Study & Review
Chapter 13: Answers
1. Supply and demand for yen
E
3. The market for foreign exchange
Construction of the demand for and the supply of euros using the US demand for foreign
a. We use the numbers calculated in the table below to plot the graphs
E ($/€) PVW in € PVW in $ M of VW (Quantity) Value of M in €
Demand for €
A .9 15,000 13,500 170 2,550,000
B 1 15,000 15,000 160 2,400,000
i. The US demand for VW (PV16,500W on the vertical axis and QVW on the horizontal
axis)
ii. and the US demand for euros are plotted below:
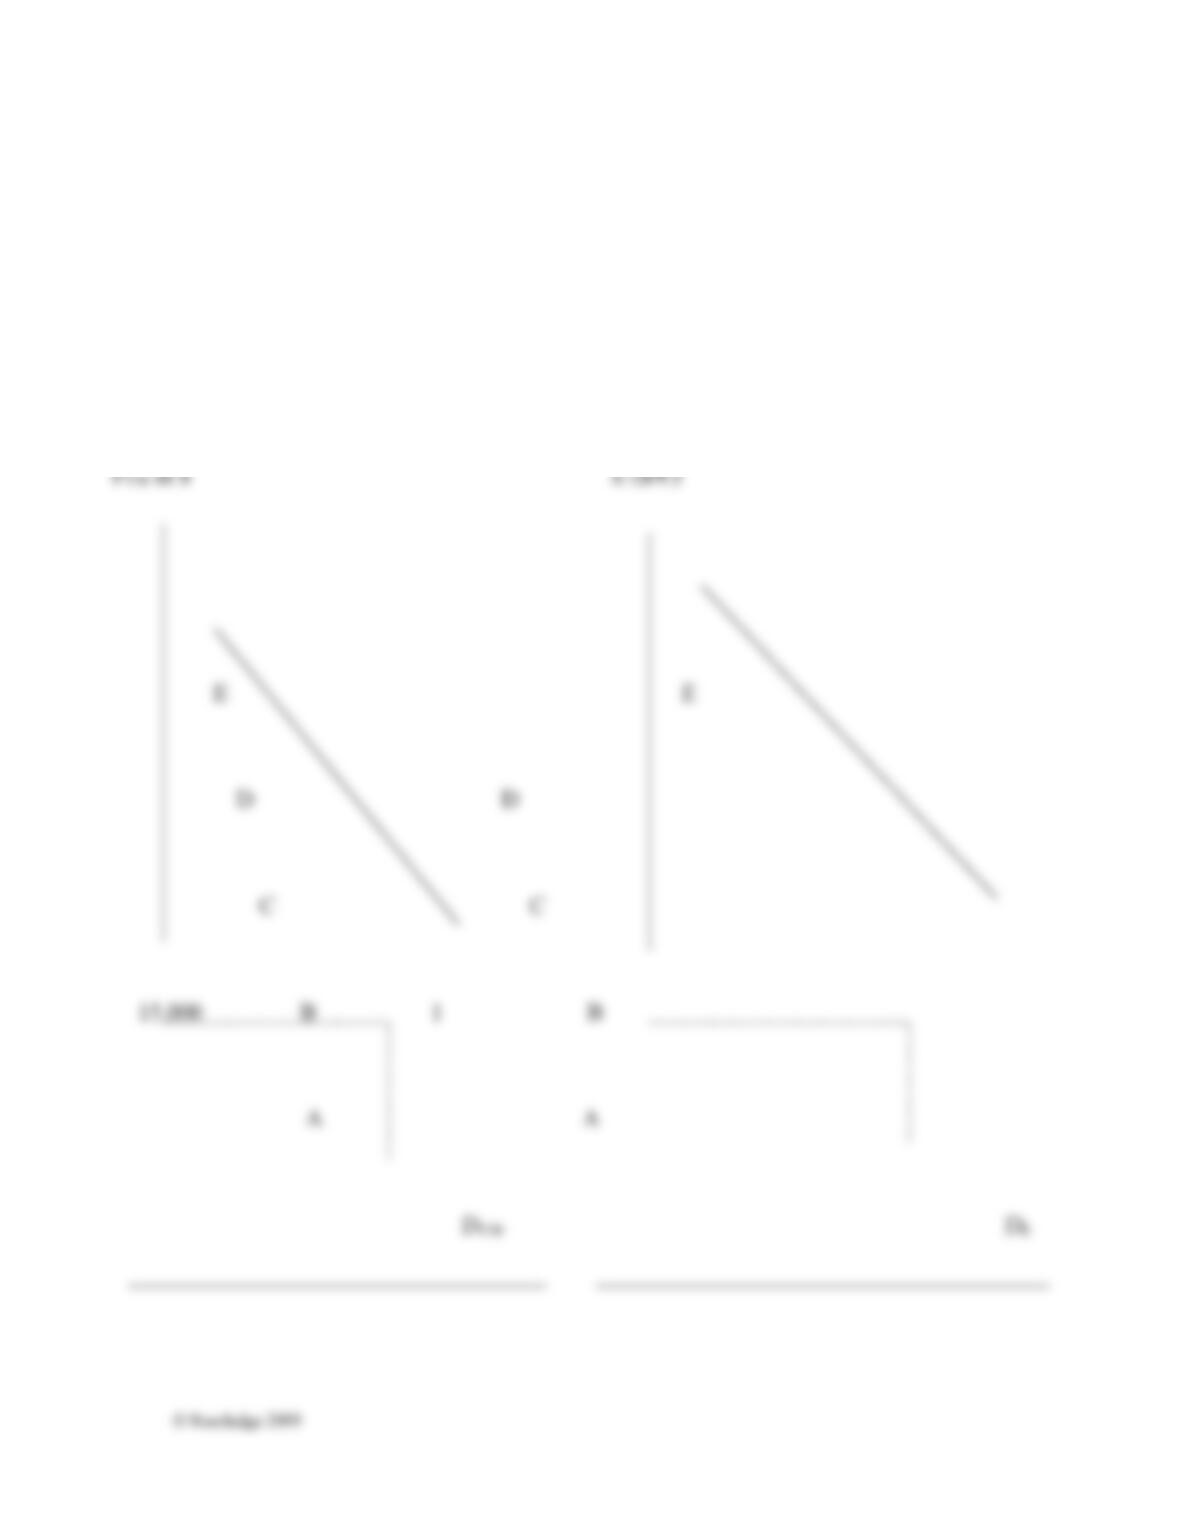
US demand for VW US demand for €
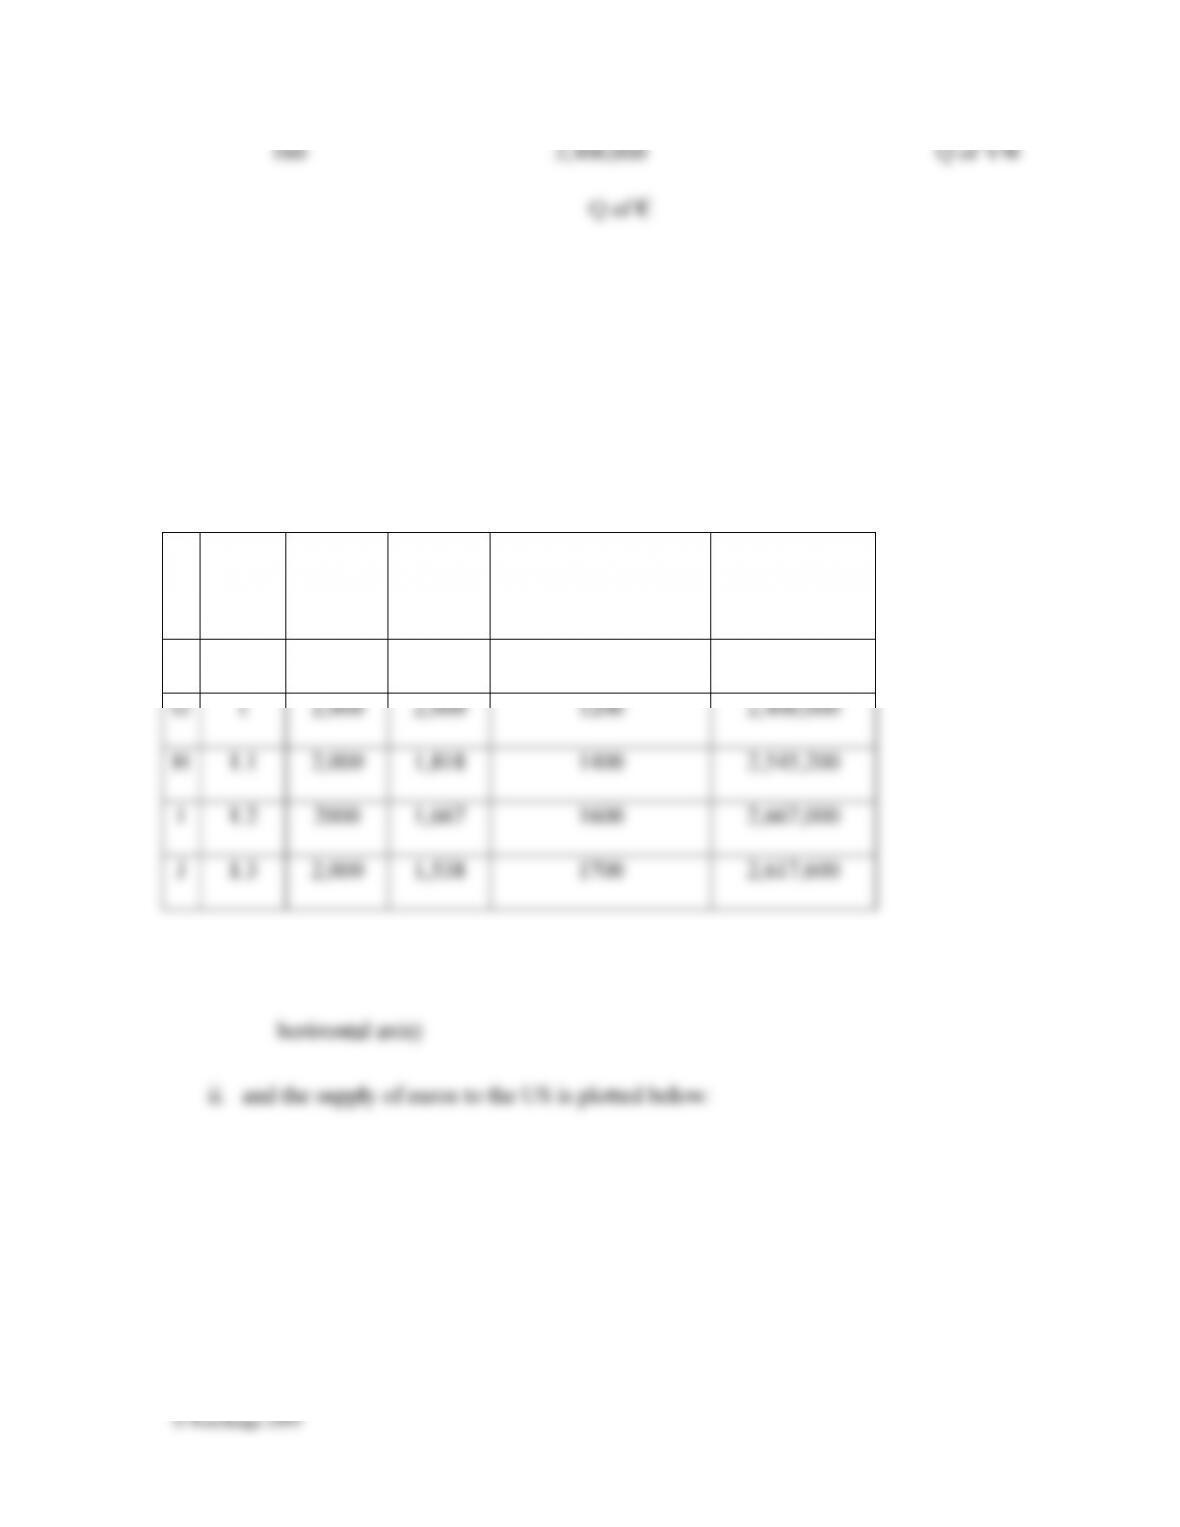
b. We use the table below to plot the points on the graph
E ($/€) PMac in $ PMac in € X of Macs (Quantity)
Value of X in €
Supply for €
F .9 2,000 2,222 1000 2,222,000
i. The foreign demand for Macs (PMac in euros on the vertical axis and QMac on the

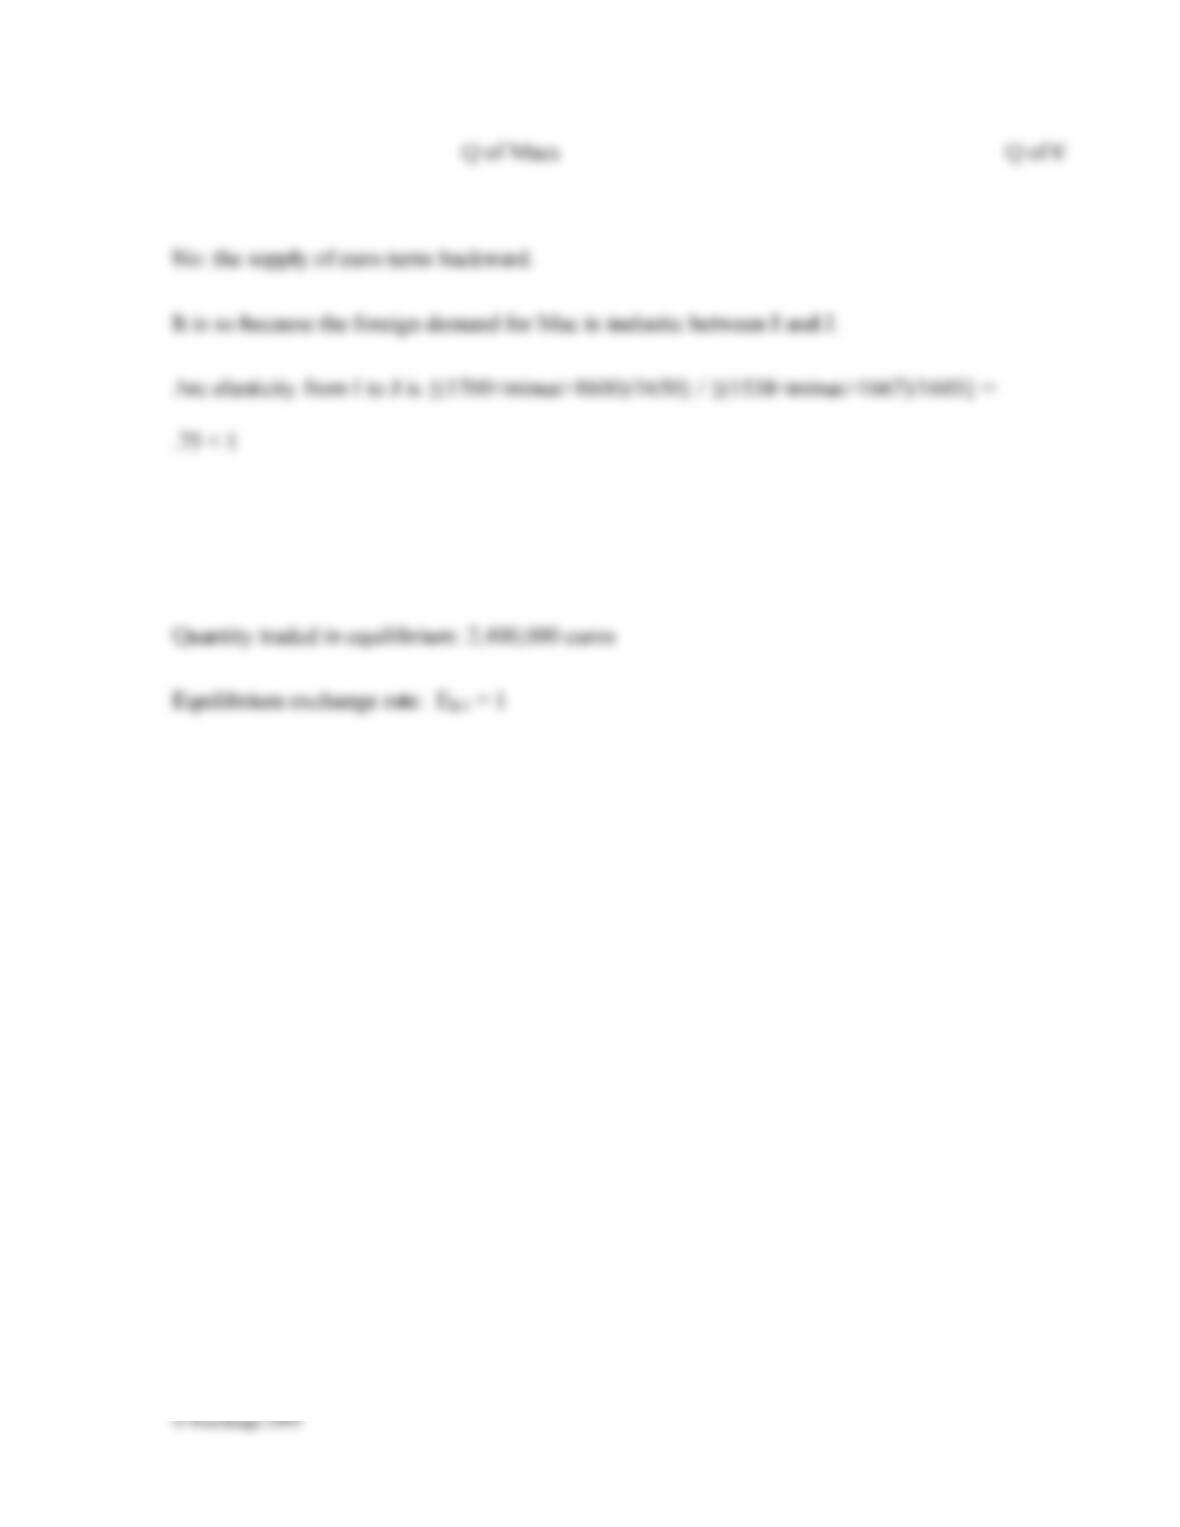
Foreign demand for Macs1 US supply of €
c.
e. The exchange rate does not change and remains at it pegged level.